


On Aug 17, the Bitcoin (BTC) price created a bullish engulfing candlestick and broke out above its previous high.
The higher prices could not be sustained, and BTC fell back below its breakout level the next day.
Bitcoin’s Failed Breakout
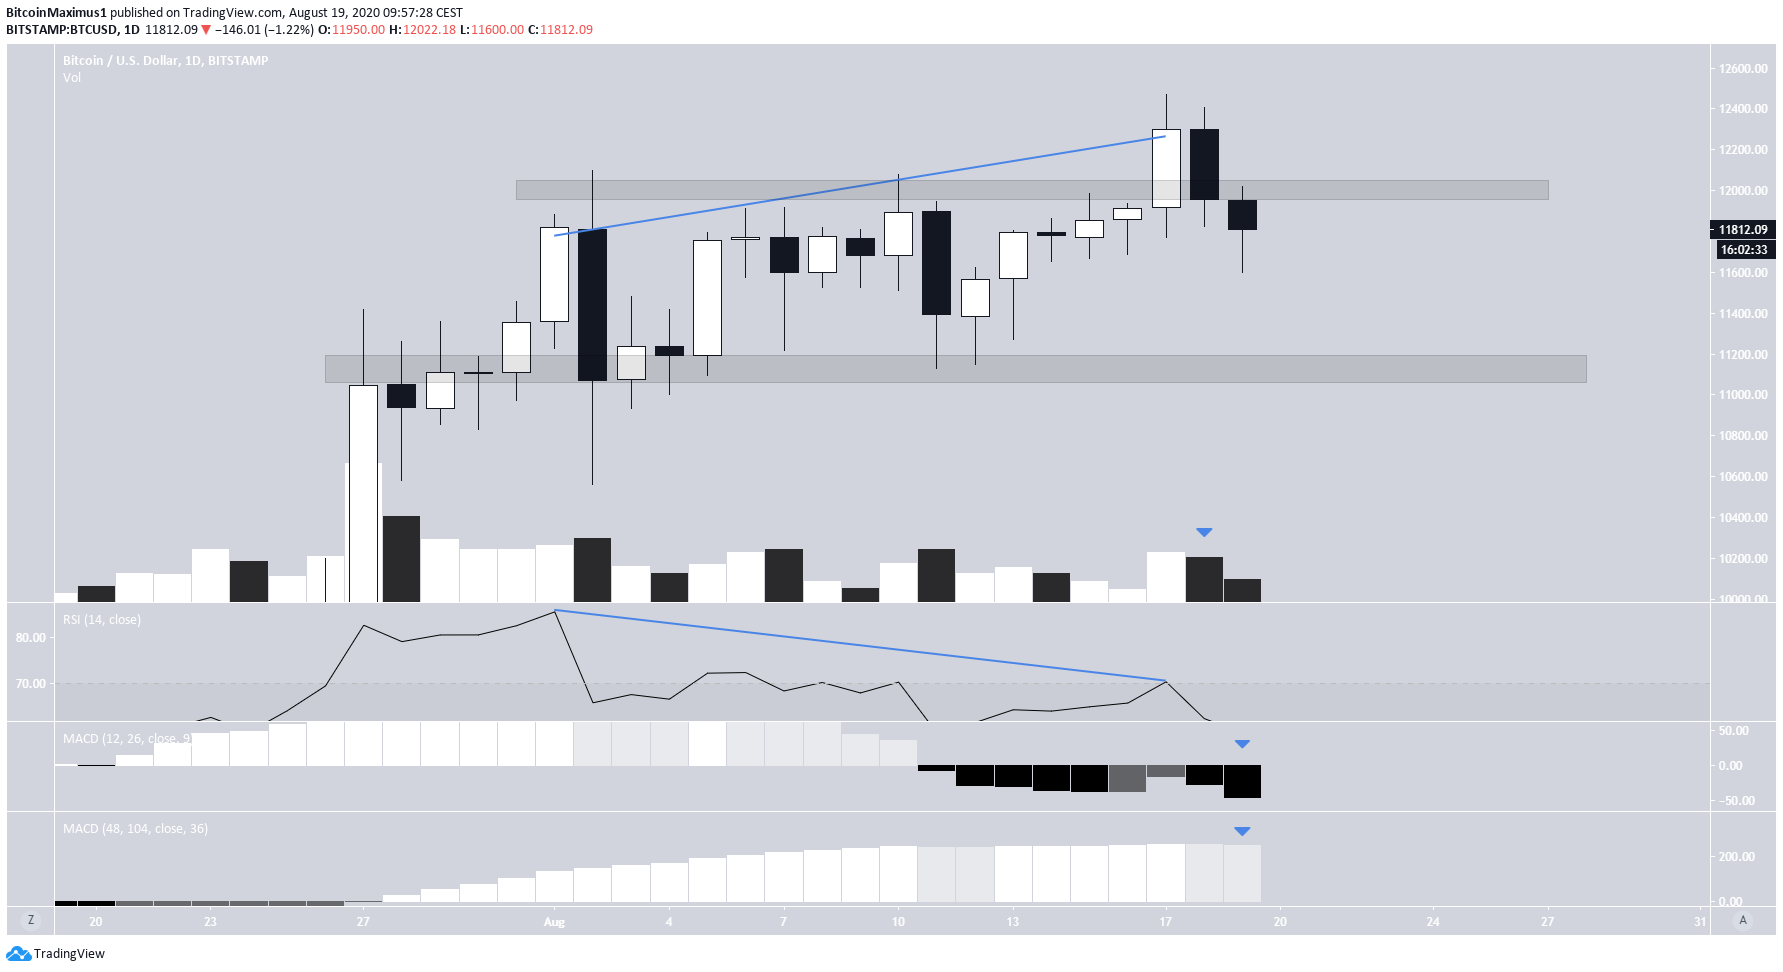
On Aug 17, the Bitcoin price broke out from the $12,000 area, which had been acting as resistance since the Aug 2 high. While the breakout initially seemed legitimate, the price decreased the next day and has already fallen below the breakout level.
The Aug 18 close was marginally higher than that of Aug 17, so it is possible that the current candlestick will create a long lower-wick and climb back to reclaim the $12,000 area. This possibility seems rather unlikely though when we consider other signals.
Technical indicators are bearish. The daily RSI has generated very significant bearish divergence. The short-term MACD has started to move down once more, after what seemed to be an attempt at a reversal a few days ago. The long-term MACD has also begun to lose strength, giving a possible bearish reversal signal, assuming a negative close today.
There is long-term support near $11,100.
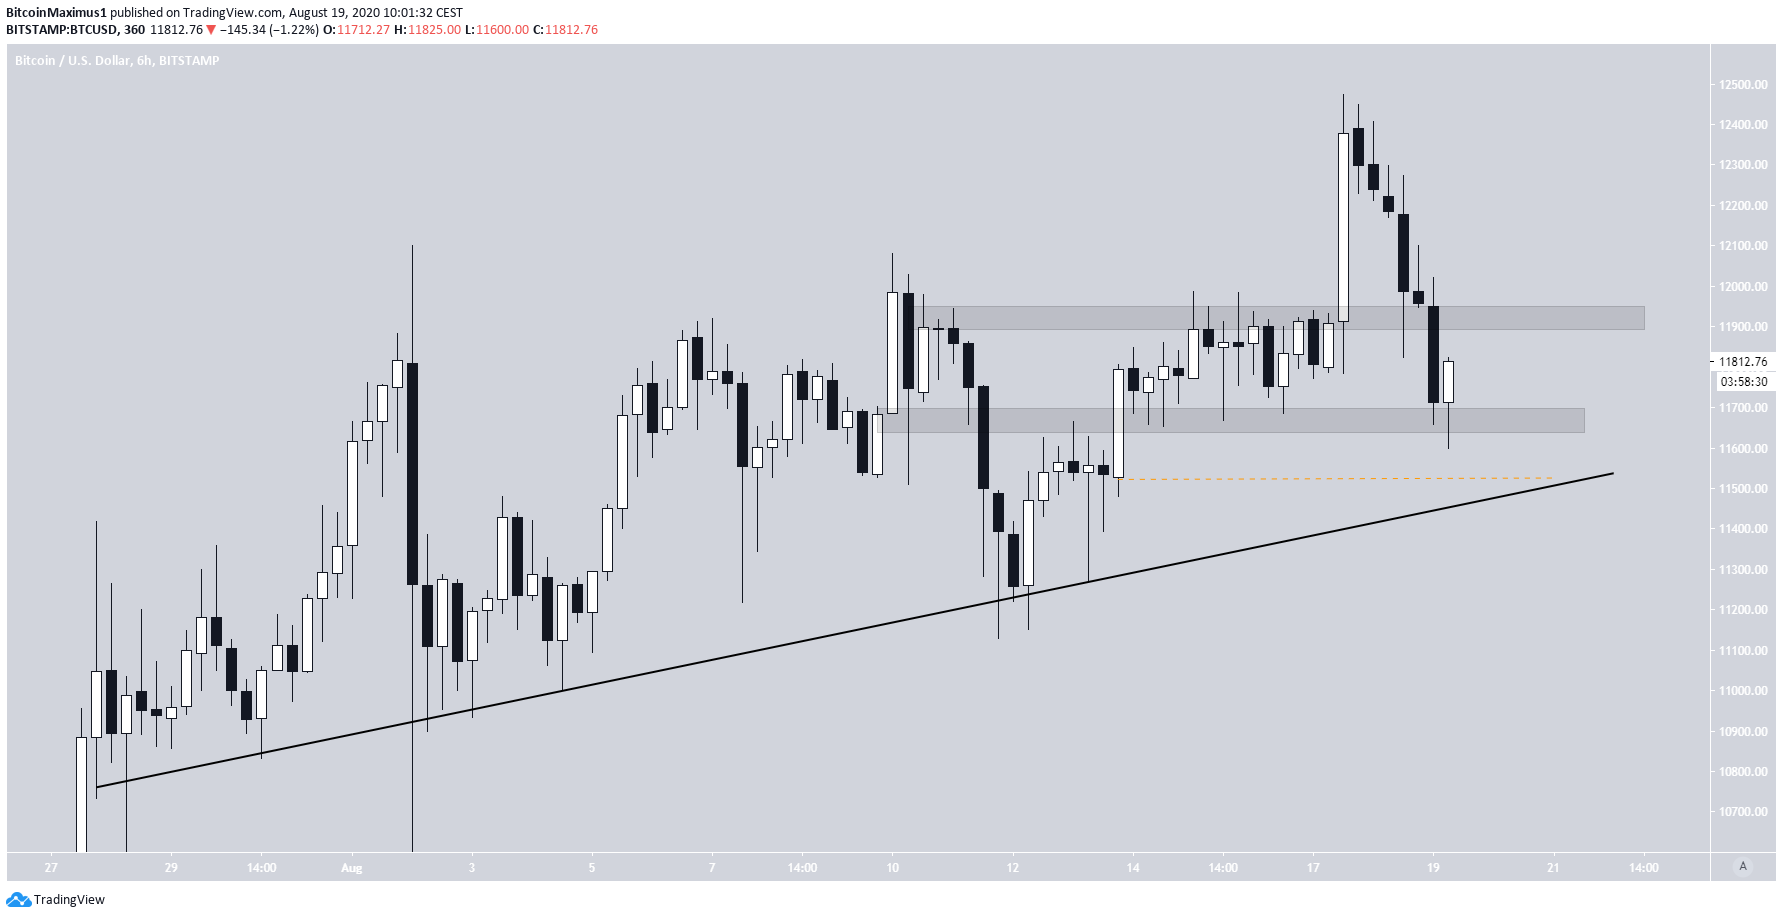
The shorter-term chart reveals a possible ascending support line near $11,500, provided by the bullish engulfing candlestick on Aug 14.
In addition, we can see a shorter-term range between $11,950 and $11,650. While reclaiming the former would be bullish, it does not seem likely at the current time.
Bearish Wave Count
In yesterday’s analysis, we stated,
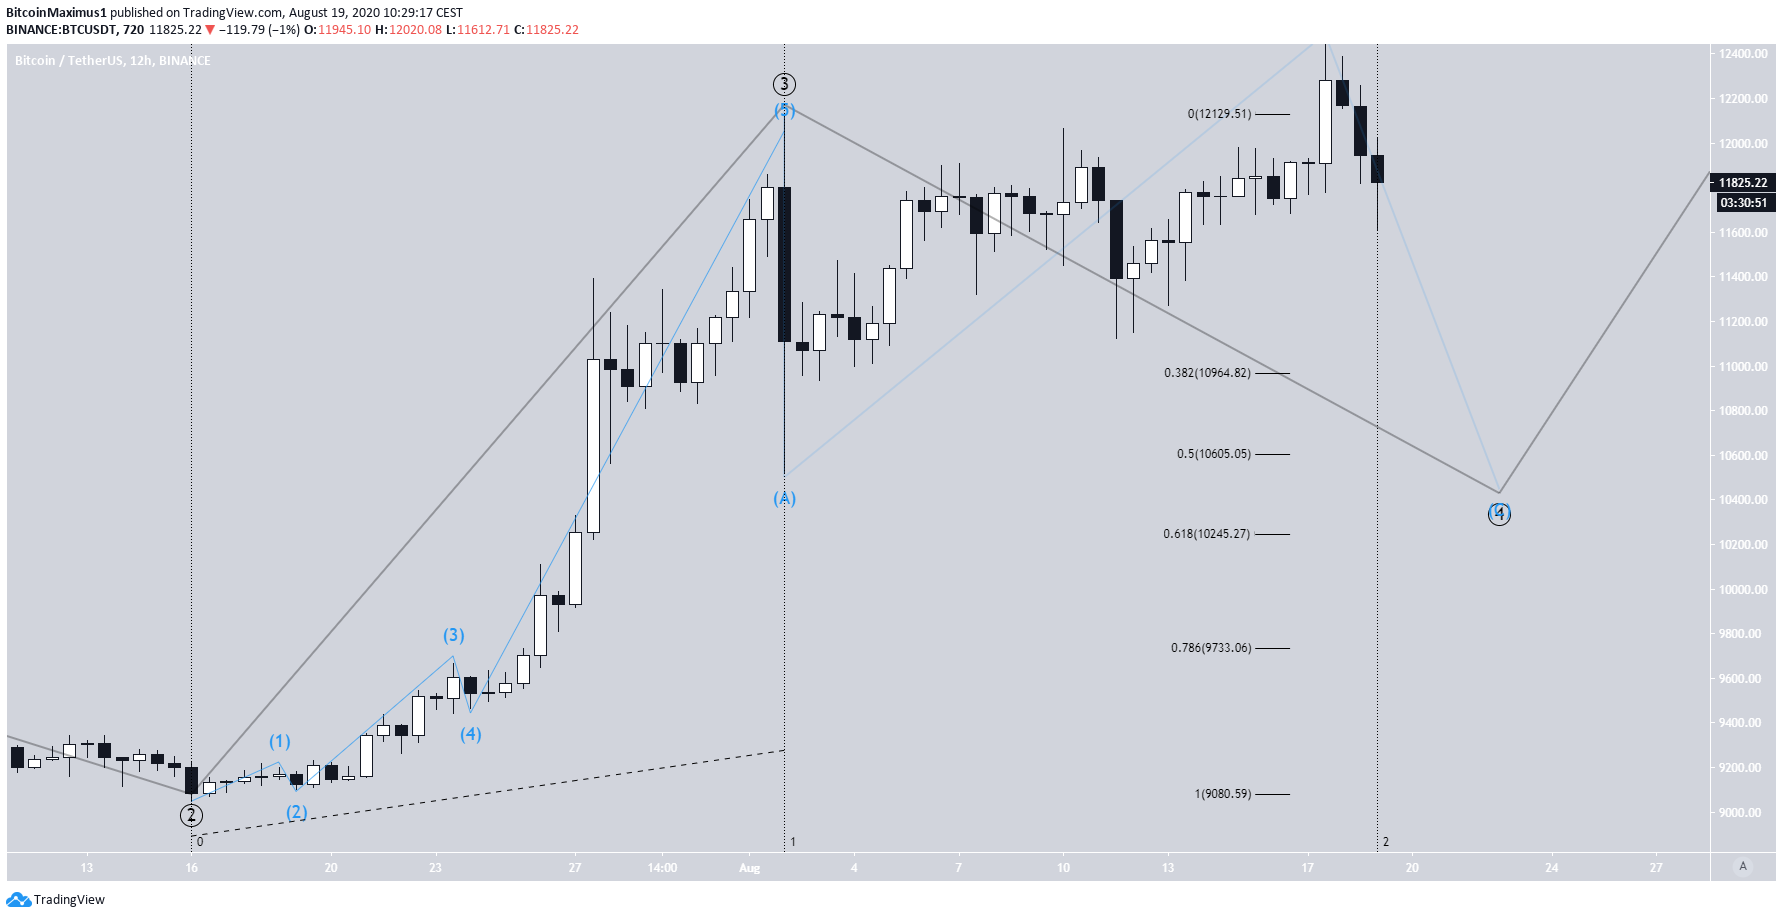
Since the Aug 2 breakdown, the price has been making higher lows. However, due to the considerable overlap and sub-wave formation, it’s possible that the upward movement is corrective rather than impulsive.
Yesterday’s decrease makes that even more likely, possibly suggesting that the price has completed the B sub-wave of an A-B-C formation (blue) that began on Aug 2.
If the price has begun its C sub-wave, there are four main levels where it could likely end: $10,954, $10,605, $10,245, and $9,732, found by relevant fib levels of wave 3 (black).
In addition, the correction has already taken the same amount of time as wave 3, and since sub-wave A was also swift, the same would be expected for C.
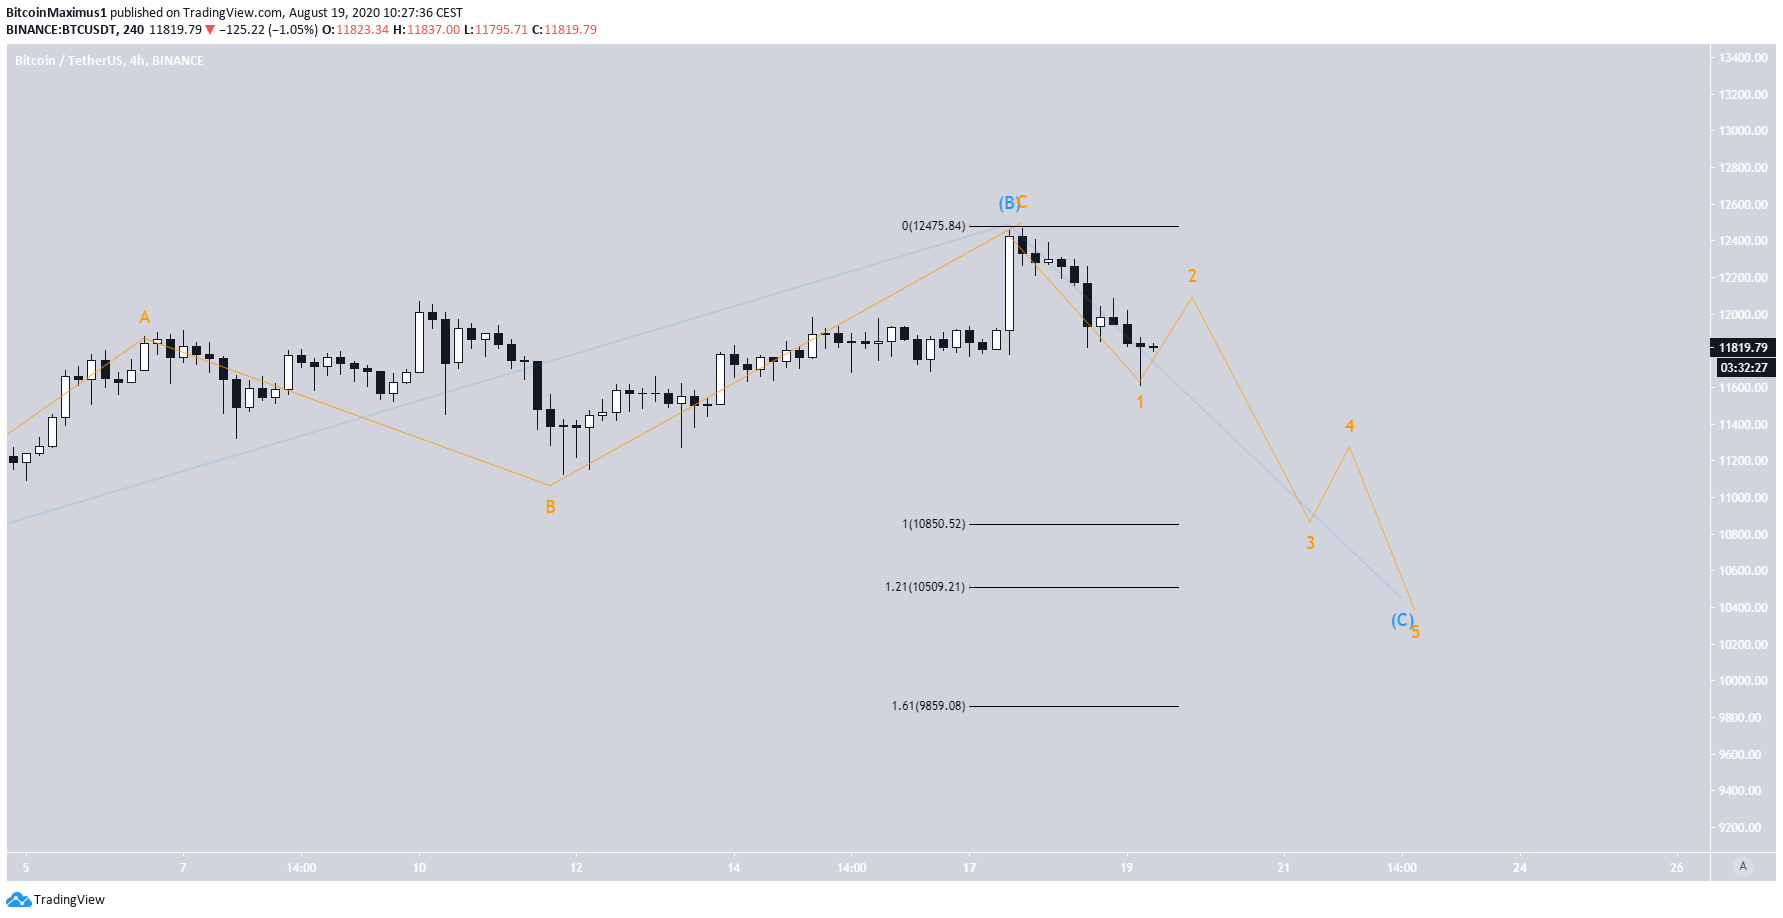
We can map the decrease by outlining a possible five-wave count (orange) for wave C. In addition, using the length of sub-wave A can be helpful in determining a low.
There are three projections we can use for the Fib levels of the entire sub-wave A. These are 1, 1.21, and 1.61, equating to prices of $10,850, $10,509, and $9,659, respectively. The 1 and 1.61 Fib levels are more common, and the values overlap with important Fib levels from the previous chart.
Therefore, the two most likely ranges for wave C to end would be between $10,954-$10,850 (0.382 Fib of wave 3 and 1 of sub-wave A) and $9,659-$9,732 (0.786 and 1.61).
Alternate Wave Count
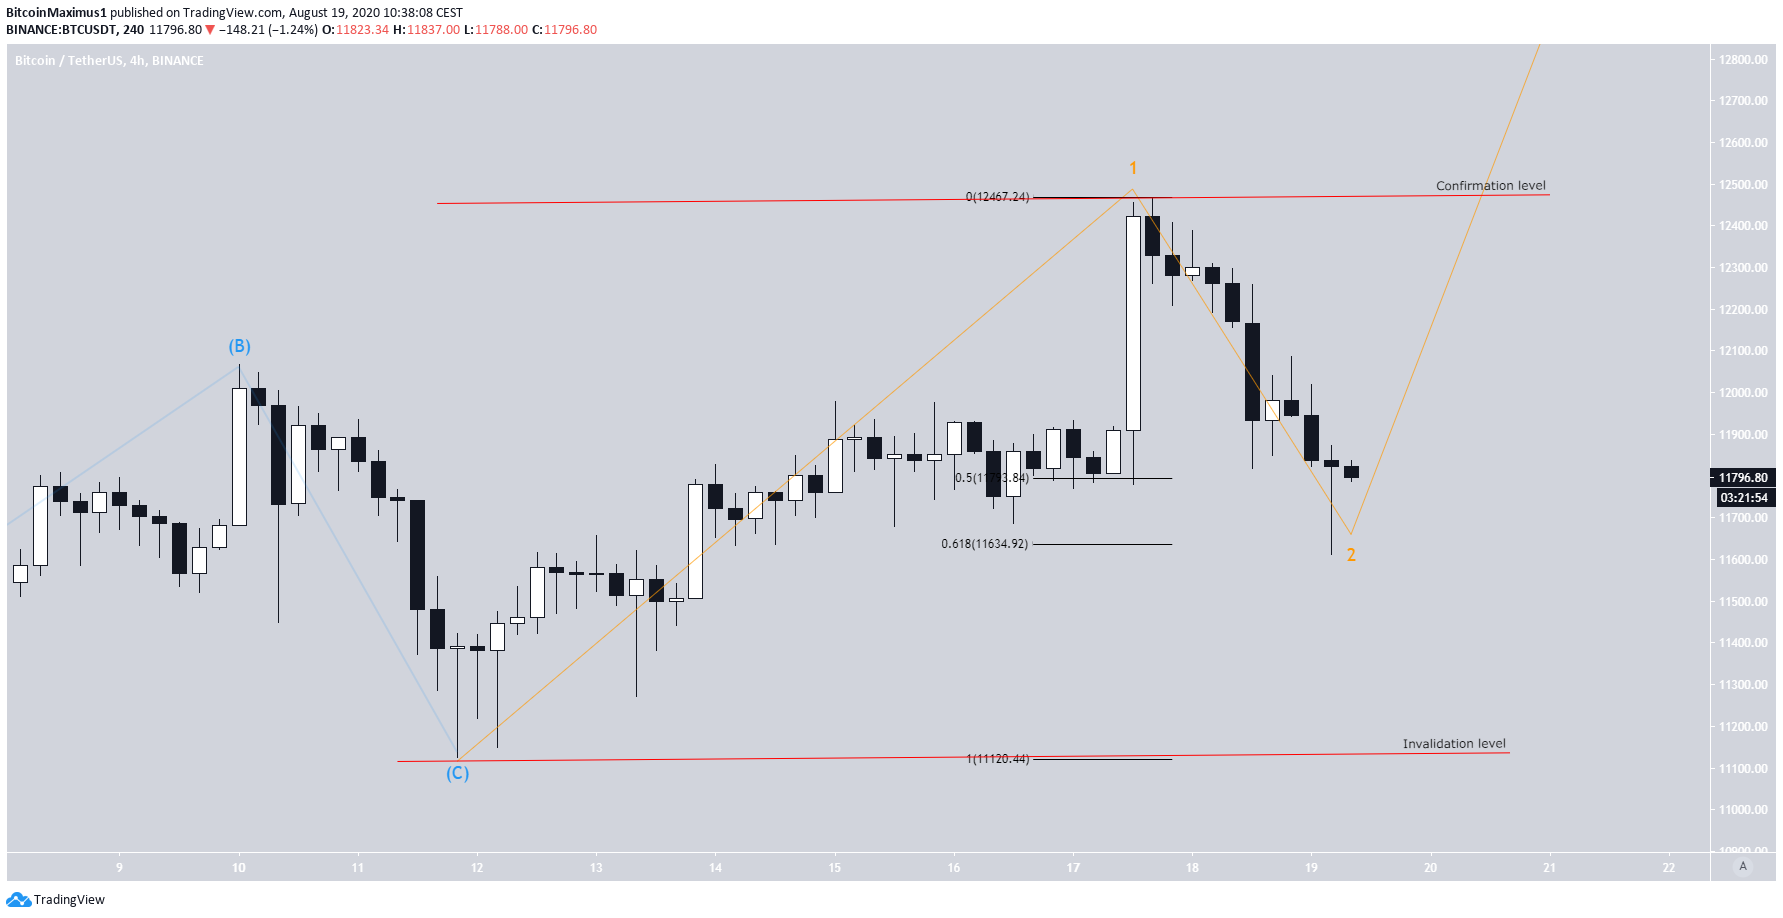
If we go by an alternate wave count and assume that the C wave ended on Aug 12, it could mean that BTC has already begun wave 5. Due to the bearishness of the technical indicators outlined in the first section and the unusual shape of sub-wave C, this is more than likely not the correct wave count, but it is still valid.
In this scenario, the price has completed sub-wave 1 and is now correcting. The level that the correction is expected to end is found between $11,634 and $11,804.
This wave count would be invalidated by a decrease below $11,120 and confirmed by an increase above $12,467.
For our previous analysis, click here.


