


The Bitcoin (BTC) price has been trending down for a period of 364 days from its all-time high. Despite this, it’s unknown whether or not a bottom has been reached.
The Bitcoin price has been increasing above an ascending support line since the end of 2018. After a year-long fall from its all-time high, BTC again reached this line near $15,479 in November 2022.
Bitcoin in 2023 And Beyond
The low validated the long-term ascending support line and created a bullish divergence in the weekly RSI (green line) after the indicator moved outside of its oversold territory. Bullish divergences in the weekly time frame are very rare.
However, the RSI has yet to break out above its bearish divergence trendline (black). Whichever trendline breaks first could determine the direction of the trend.
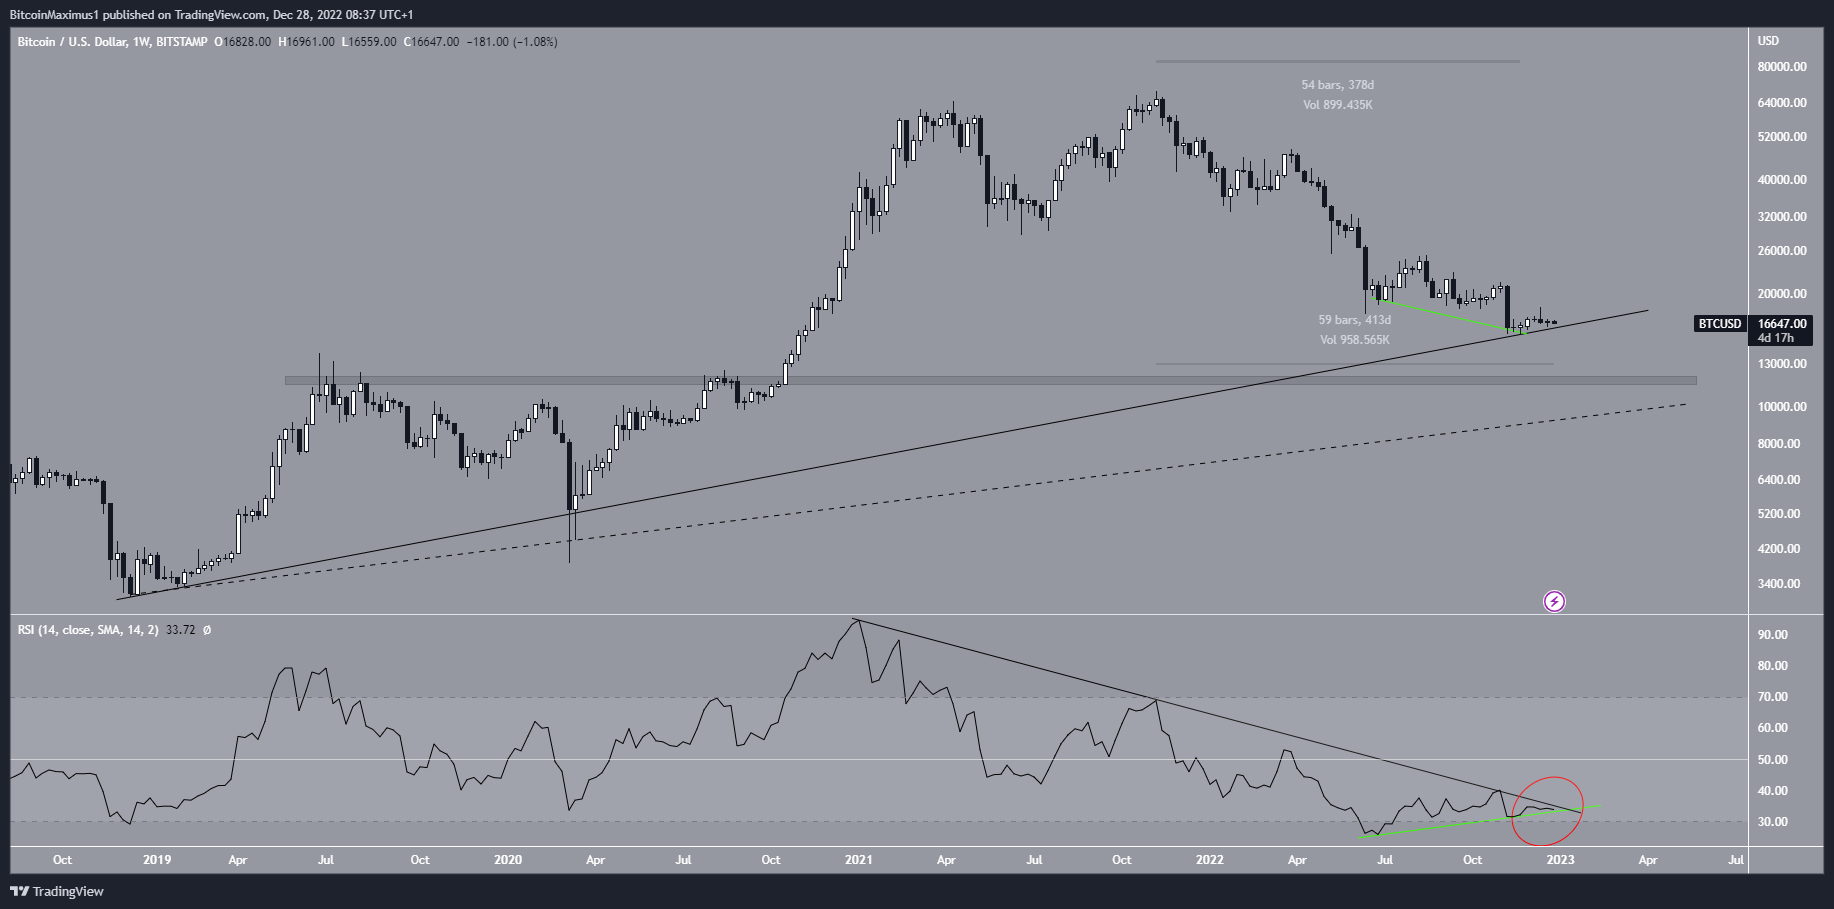
If the Bitcoin price does not break down from the ascending support line, it could rally in 2023. If the BTC price breaks down, it could fall back to test a previous horizontal support and a long-term ascending support line near $12,000 (dashed).
Unprecedented Bear Market
Even though technical analysis readings are not yet bullish, cyclical periods relating to halving suggest that a bottom will be reached soon. Historically, a bottom has been reached 517-547 days before the halving. The next halving is only 491 days away.
Moreover, if the BTC price does not close above $19,422 on January 1, 2023, it would mark the first time in history that all four quarterly candles are bearish. Since there are only three days left until the quarterly close, this seems likely. Therefore, the current bear market is already in unprecedented territory.
Another Bitcoin price analysis can be done by measuring the number of days from the all-time high to the bottom. In the 2013-2015 bear market, it took 410 days for the bottom to be reached. In the 2017-2018 market downturn, it took 363 days.
If Bitcoin bottomed in November 2022, it would mean the bear market lasted 364 days. And if a bottom has not been reached yet, the bear market has been ongoing for 413 days.
If a bottom has not yet been reached, this would be the longest crypto bear market to date.
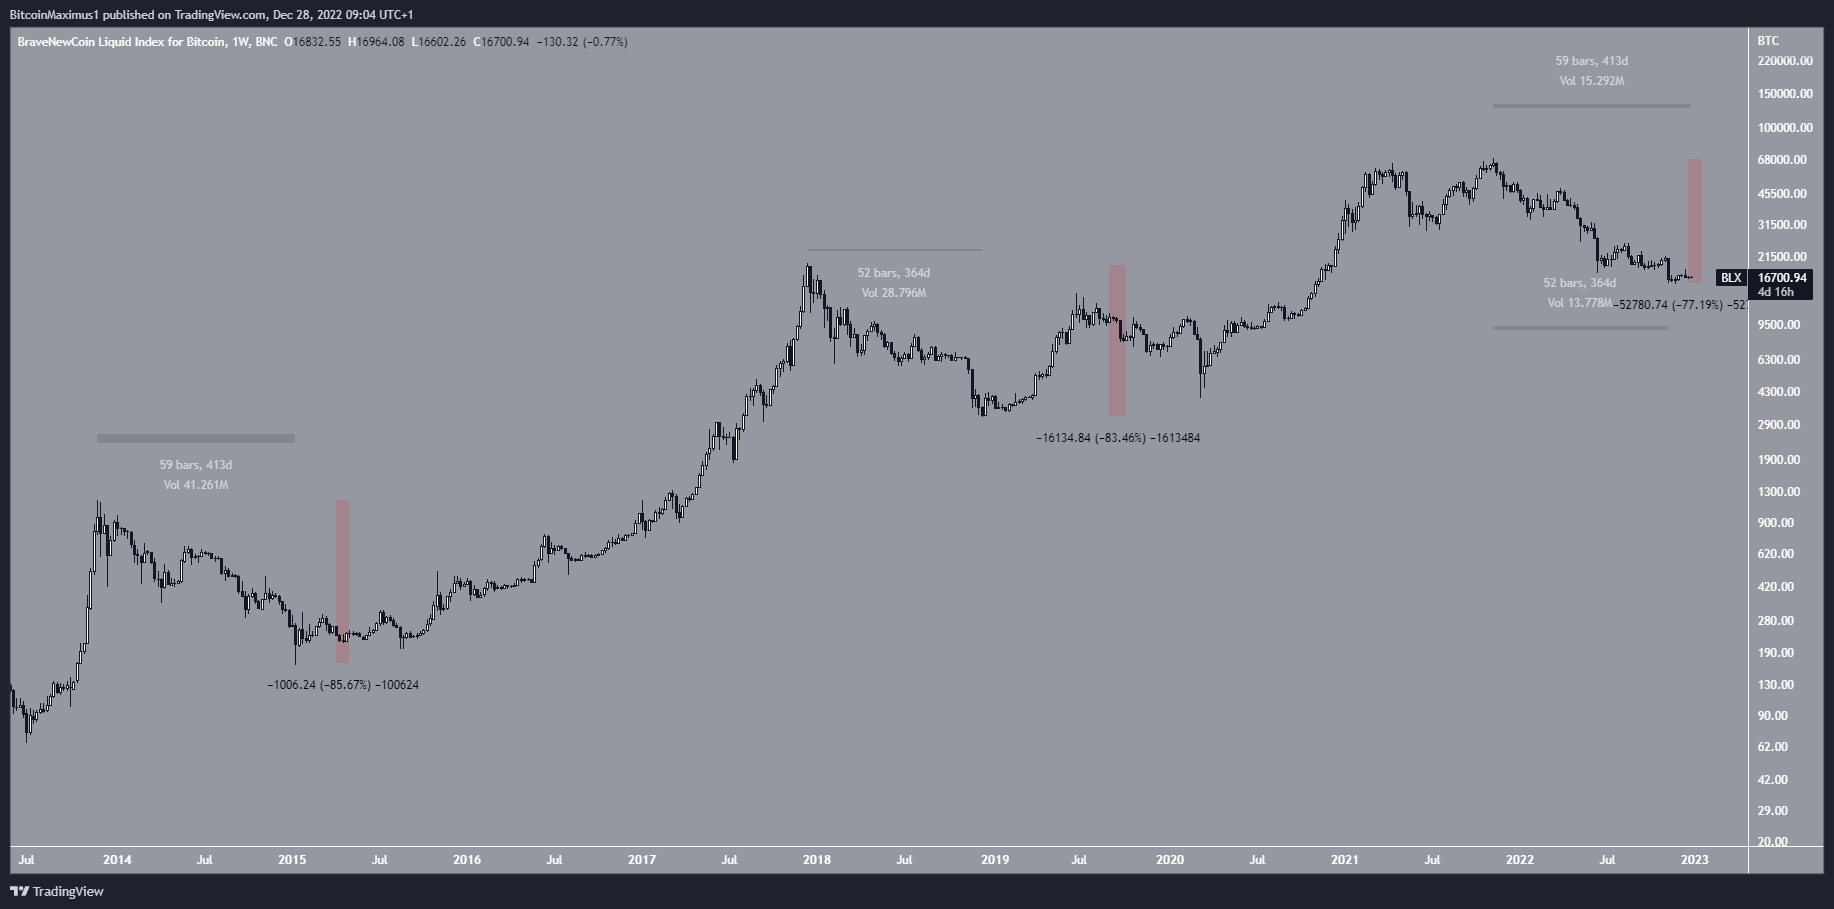
However, the downside has not been unprecedented in terms of percentage loss. The BTC price fell by 86% in the 2014/2015 bear market and fell by 83% in 2018. The current BTC price has fallen by 77% from its all-time high.
So in this regard, this has been the mildest bear market yet.
For BeInCrypto’s latest crypto market analysis, click here.


