


The Bitcoin price experienced a relatively volatile trading day on June 17, initially decreasing considerably to reach a low of $9,236. However, the lower prices were bought up, creating a long lower-wick in the process.
This is a bullish sign that suggests Bitcoin is likely to break out form both its short and long-term trading patterns.
Bitcoin Descending Resistance
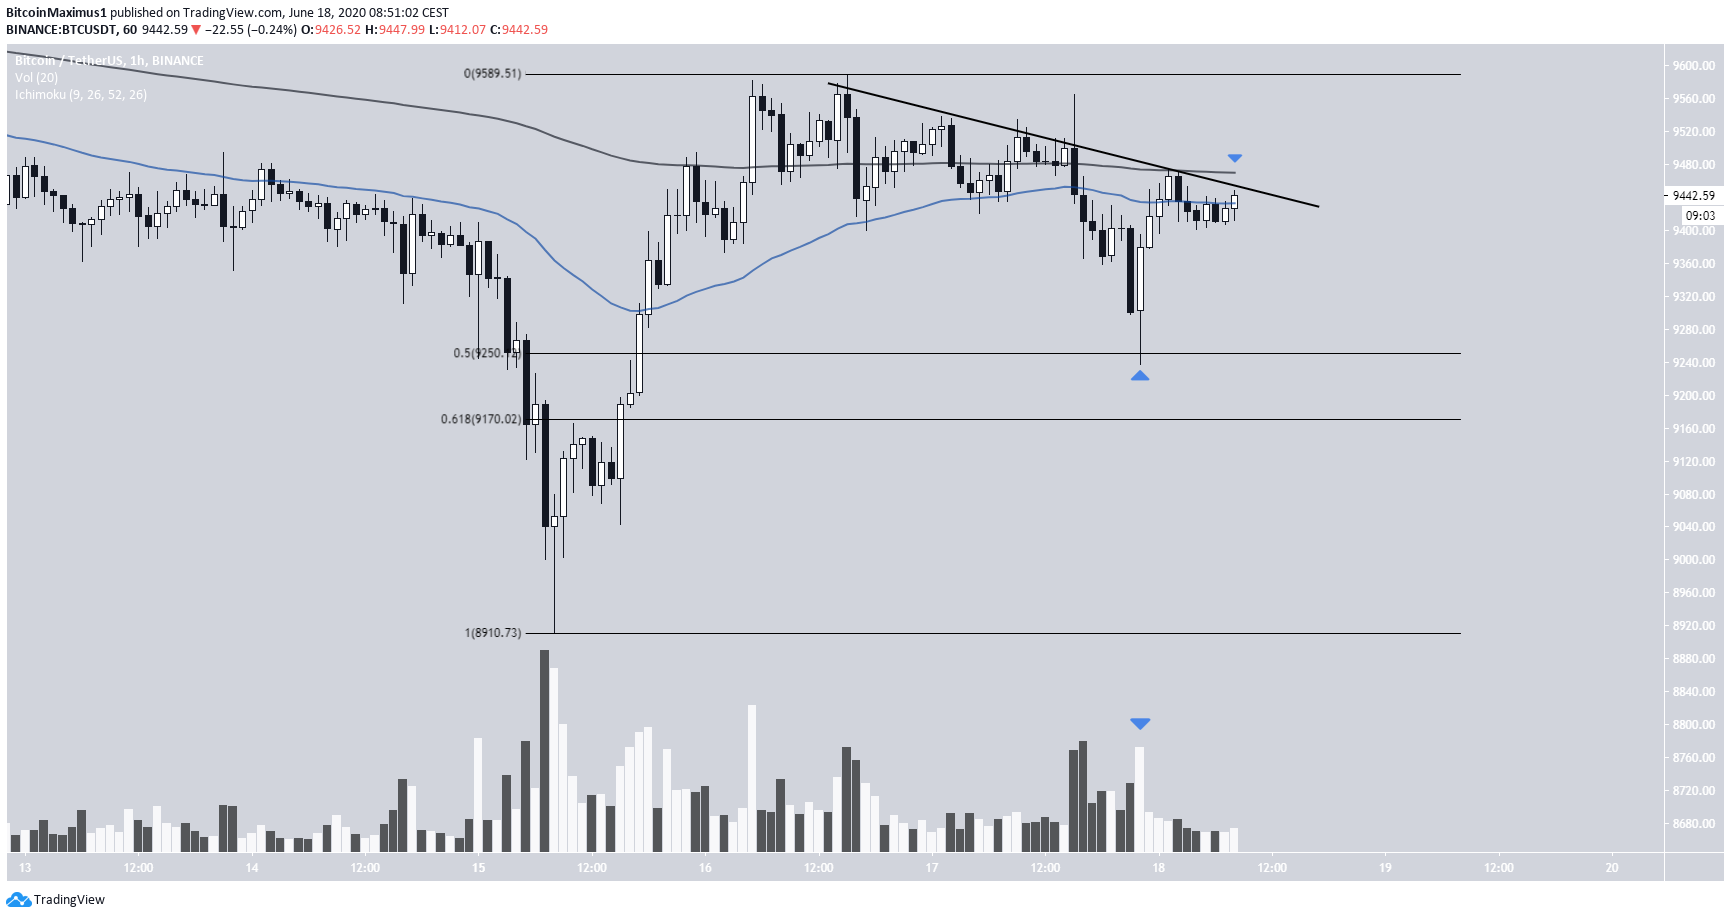
Since reaching a local high of $9,589 on June 16, the Bitcoin price has been decreasing, possibly following a descending resistance line. This was especially visible late on June 17, when the price made an attempt at breaking out, only to be rejected by the resistance line and created a long upper-wick.
The decrease continued until $9,236, when the price bounced on the 0.5 Fibonacci level, creating a thrusting candlestick pattern with above-average volume. This move took the price to this descending resistance line once more.
However, the price is facing resistance from both the 50 and 200-period moving averages (MA). A breakout above $9,460 would indicate a movement above both these MAs, and the descending resistance line, confirming that an upward trend has already begun.
Daily Outlook
The daily chart reveals that Bitcoin is most likely trading inside a descending wedge since June 1, currently being right below its resistance line. Therefore, a breakout above the short-term line outlined in the previous section could also make for a breakout from this longer-term pattern.
The daily chart also indicates that BTC is likely to break out. A trend reversal possibly occurred on June 15, when the price created a bullish hammer with very significant volume and bounced on the 50-day MA. In addition, the RSI has found support above the 50-line and looks primed to move upwards.
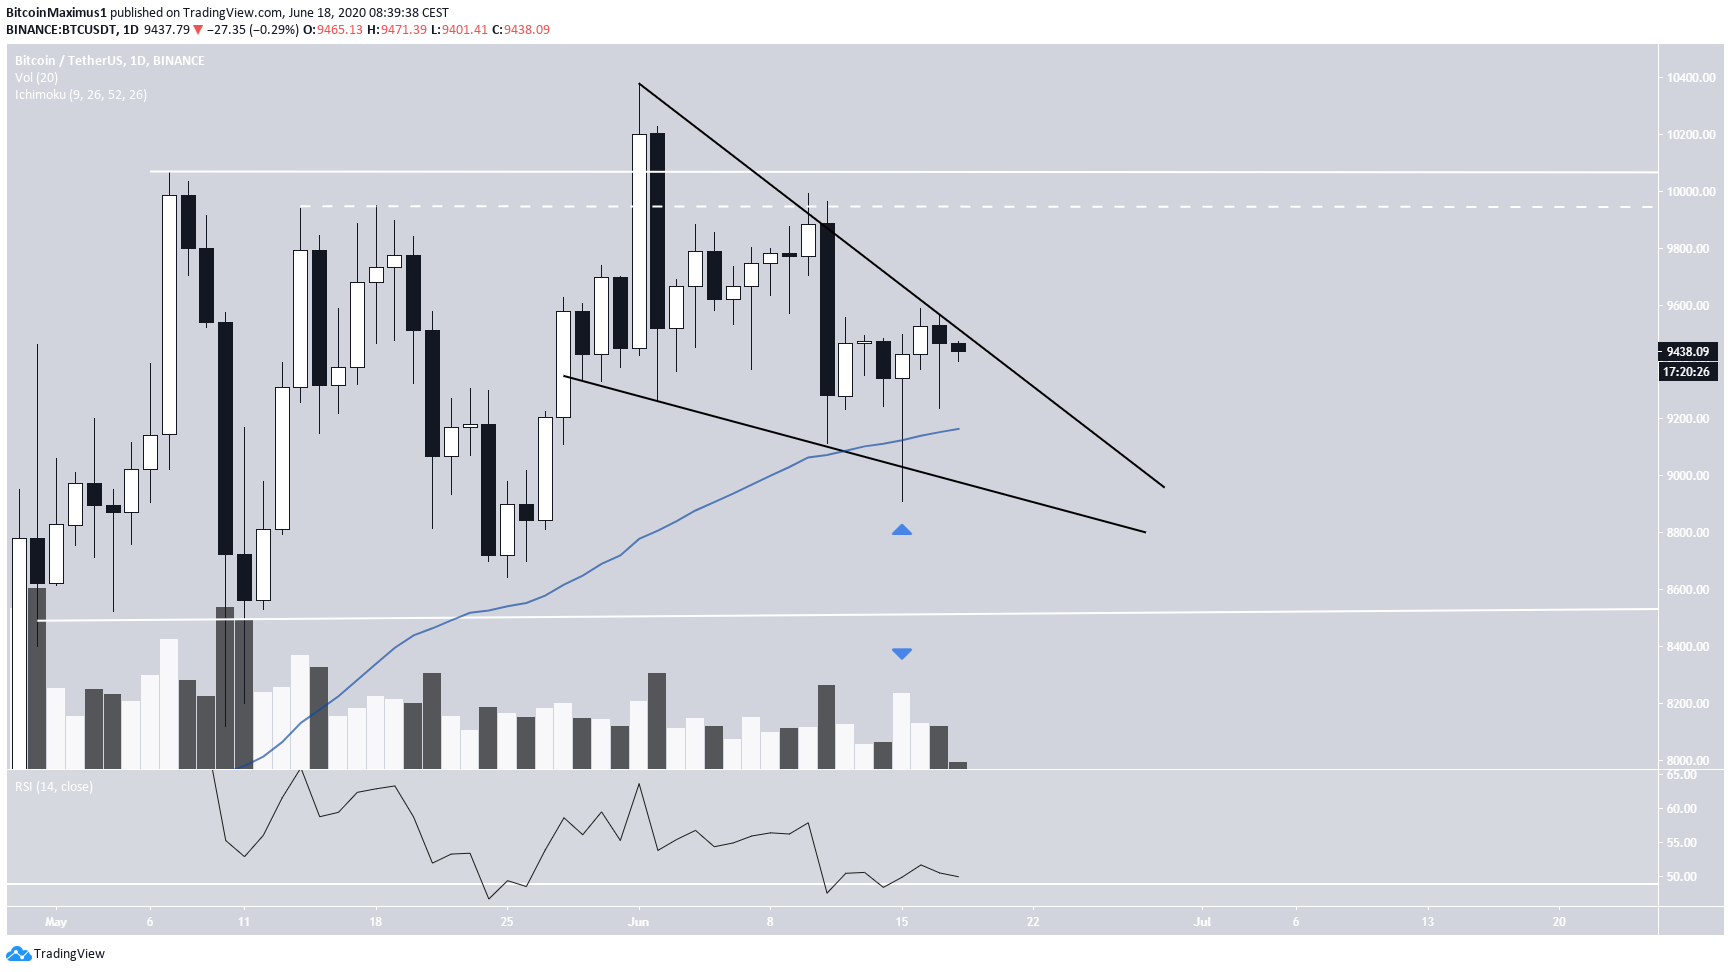
To conclude, the Bitcoin price is following a descending resistance line, out of which a breakout is expected. This could also cause a breakout from the long-term descending wedge to take the price back towards $10,000.
For our previous analysis, click here.


