
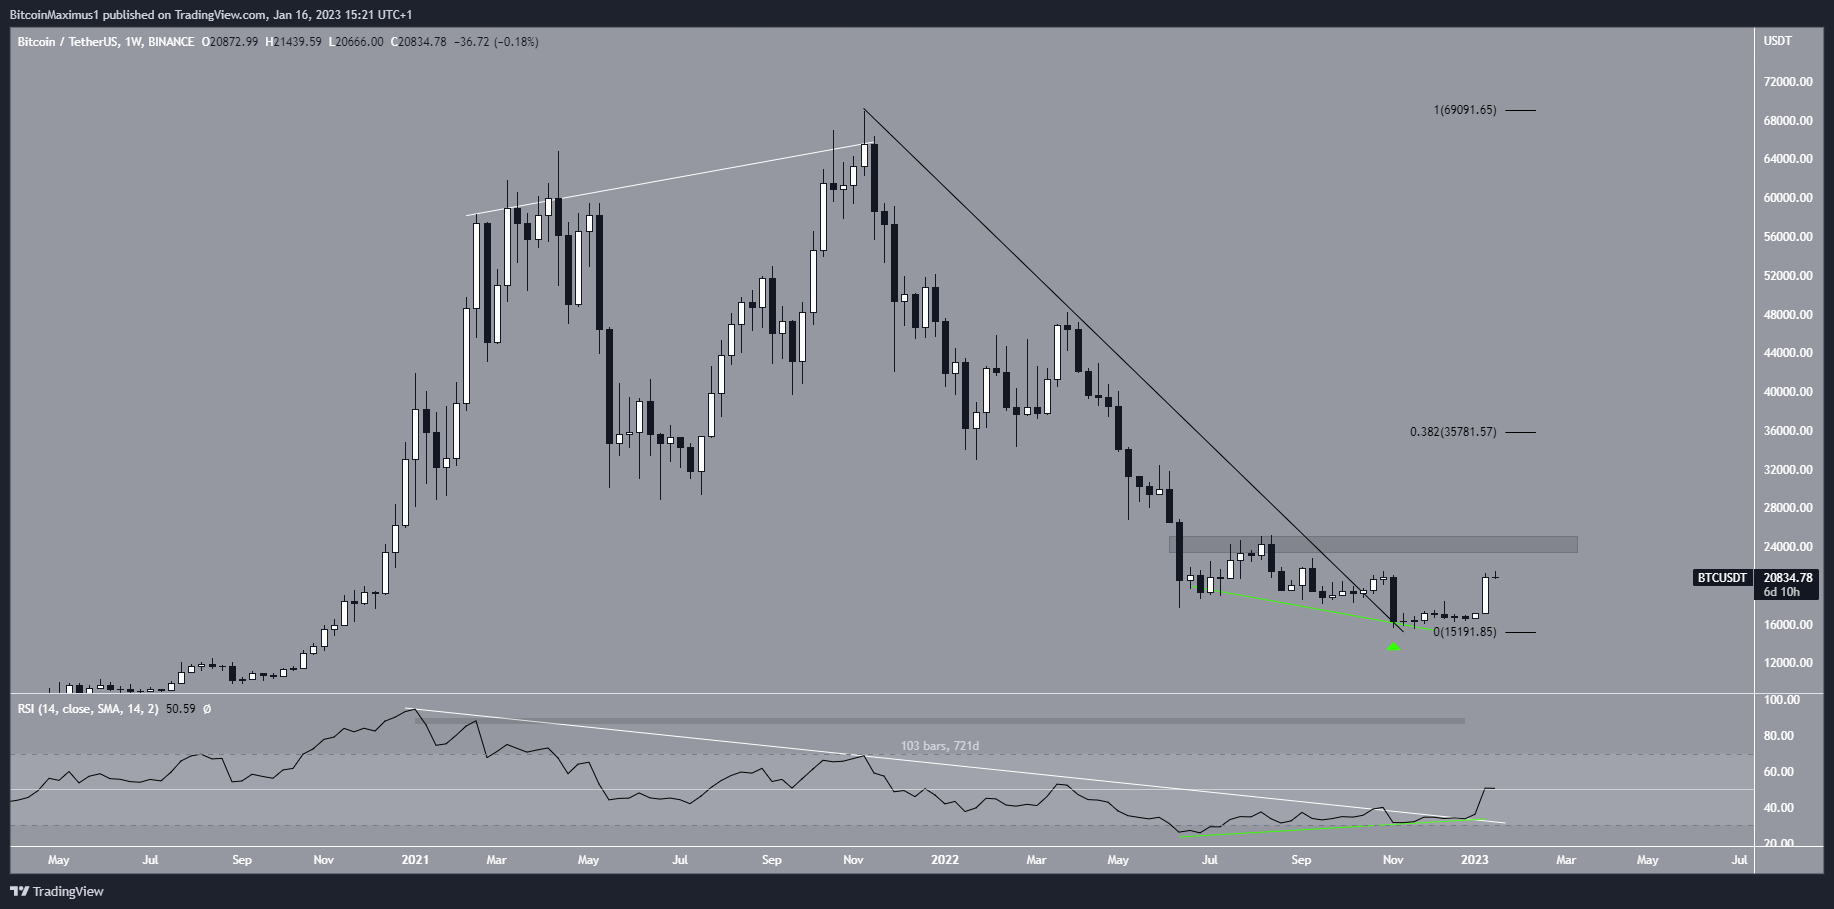
The Bitcoin (BTC) price broke out from a long-term descending resistance line, confirming two bullish RSI readings in the process.
The Bitcoin price had decreased under a descending resistance line since reaching an all-time high of $69,000 in Nov. 2021. BTC broke out from the line in Oct. 2021 and validated it as support (green icon) the following month. The BTC price has increased since. It created a massive bullish candlestick last week. If the increase continues, the closest horizontal resistance area is at $24,300, while the closest Fib resistance is at $35,780.
However, the price action is not the most interesting thing going on with Bitcoin right now. That title goes to the RSI.
The indicator had decreased under a descending resistance line since the beginning of 2021. The divergence from this line initiated the entire downward movement of the current bear market. Since the July 2022 low, the indicator began to generate bullish divergence (green line).
Last week, the bullish candlestick caused the RSI to break out from the bearish trend line after 721 days. The RSI has previously never had a trend line in place for such a long period. Moreover, the breakout confirmed the bullish divergence in the indicator.
As a result, the technical analysis from the weekly time frame is decisively bullish. A weekly close below $17,000 would be required for it to turn bearish.
Bitcoin Price Prediction For 2023: Relief Rally or New Bull Run?
Three potential Bitcoin wave counts are in play. All three indicate that an upward movement is expected in the short-term.
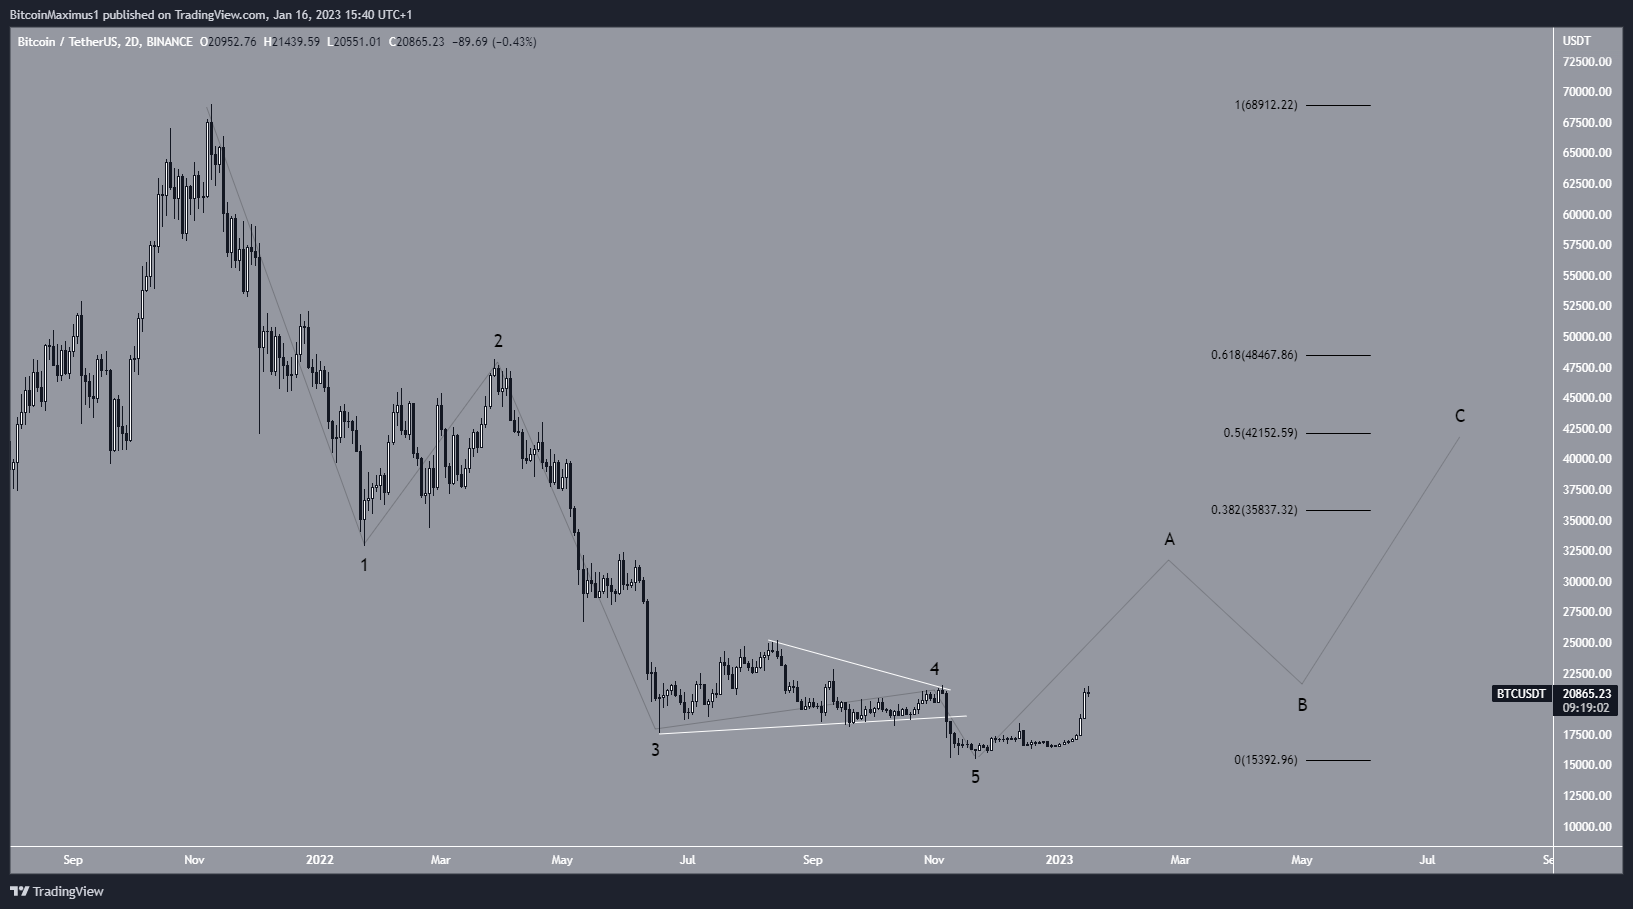
The most likely count is that the Bitcoin price completed a five-wave downward movement, which is the first part of a long-term correction.
So, the price has begun an upward A-B-C increase (black), which could end near the 0.5 Fib retracement level at an average price of $42,150. After this, another drop would be expected.
This is the most likely count because none of the waves are disproportionate to each other, and wave four took the shape of a triangle (white).
A decrease below the $15,558 low would invalidate this count, giving a bearish future price trend.
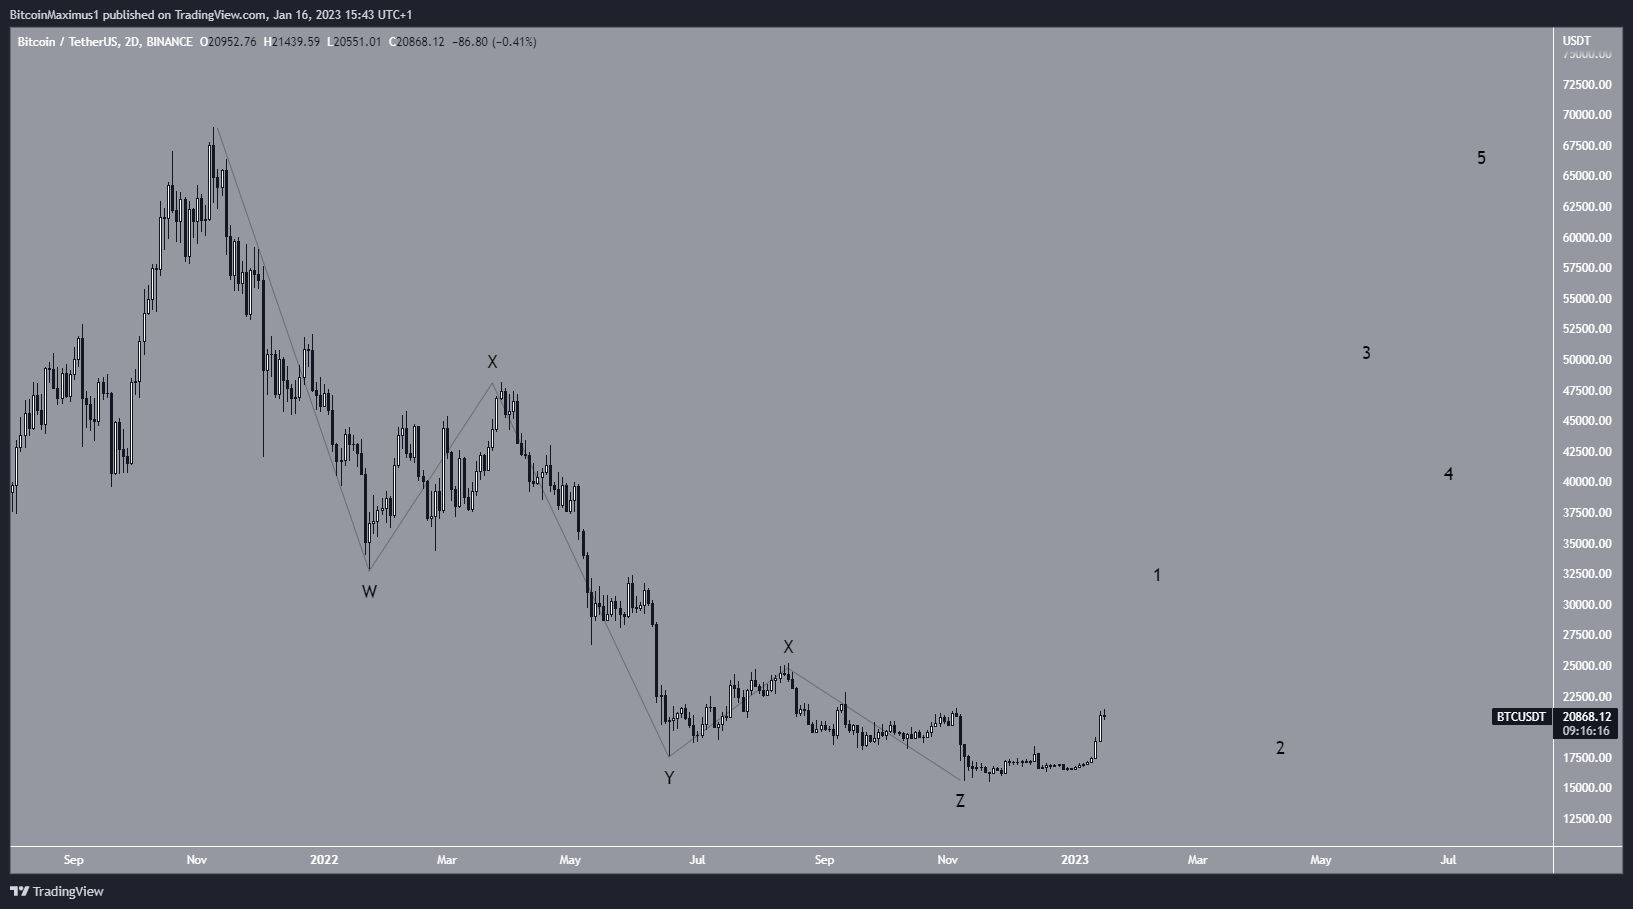
The second count indicates that the correction is complete. In it, the Bitcoin price completed a complex, W-X-Y-X-Z structure and has now begun a new upward movement that will eventually take it to a new all-time high. In this possibility, the Bitcoin price has already reached its bottom.
The only issue with this count is that wave Z is too small compared to W and Y, but this issue is not present in the logarithmic chart. The invalidation level for this count is also at $15,558.
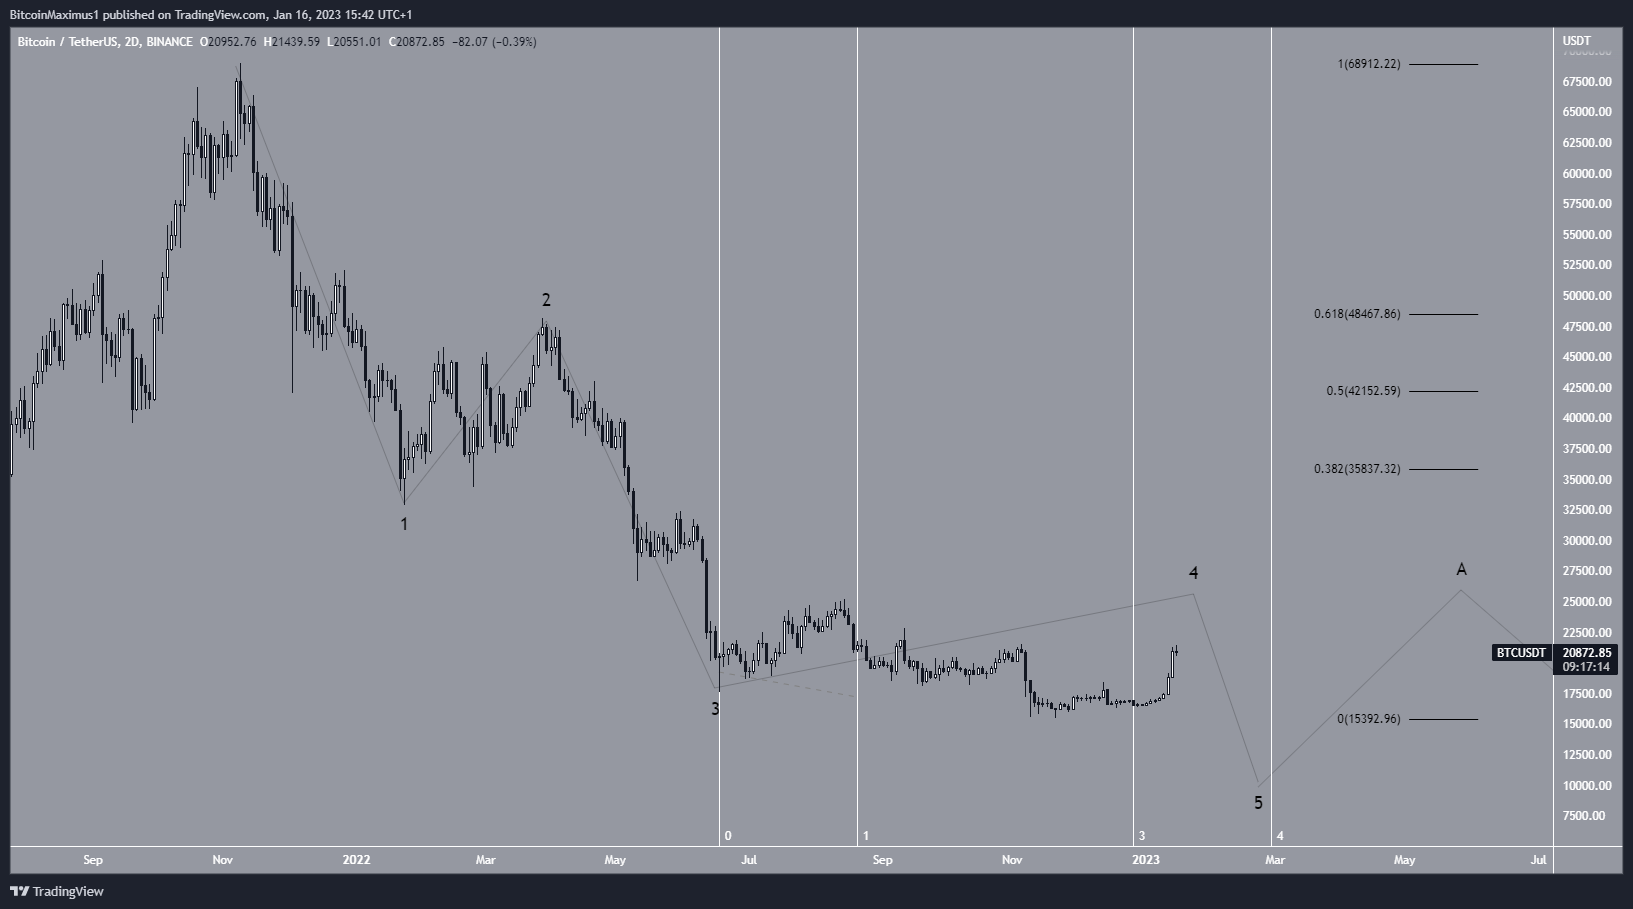
The final count suggests that the Bitcoin price is still in wave four. The most likely target for the top of wave four is just above the August 2022 highs near $25,000.
The issue with this count is the extreme length of wave four compared to wave two. Wave four has been more than three times longer than wave two (white), which is uncommon.
This is the only count which does not provide a bullish Bitcoin price prediction for 2023.
Conclusion: Bias is Leaning Bullish
To conclude, the Bitcoin price action is bullish due to the weekly RSI readings, more specifically the bullish divergence and break of a bearish trend line. While there are three counts still in play, they all suggest that the upward movement will continue, at least in the short-term. A drop below $15,558 would invalidate this bullish BTC price analysis.
For BeInCrypto’s latest crypto market analysis, click here.
