

The Bitcoin (BTC) price and the Ethereum (ETH) price have very similar price action, but ETH is moving upward at a faster rate. The XRP price saved a breakdown from a crucial support area by creating a bullish candlestick on Jan. 2.
Will BTC Break out Above Resistance?
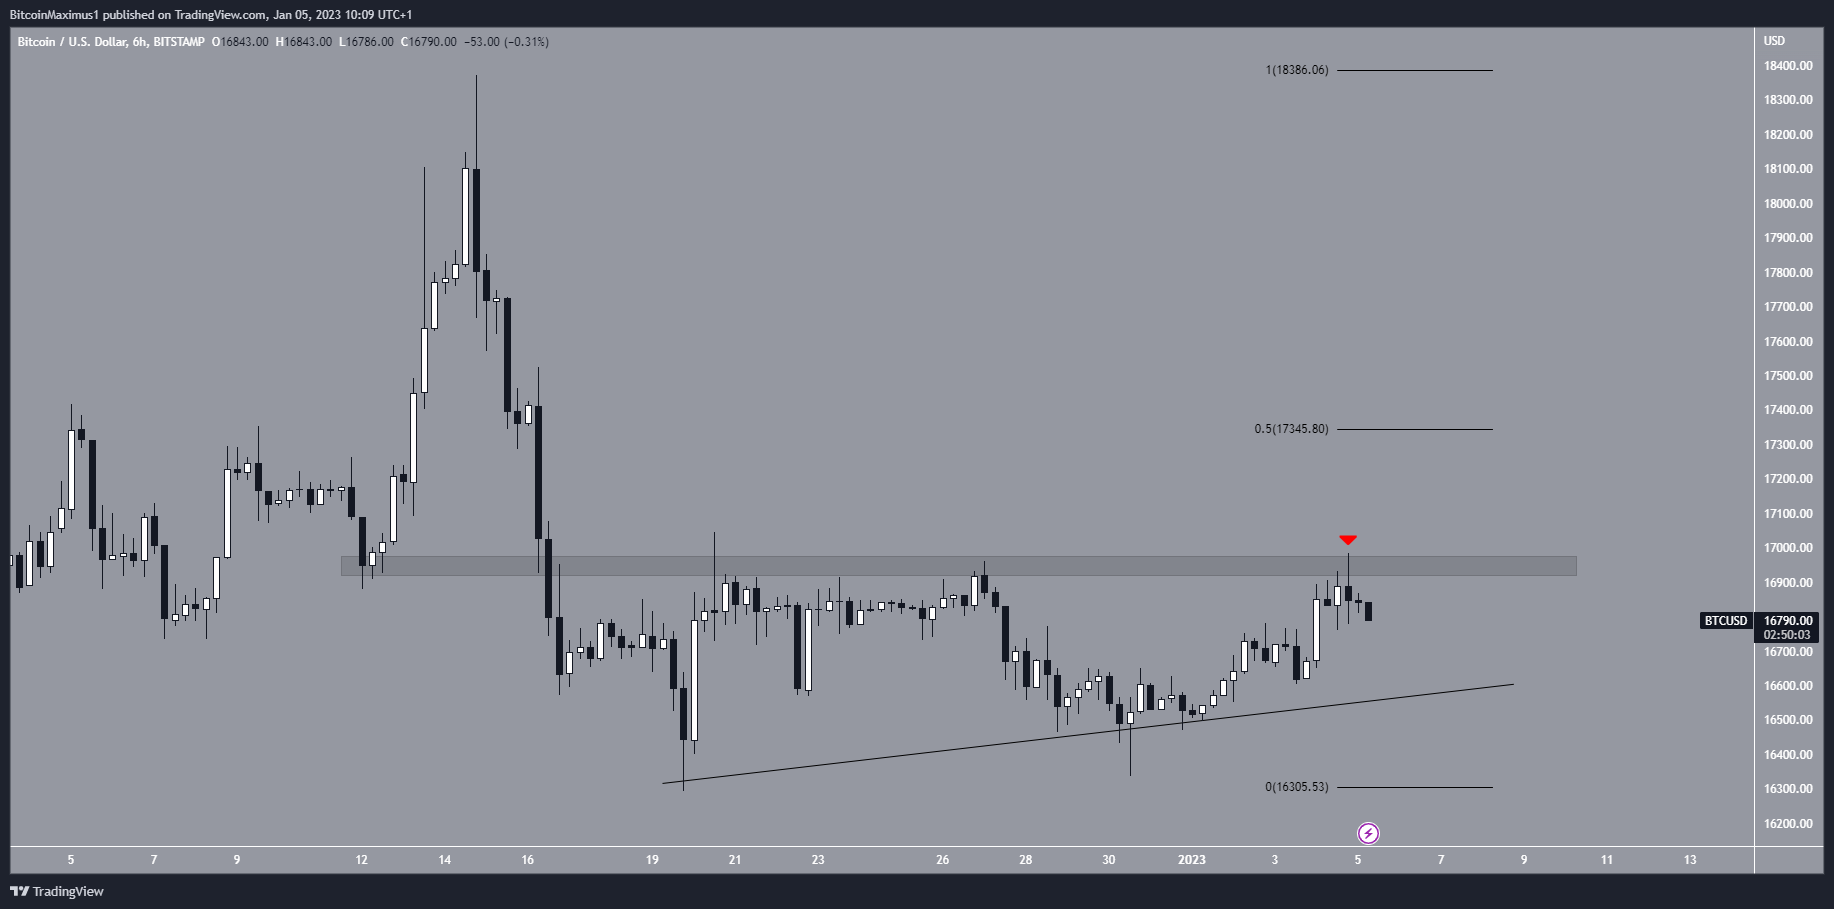
The BTC price has increased alongside an ascending support line since Dec. 19. Throughout this upward movement, it is facing resistance at $16,950. When combined with the support line, this resistance area creates an ascending triangle, considered a bullish pattern. More recently, the area rejected the BTC price on Jan. 4 (red icon).
If the BTC price successfully moves above this area, it could quickly jump to the 0.5 Fib retracement resistance at $17,345. On the other hand, a breakdown below the ascending support line could take the Bitcoin price back toward $16,000.
ETH Reaches Crucial Resistance
Similarly to BTC, the ETH price has increased since Dec. 16. However, the movement has been contained inside an ascending parallel channel, which is considered a bearish pattern. As a result, a breakdown from it would be the most likely scenario.
Moreover, the Ethereum price was rejected by the channel’s resistance line and the 0.618 Fib retracement resistance level on Jan. 4 (red icon). It decreased over the next 24 hours. As a result, a downward movement toward the channel’s support line could occur.
A breakout from the $1,275 resistance area would mean the trend is bullish. On the other hand, a breakdown from the channel could take the price back to $1,090.

XRP Price Saves 202-Day Support Line
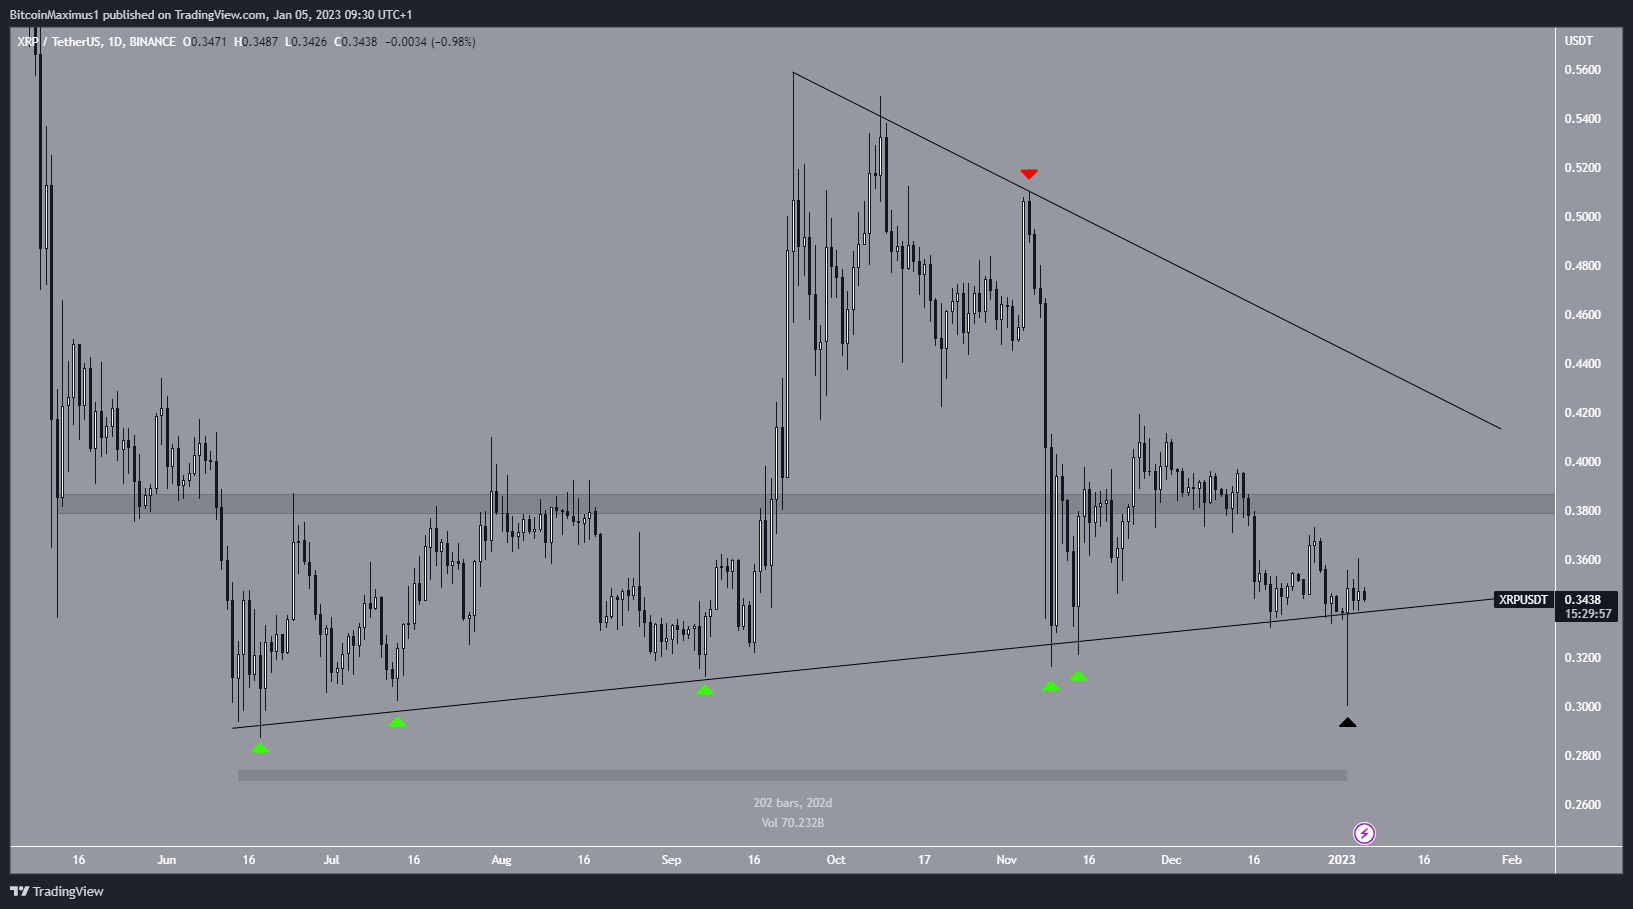
The XRP price has increased alongside an ascending support line since June 14. The line has been validated numerous times so far (green icons).
Since Sept. 23, the price has also followed a descending resistance line. When combined with the aforementioned support, this creates a symmetrical triangle, considered a neutral pattern. The line rejected the price on Nov. 5 (red icon) and initiated the current downward movement.
On Jan. 2, the XRP price seemed to break down from the support line after 202 days. However, it created a massively long lower wick (black icon) and reclaimed the line the same day. This is considered a bullish sign since bears did not have enough strength to sustain the breakdown.
If the bounce continues, the closest resistance area would be at $0.384.
In any case, the trend is still considered neutral as long as the XRP price breaks out or down from the current symmetrical triangle. A breakdown would mean that the trend is bearish while a breakout would mean that it is bullish instead.
To conclude, the trend direction for these three digital assets is still unclear. In the case of XRP, whether the price breaks out or down from the triangle will determine the future movement. In the case of the Bitcoin and Ethereum prices, there is no clear determinant for whether the long-term trend is bullish or bearish.
For BeInCrypto’s latest crypto market analysis, click here.
Disclaimer
In line with the Trust Project guidelines, this price analysis article is for informational purposes only and should not be considered financial or investment advice. BeInCrypto is committed to accurate, unbiased reporting, but market conditions are subject to change without notice. Always conduct your own research and consult with a professional before making any financial decisions. Please note that our Terms and Conditions, Privacy Policy, and Disclaimers have been updated.
