


On June 26, 2019, the Bitcoin price reached a high of $13,764. A decrease was followed by an upward move. On July 10, it reached a high of $13,161. Another decrease ensued. On July 17, BTC made a low of $9084. It has been increasing since.
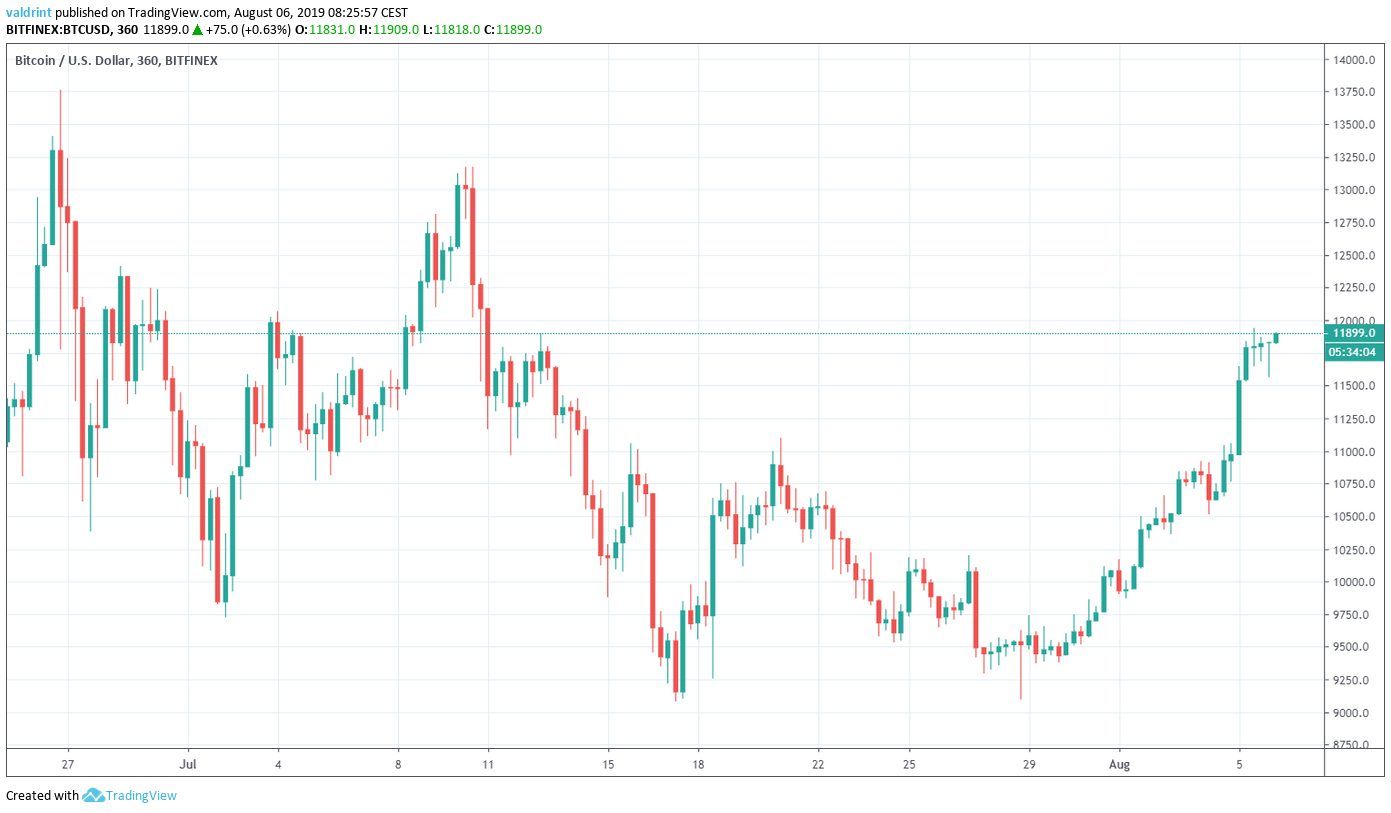
How much longer will BTC continue to increase? Continue reading if you want to find out.
For our previous analysis, click here.

Bitcoin Price: Trends and Highlights for August 6
- BTC/USD has likely finished an A-B-C correction.
- The correction had a wave count of 3-3-5.
- Daily moving averages have made a bullish cross.
- There is support at $11,000.
Regular Flat
We are going to examine several possibilities for the type of correction that BTC has finished or is still in the process of doing so.
We believe that the most likely scenario is that the Bitcoin price has already finished an A-B-C correction, with a 3-3-5 wave count. This is otherwise called a “Regular Flat Correction”.
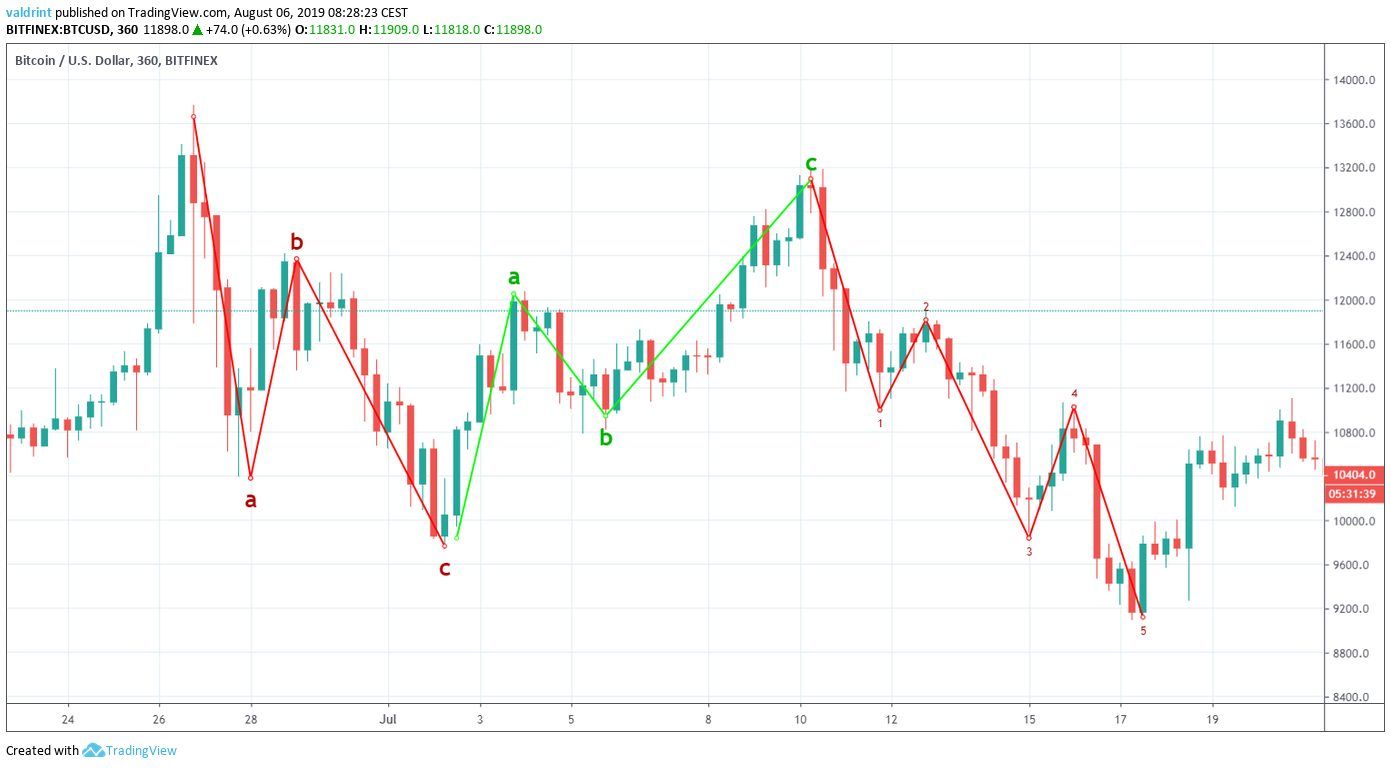
In this scenario, we have already made the low on July 17, and the price is likely to continue increasing.
It is worth noting that the previous price movement had several characteristics of a 3-3-5 correction.
Most notably:
- The A and C waves are identical in length.
- The B wave ended slightly below the beginning of the A wave
- The C wave ended slightly below the ending of the A wave.
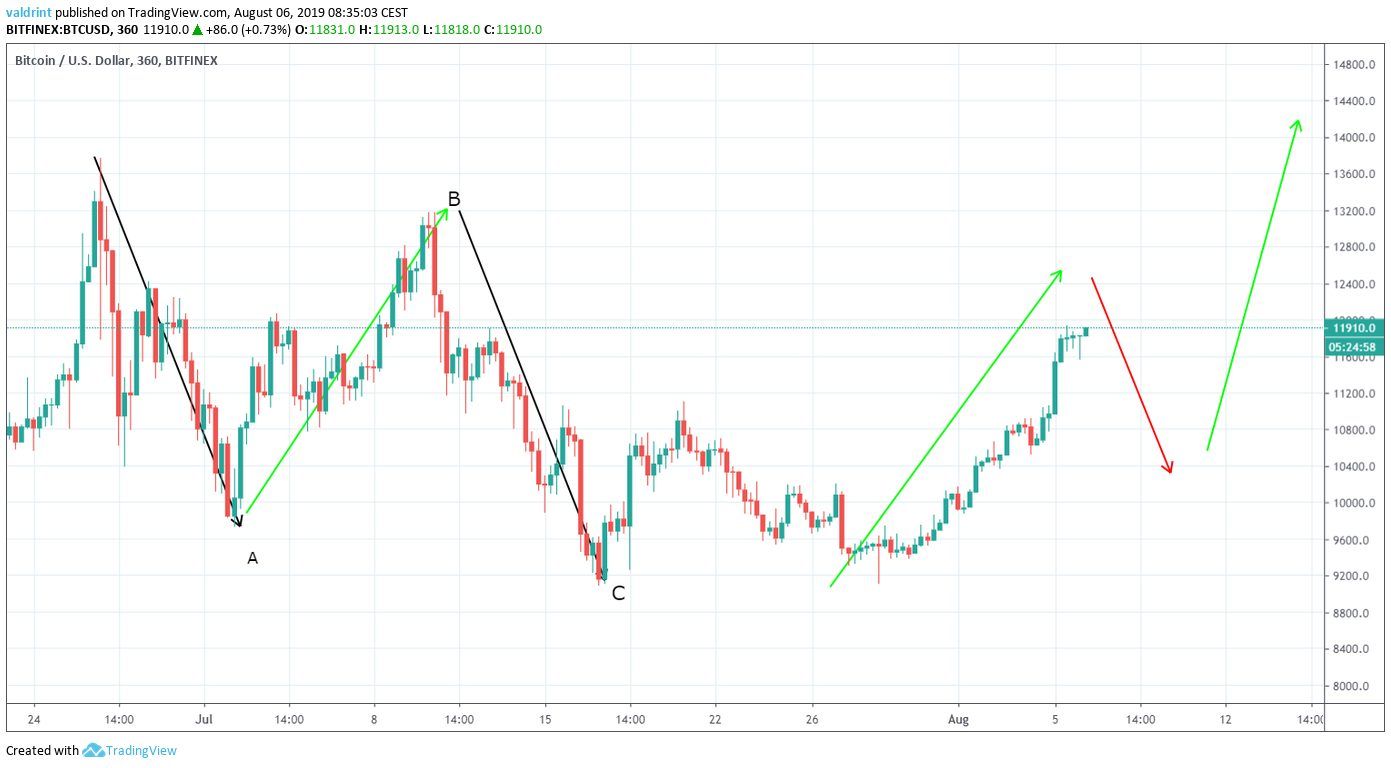
In this scenario, BTC will continue to increase, before retracing slightly and resuming its upward movement.
This scenario is supported by the daily moving averages (MA) and the MACD:
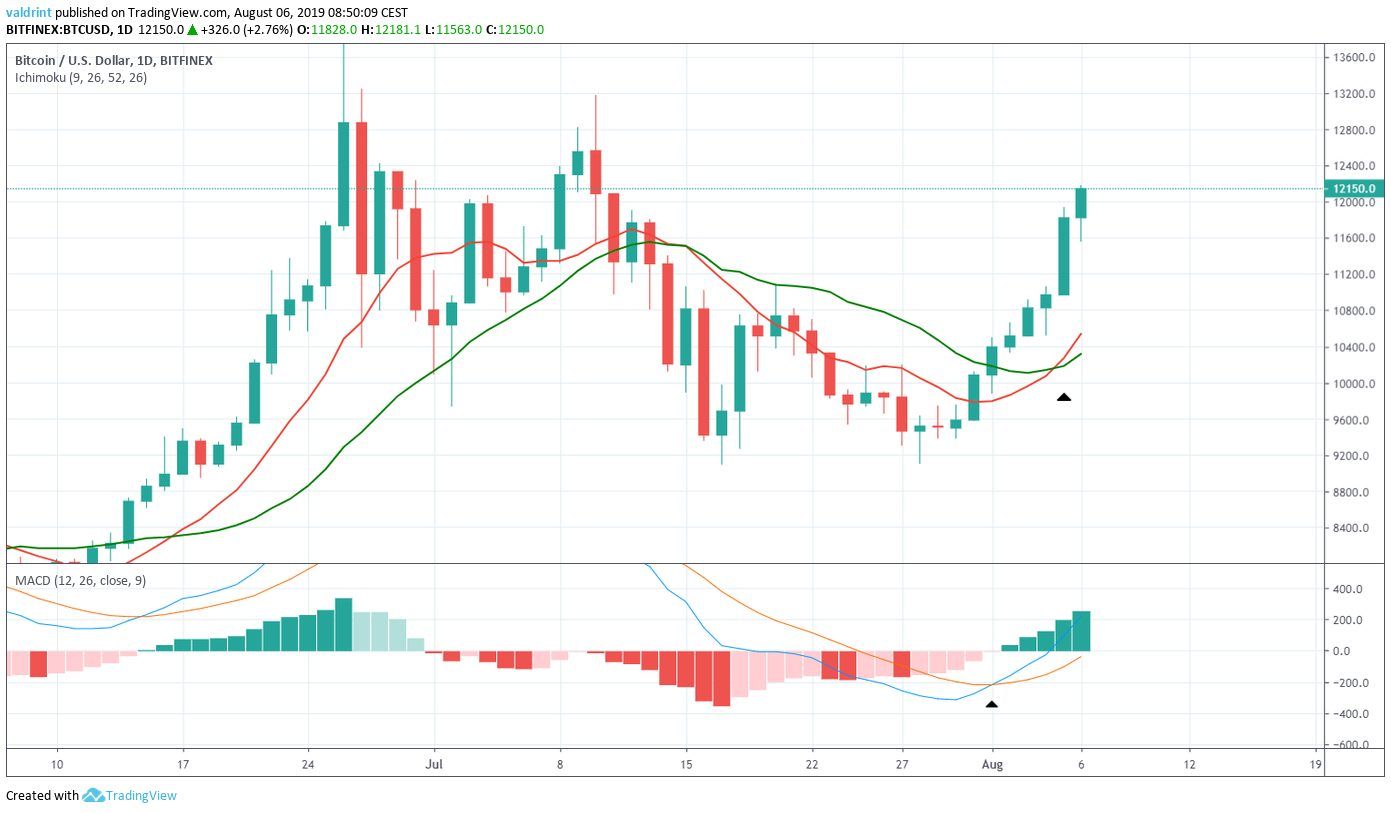
The MACD made a bullish cross on August 1.
The 10- and 20-day MAs followed suit on August 4.
On the same day, the MACD crossed into positive territory.
The combination of these technical indicators suggests that an uptrend has begun.
Trade Bitcoin, Ethereum, Litecoin, and more on our partner exchange, KuCoin. Sign up for a free account today.
Double Three
Our second scenario begins the same way.
The Bitcoin price has finished an A-B-C correction with a 3-3-5 wave count. However, this is only the W wave in a broader W-X-Y correction.
At the time of writing, we are in the X wave.
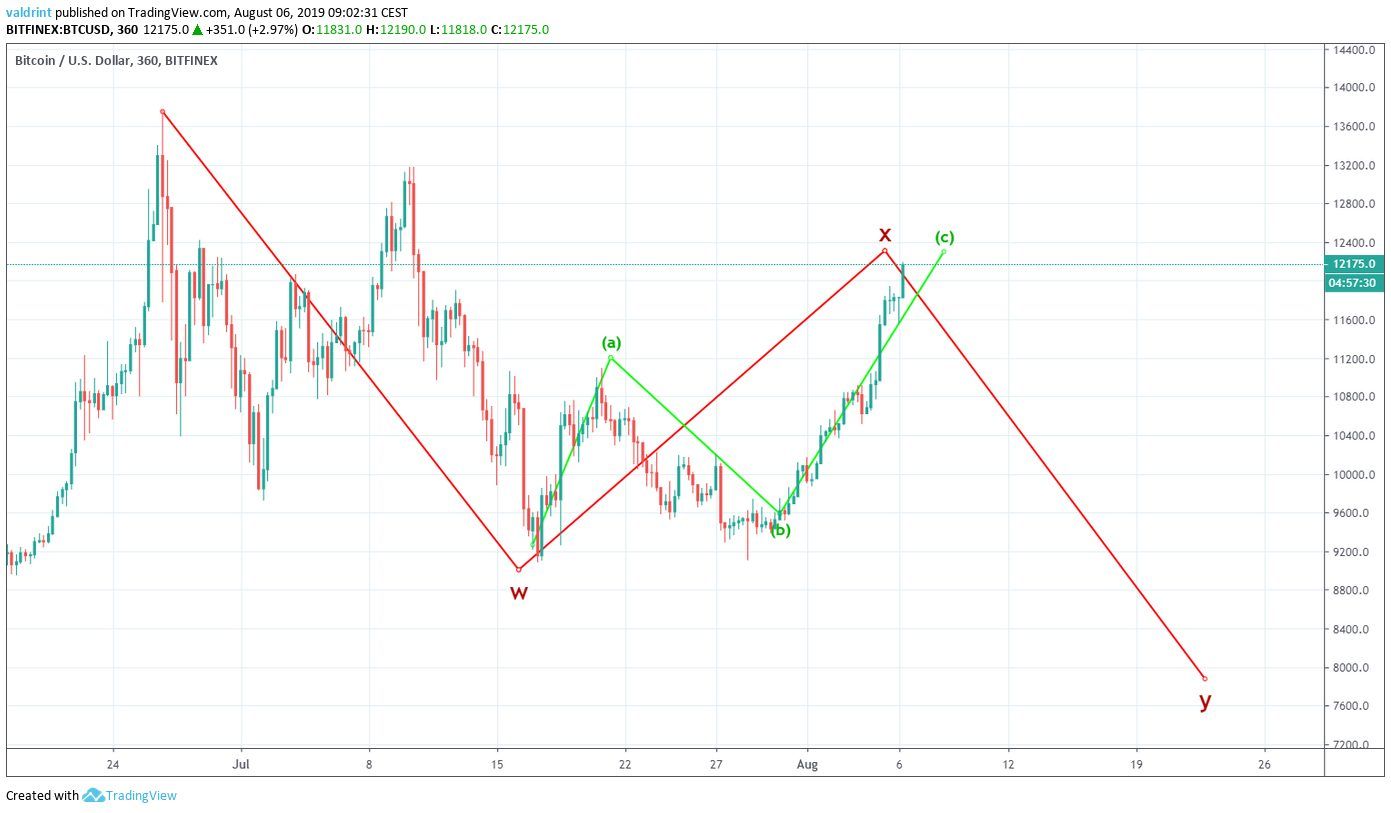
The X wave can take any corrective form.
However, a closer look shows that we are likely approaching its end.
Since reaching a low on July 29, BTC is likely in the process of finishing a five-wave upward move.
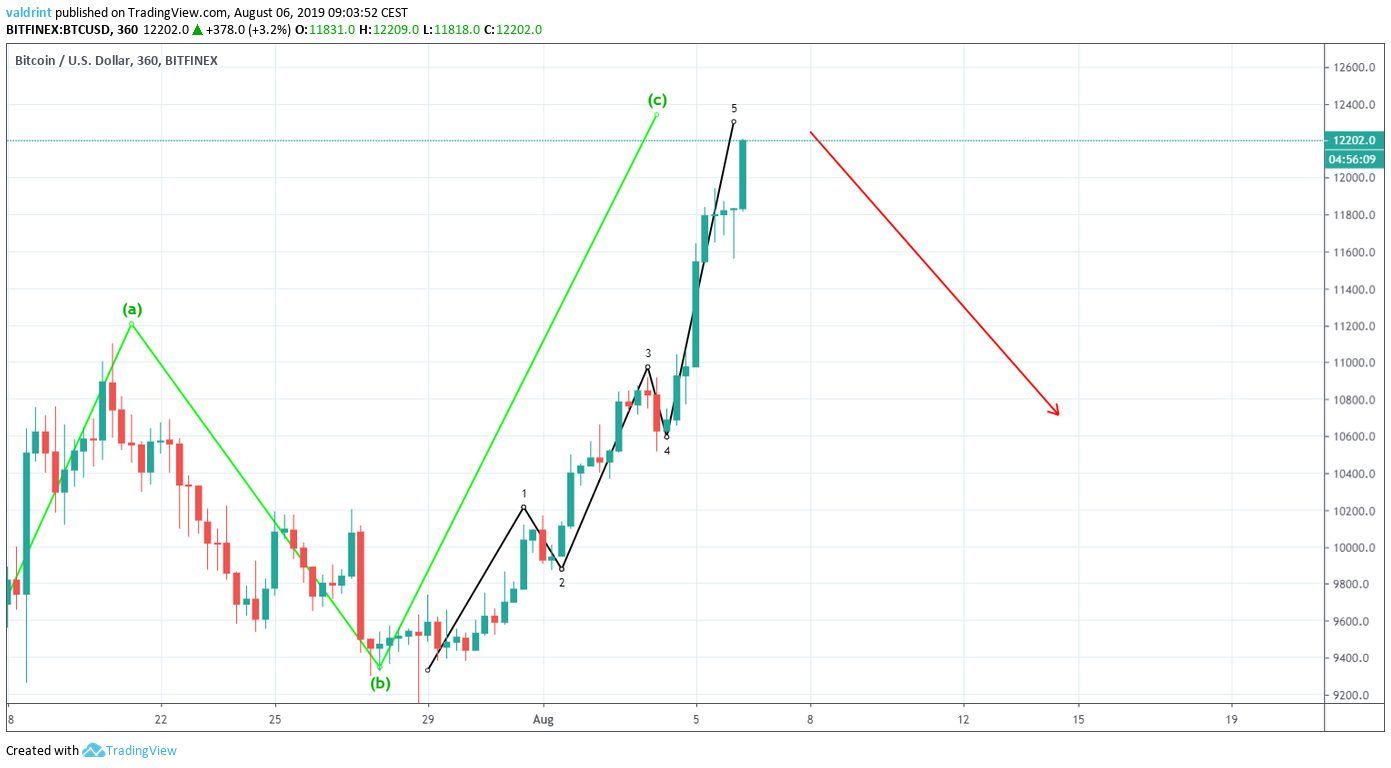
Additionally, it has several characteristics of this type of movement; namely :
- The third wave is not the shortest,
- The low of wave 4 did not breach the top of wave 1.
- The fifth wave is the most rapid.
After this move is finished, we would expect a correction that would end below the low of $9084 reached on July 29.
A target for the top of the fifth wave is given using a fibonacci retracement tool on the fourth wave.
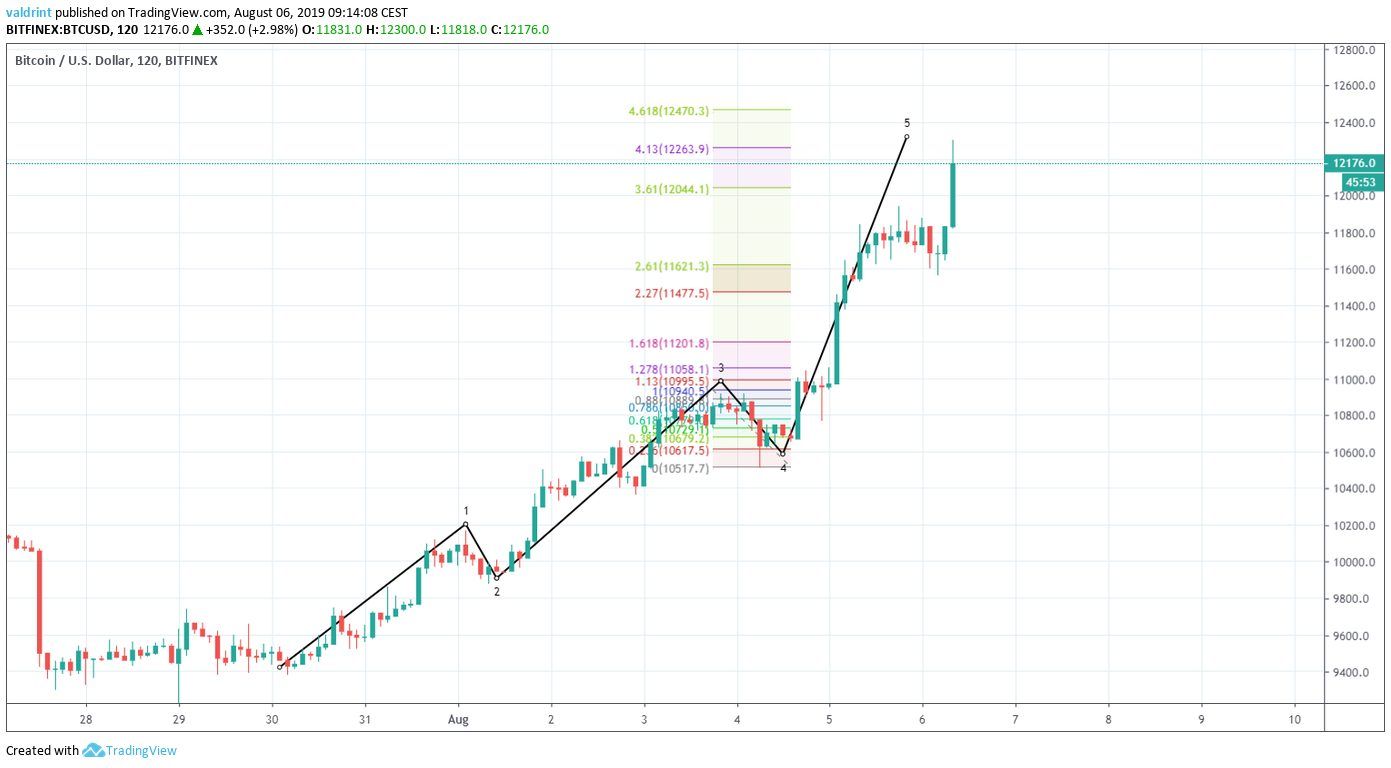
The most likely target is between $12,300 and $12,500, very close to where the price is trading now.
This scenario is supported by the long-term Bitcoin price movement.
Below, we can see that the upward move began on December 2018. It lasted for 189 days.
If we reached a bottom on July 29, this is only a 21-day correction. A correction in such a short time-frame seems unlikely considering the length of the increase.
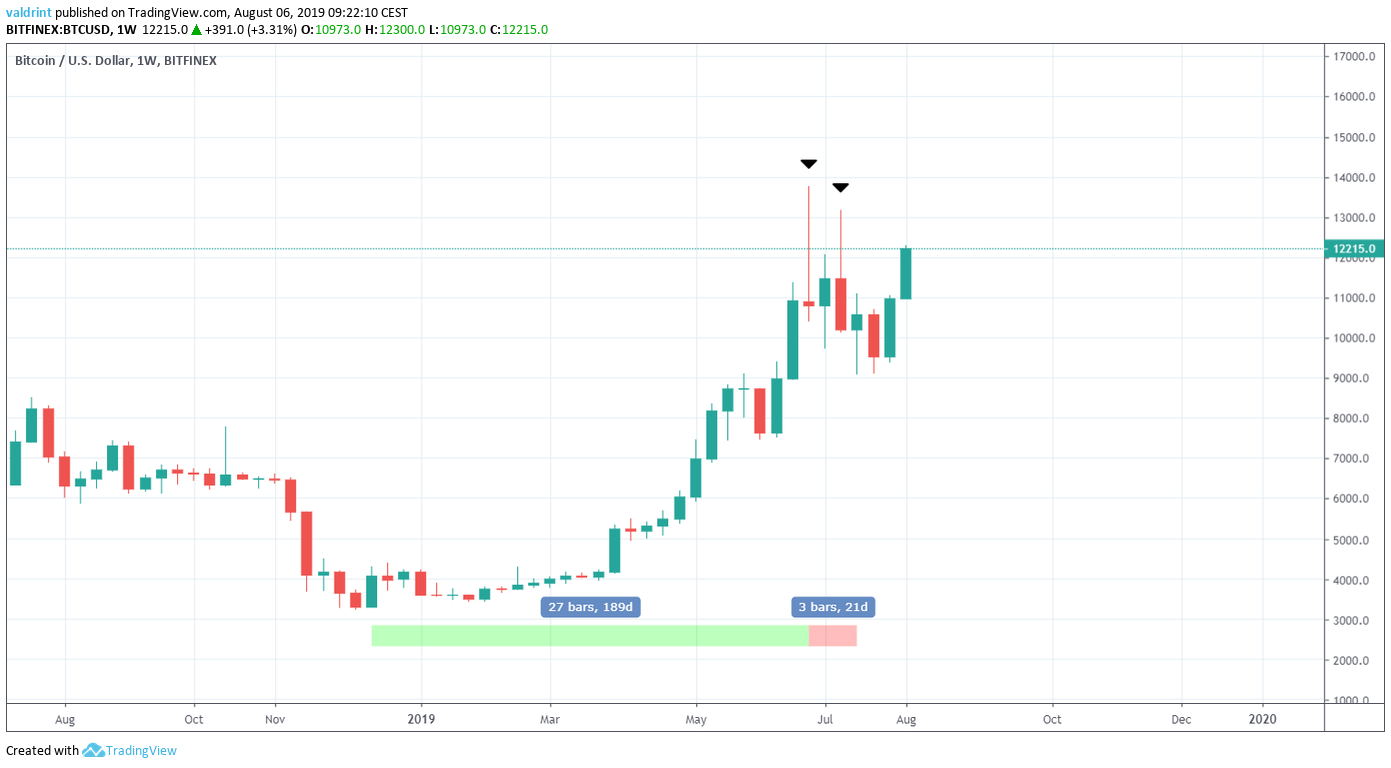
Additionally, the long upper wicks of the weekly candlesticks that reached values above $13,000 suggest a reversal.
At the time of writing, the Bitcoin price was increasing through the resistance.
If the current weekly candle is bearish (close below $11,000) this would almost confirm our second scenario in which BTC is not done decreasing.
Bitcoin Price Summary
We are still not certain about the type of correction and long-term future movement of BTC.
However, in both our scenarios, BTC will soon undergo a short-term decrease.
Whether this will be followed by further decreases or an increase that leads to a new 2019 high is left to be seen.
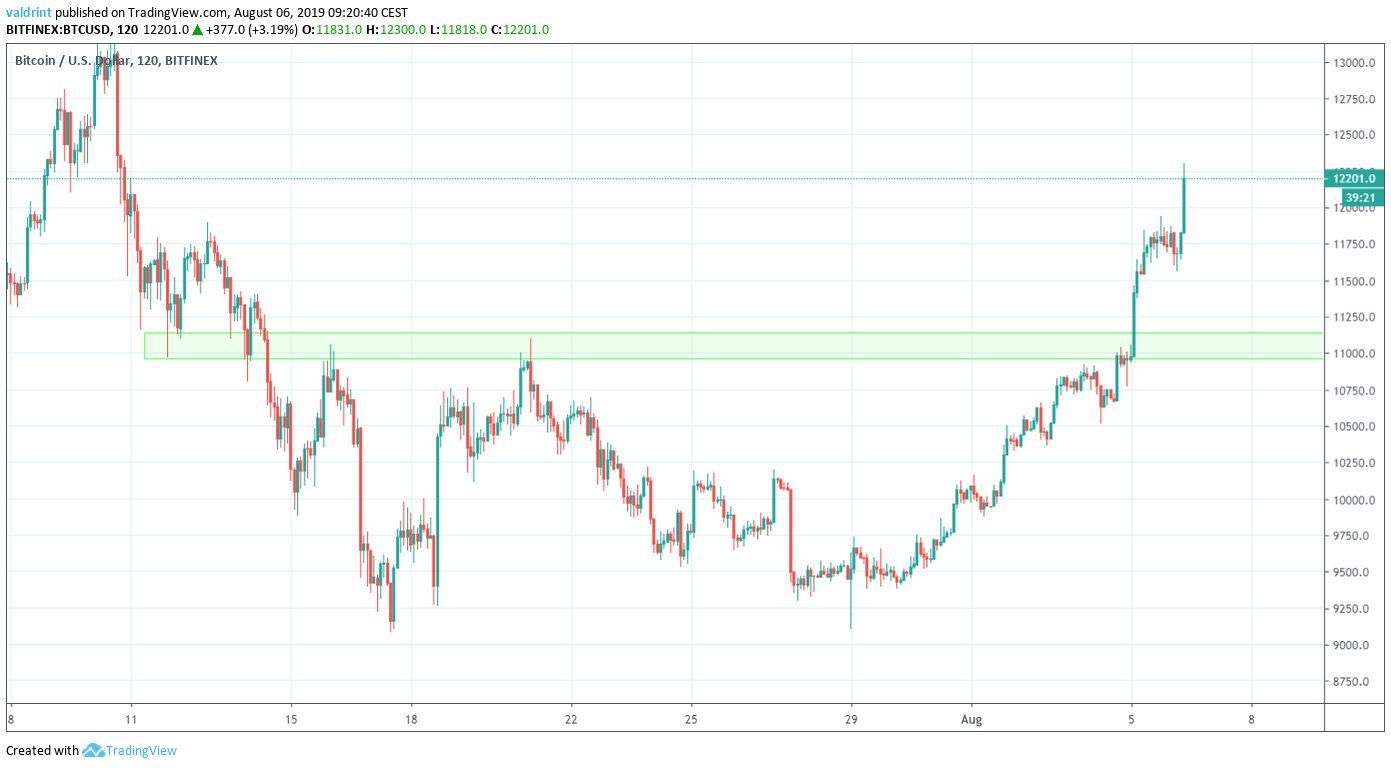
If a decrease occurs, the closest support area is near $11,000 and shown below.
Do you think BTC has finished its correction? Let us know in the comments below.
Disclaimer: This article is not trading advice and should not be construed as such. Always consult a trained financial professional before investing in cryptocurrencies, as the market is particularly volatile.
Images are courtesy of TradingView and Shutterstock.
Check out our partner exchange, StormGain, to trade Bitcoin and other cryptocurrencies with up to 100x leverage.


