


On September 6, the Bitcoin price reached a high of $10,933, A rapid decrease ensued, and the price reached a low of $10,208 during the same day. After a gradual retracement to $10,600 on September 8, BTC continued its decrease, albeit at a much slower rate.
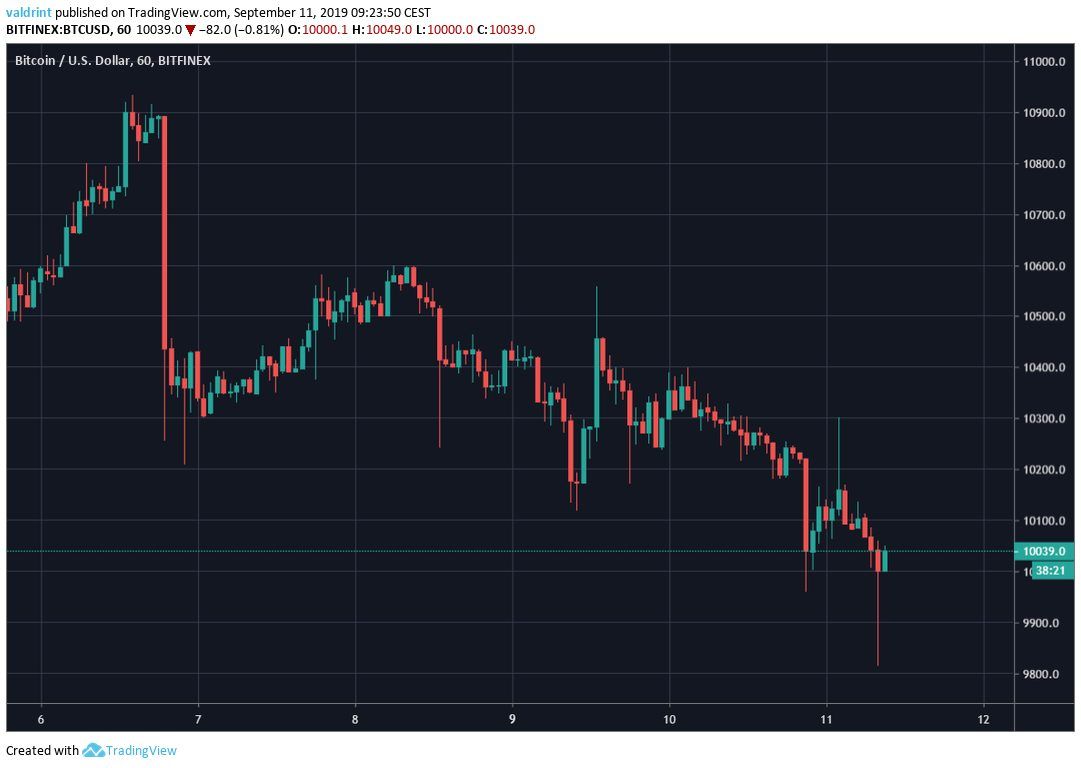
At the time of writing, BTC was trading at $10,000.
Will it continue to decrease or will it find support above $10,000? Continue reading below if you are interested in finding out.
For our previous analysis, click here.
Bitcoin Price: Trends and Highlights for September 11
- BTC/USD is trading inside a descending wedge.
- There is support at $10,000 and $9800.
- Bullish divergence is visible in the one-hour RSI.
- The price has created a short-term morning star reversal pattern.
- There is resistance at $10,450.
Current Pattern
A look at the hourly time-frame shows that BTC has been trading inside a descending wedge since September 6.
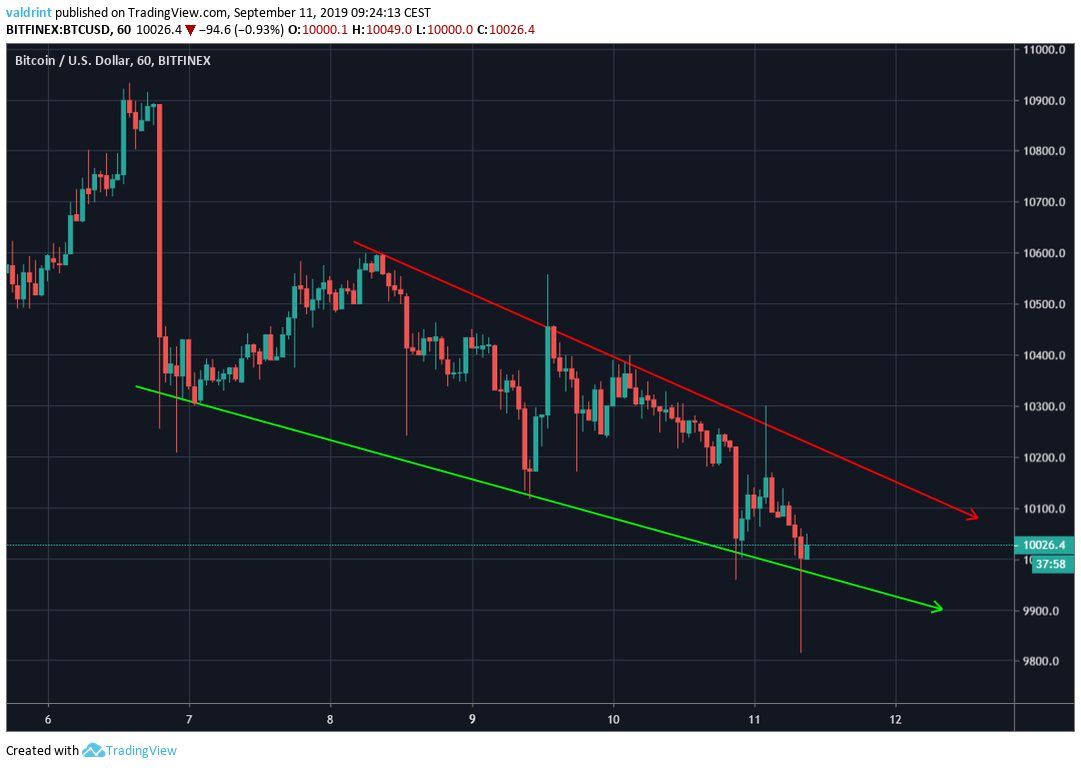
At the time of writing, it was trading very close to the support line of the wedge.
The descending wedge is considered a bullish pattern, making a price breakout more likely.
Bitcoin Price Support and Reversal
Taking a slightly longer-term view, we can see two support areas, which are found at:
- $10,000
- $9800
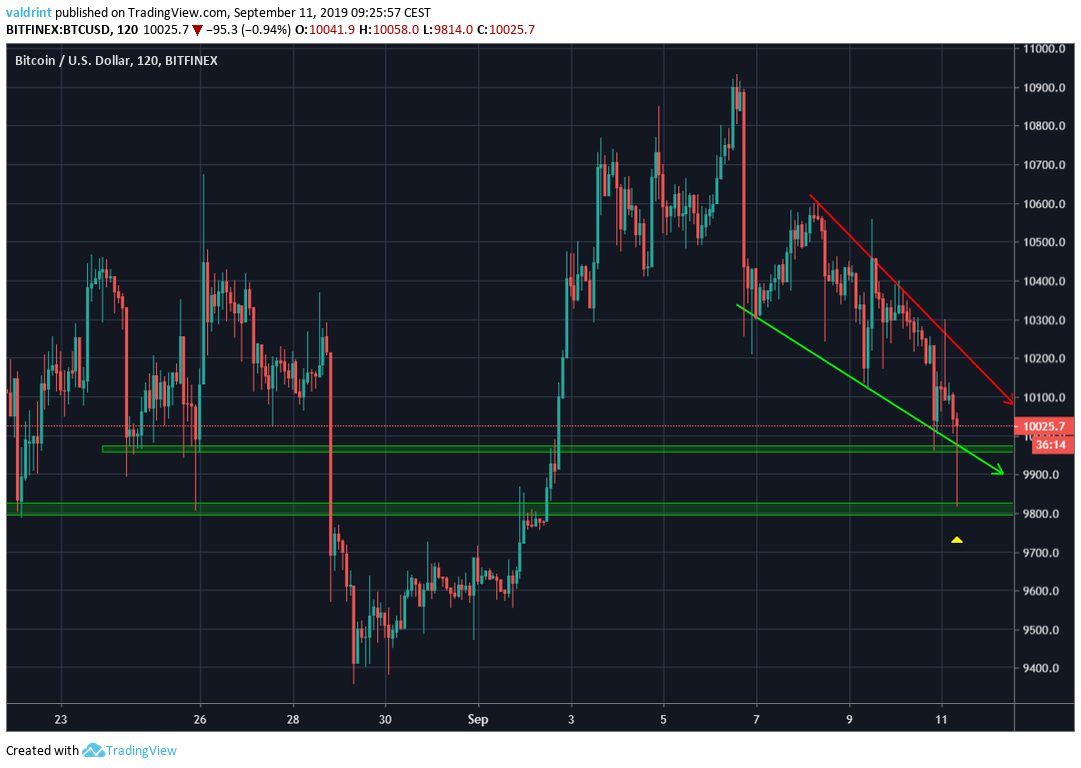
The $9800 support area has gained more significance due to the fact that once the price reached the area it created a long lower wick and immediately moved back upward.
Additionally, while the support area of $10,000 has been broken, the price has not reached a close below it.
Looking at the 15-minute chart, we can see that the movement during the long lower wick is very similar to a morning star, which is considered a bullish reversal pattern.
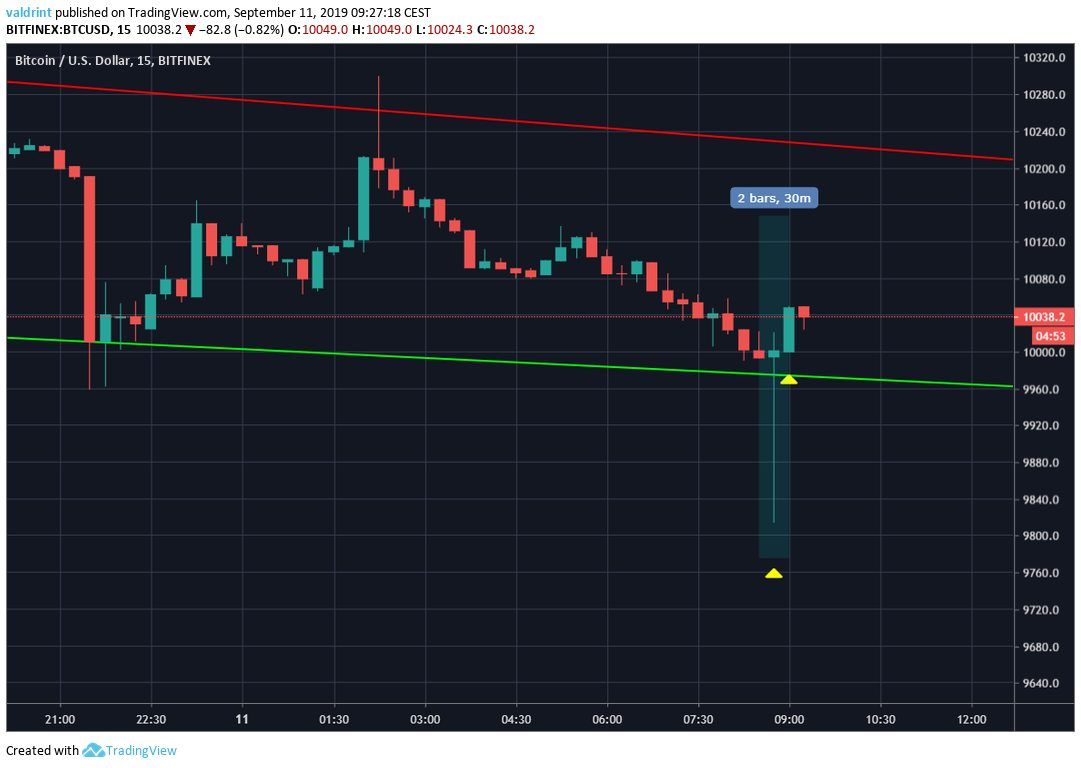
It was followed by a bullish engulfing candle, indicating that the price might soon begin an upward move.
Bullish Divergence
In order to better analyze the possibility of a reversal, we have incorporated the RSI into the analysis.
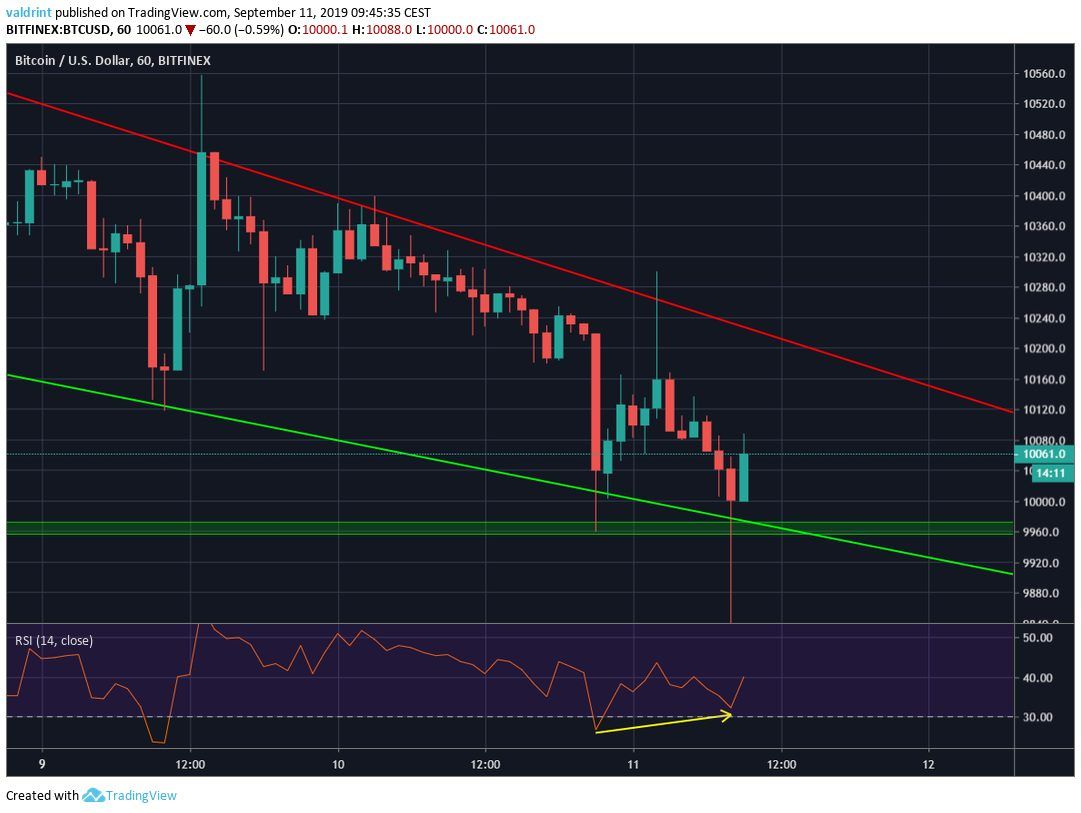
A bullish divergence has been developing during the most recent lower lows of September 10 and 11.
The fact that it is occurring in the support line of a bullish pattern increases its significance.
Combined with the rest of our analysis, it makes it likely that a breakout will occur.
If it does, where will the price go?
Future Movement
One resistance area is outlined below:
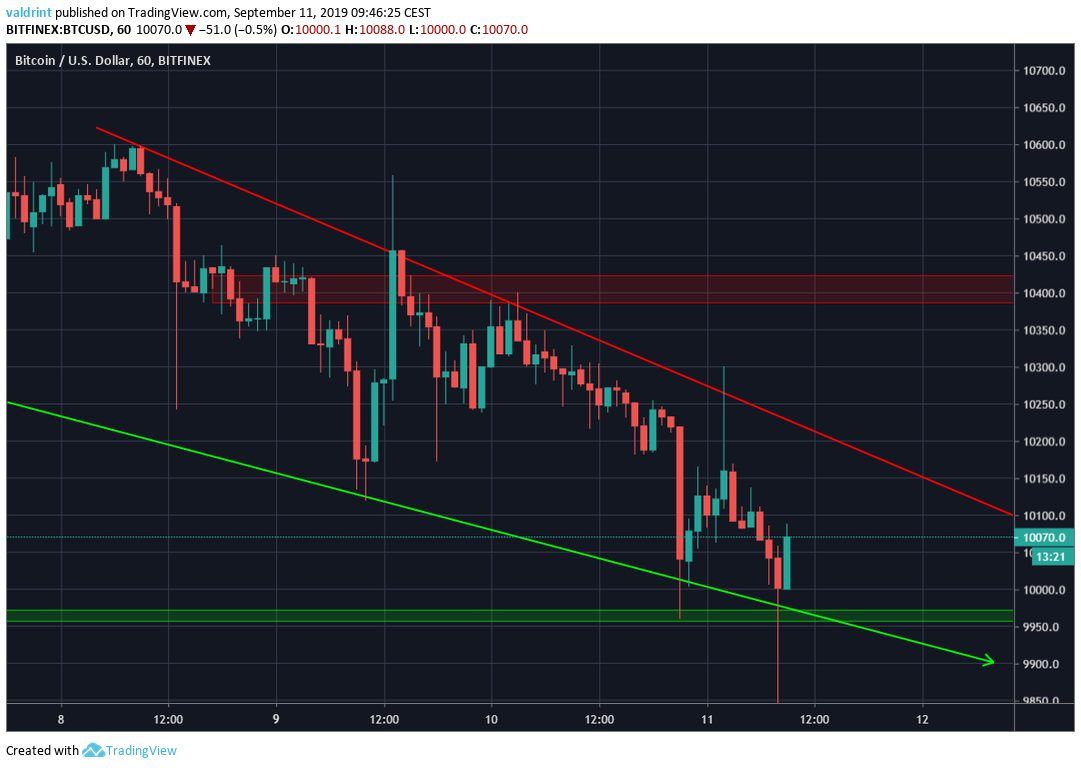
It is found at $10,400.
We believe it is likely that the price will reach it.
Bitcoin Price Summary
The Bitcoin price has been trading inside a descending wedge.
According to our analysis, BTC is likely to reach it.
For trading purposes, we consider BTC a buy only for short-term time-frames.
For the medium to long term, we still believe the price will reach values close to $9400.
Do you think the Bitcoin price will break out from the wedge? Let us know in the comments below.

Disclaimer: This article is not trading advice and should not be construed as such. Always consult a trained financial professional before investing in cryptocurrencies, as the market is particularly volatile.
Images are courtesy of Shutterstock, TradingView.


