


On July 21, 2019, the Bitcoin (BTC) price reached a high of $11,098 before a rapid decrease ensued. Since then, the price has been in a gradual downtrend, generating several lower lows. On July 24, it reached a low of $9354 and an upward move began the same day.

Is this move the beginning of a reversal, or will BTC continue its prior downtrend? Keep reading below in order to find out.
For our previous analysis, click here.
If you are interested in trading Bitcoin (BTC) with a multiplier of up to 100x on our new partner exchange with the lowest fees, follow this link to get a free StormGain account!
Bitcoin Price: Trends and Highlights for July 25
- BTC/USD broke out from a descending channel.
- There is resistance near $10,300.
- Daily moving averages are bearish.
- There is support at $9200.
Previous Movement
Since reaching the aforementioned high on July 21, BTC has been decreasing and trading inside the descending channel outlined below:
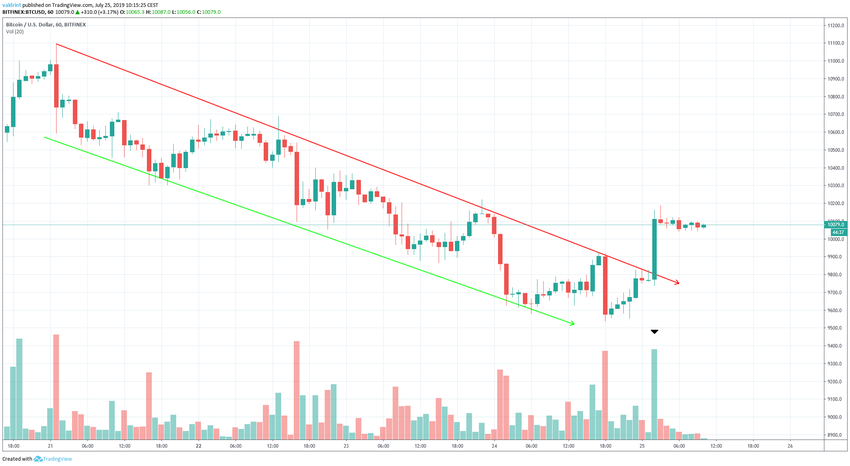
On July 25, the price broke out from this channel.
The breakout transpired with above-average volume.
In the short-term, we have outlined two possible price movements:
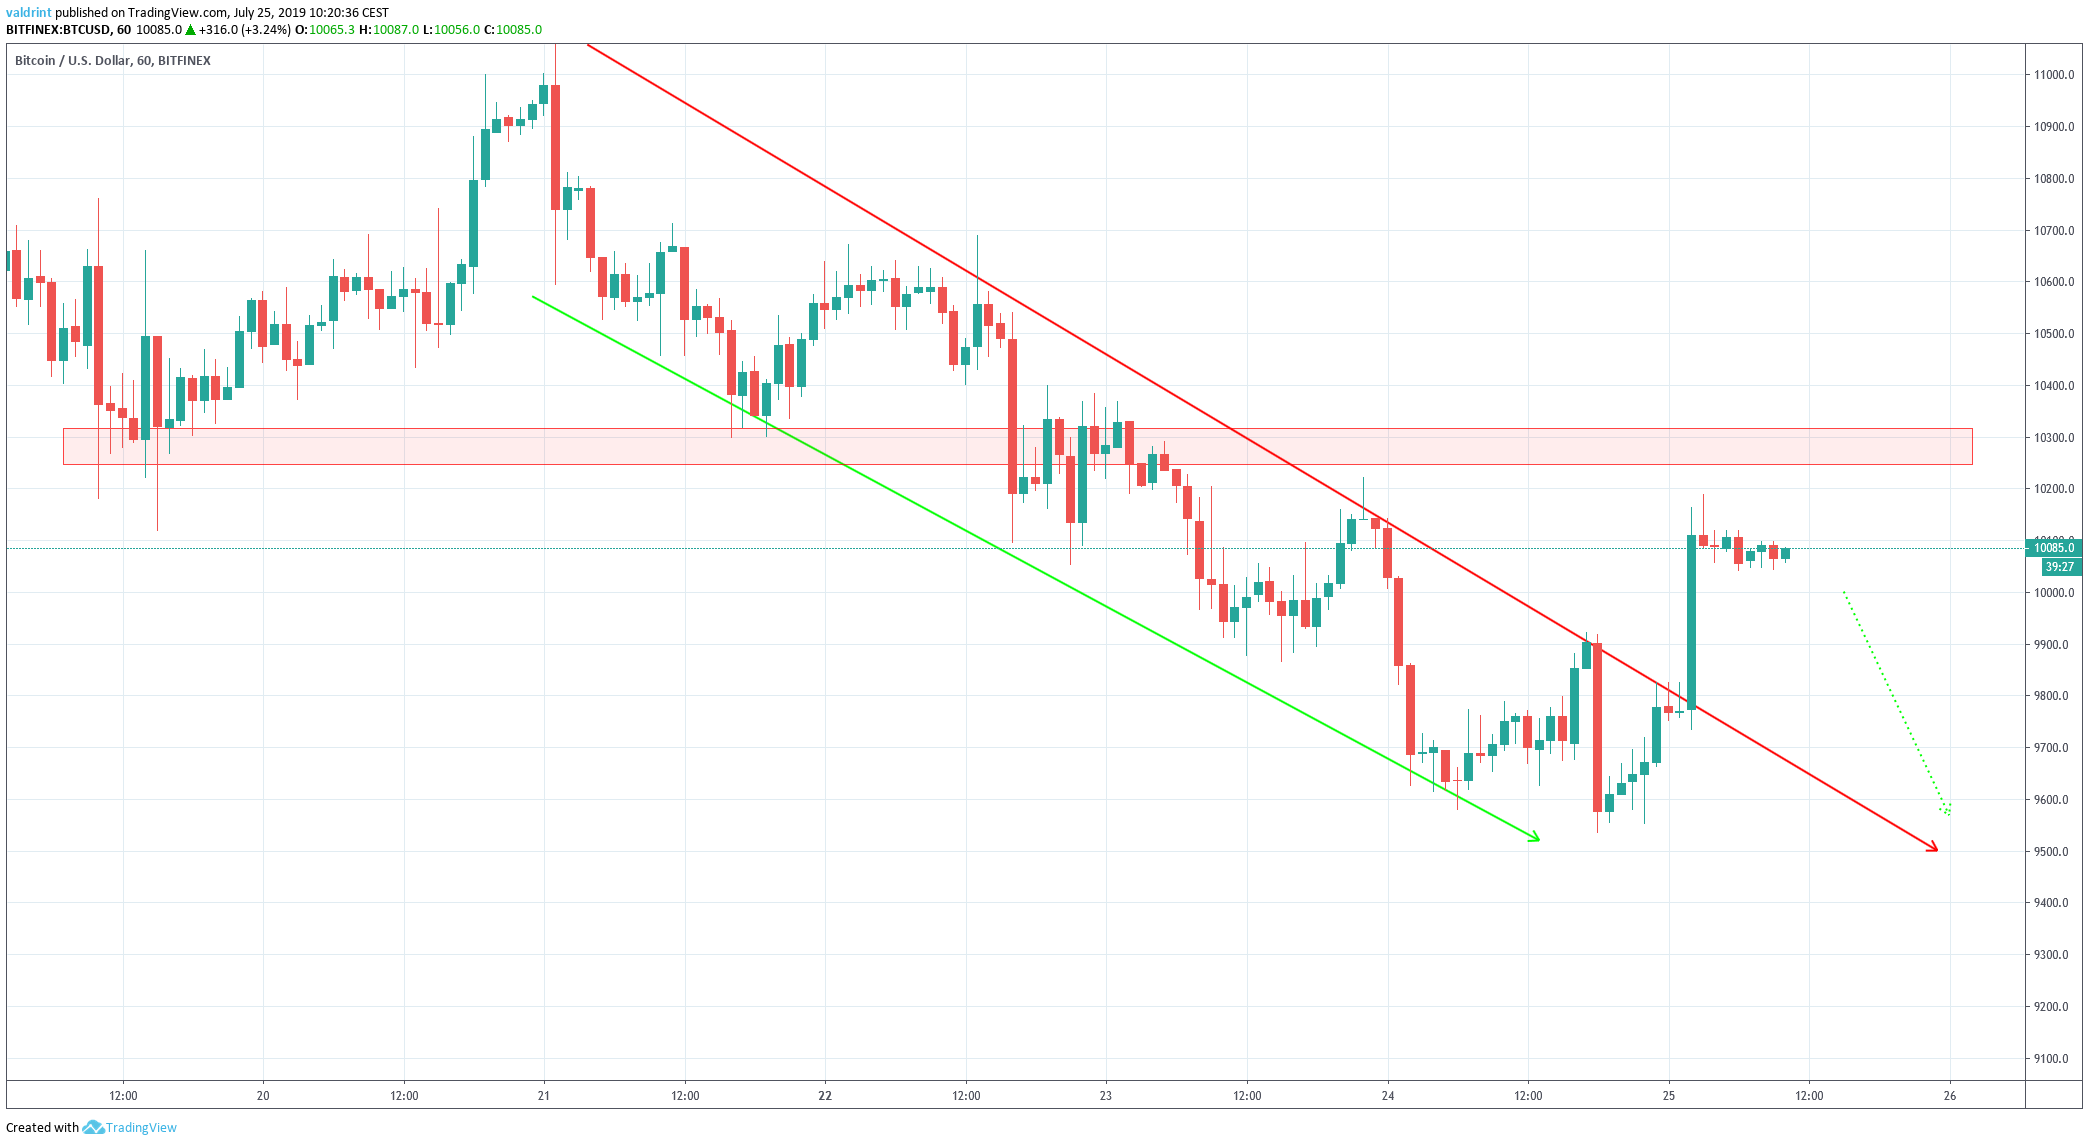
In the first one, the price will increase until it reaches the resistance area near $10,300.
The second predicts the price decreasing until it reaches the previous resistance line.
Which one is more likely?
Technical Indicators
A look at Bitcoin’s daily chart shows that recent upward moves have been contained within prior decreases and have not led to higher highs.
The first observable instance of this was during the increase on July 17. The entire upward move was contained within the bearish candle on July 16.
While the price briefly reached values above $11,000, it failed to reach a close at that level and immediately began to decrease.
In the current increase, the bearish candle on July 23 opened at $10,300, coinciding with the resistance area outlined in the previous section.
If the price acts in the same manner as it did on July 16, it will increase towards $10,300 before it begins to decrease.
Additionally, a look at the moving averages (MA) gives several bearish implications.
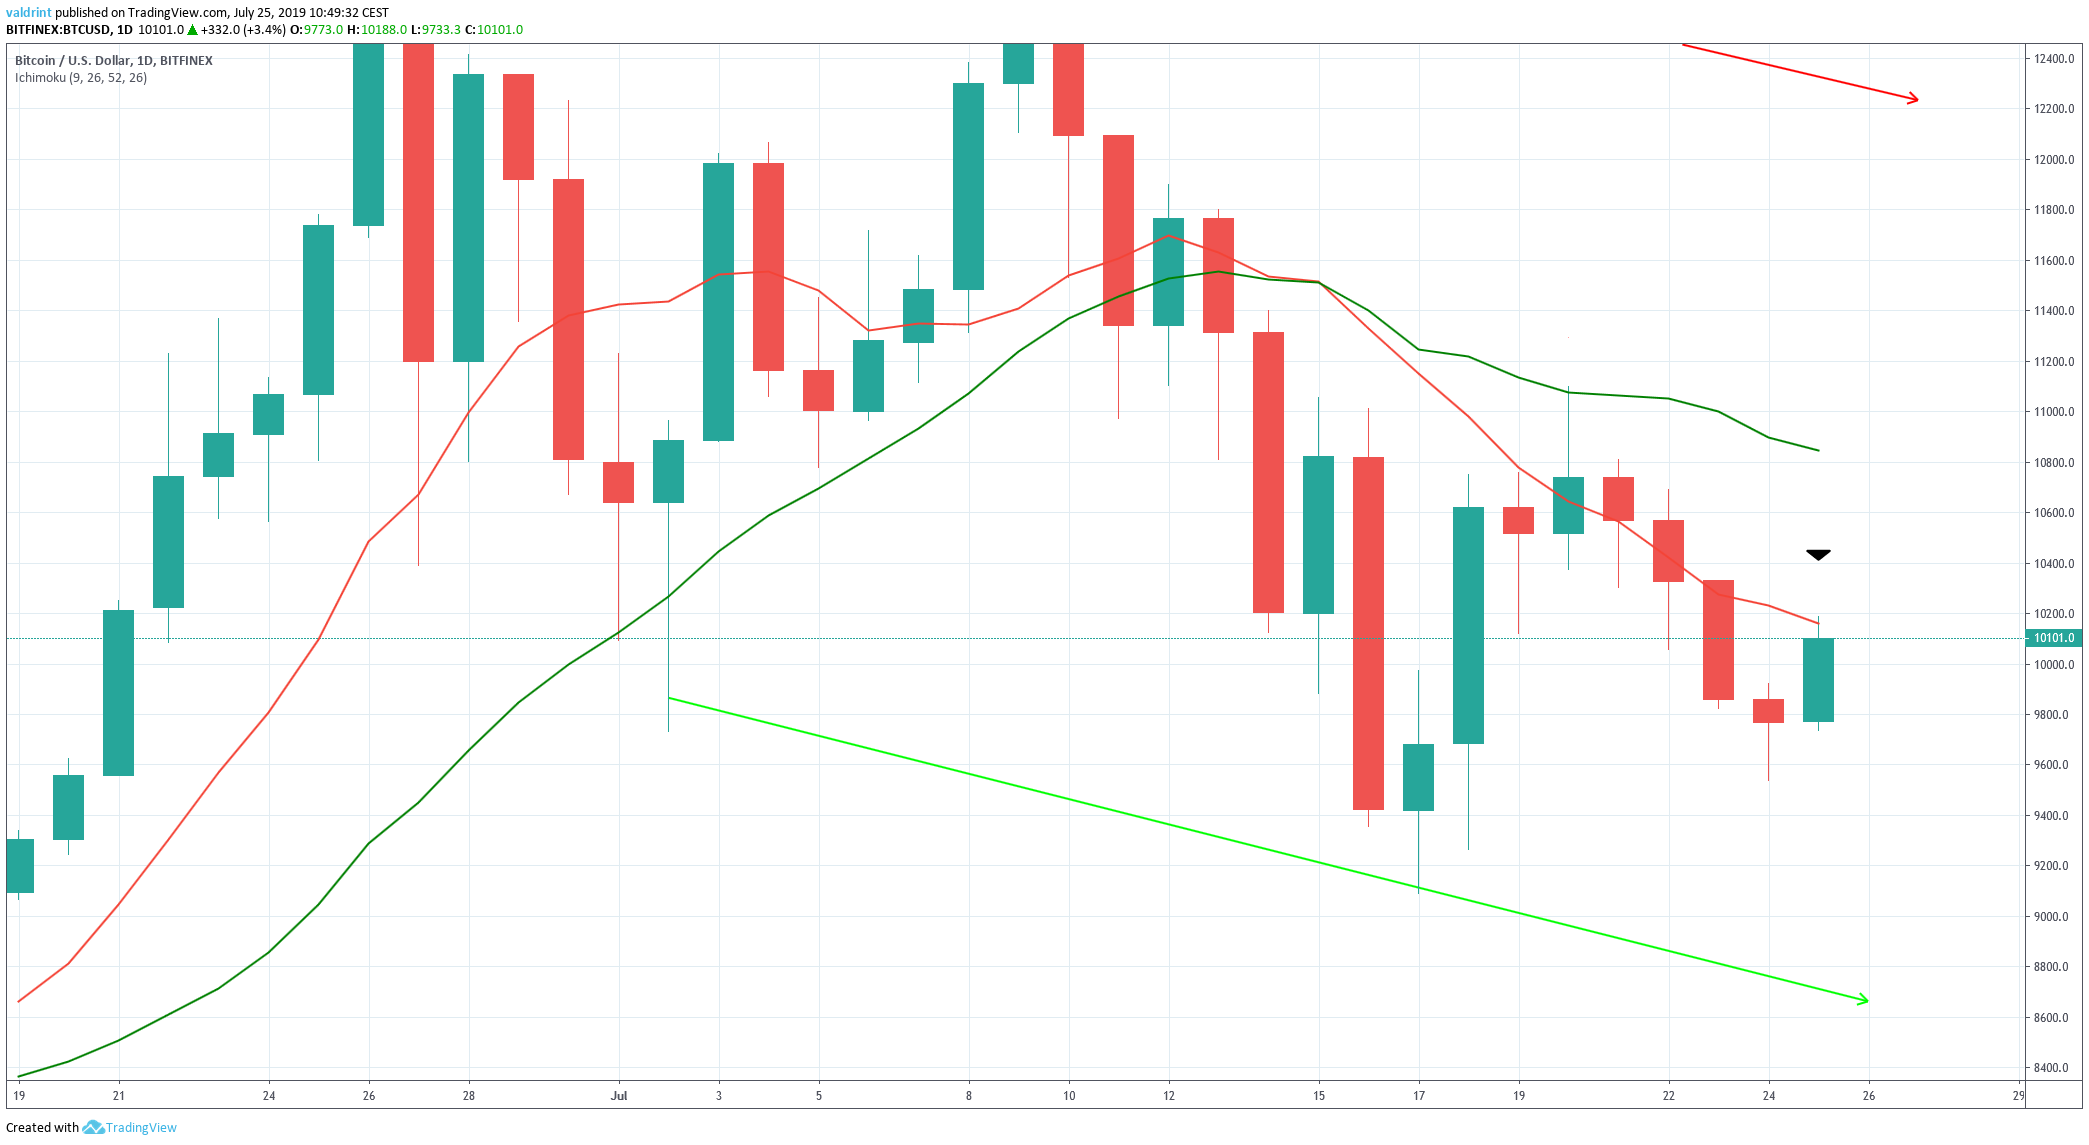
The 10 and 20-day moving averages have previously made a bearish cross.
The price is now trading below both MAs and facing very close resistance from the former.
The use of this indicator suggests that the price is still in a downtrend.
Reversal Areas
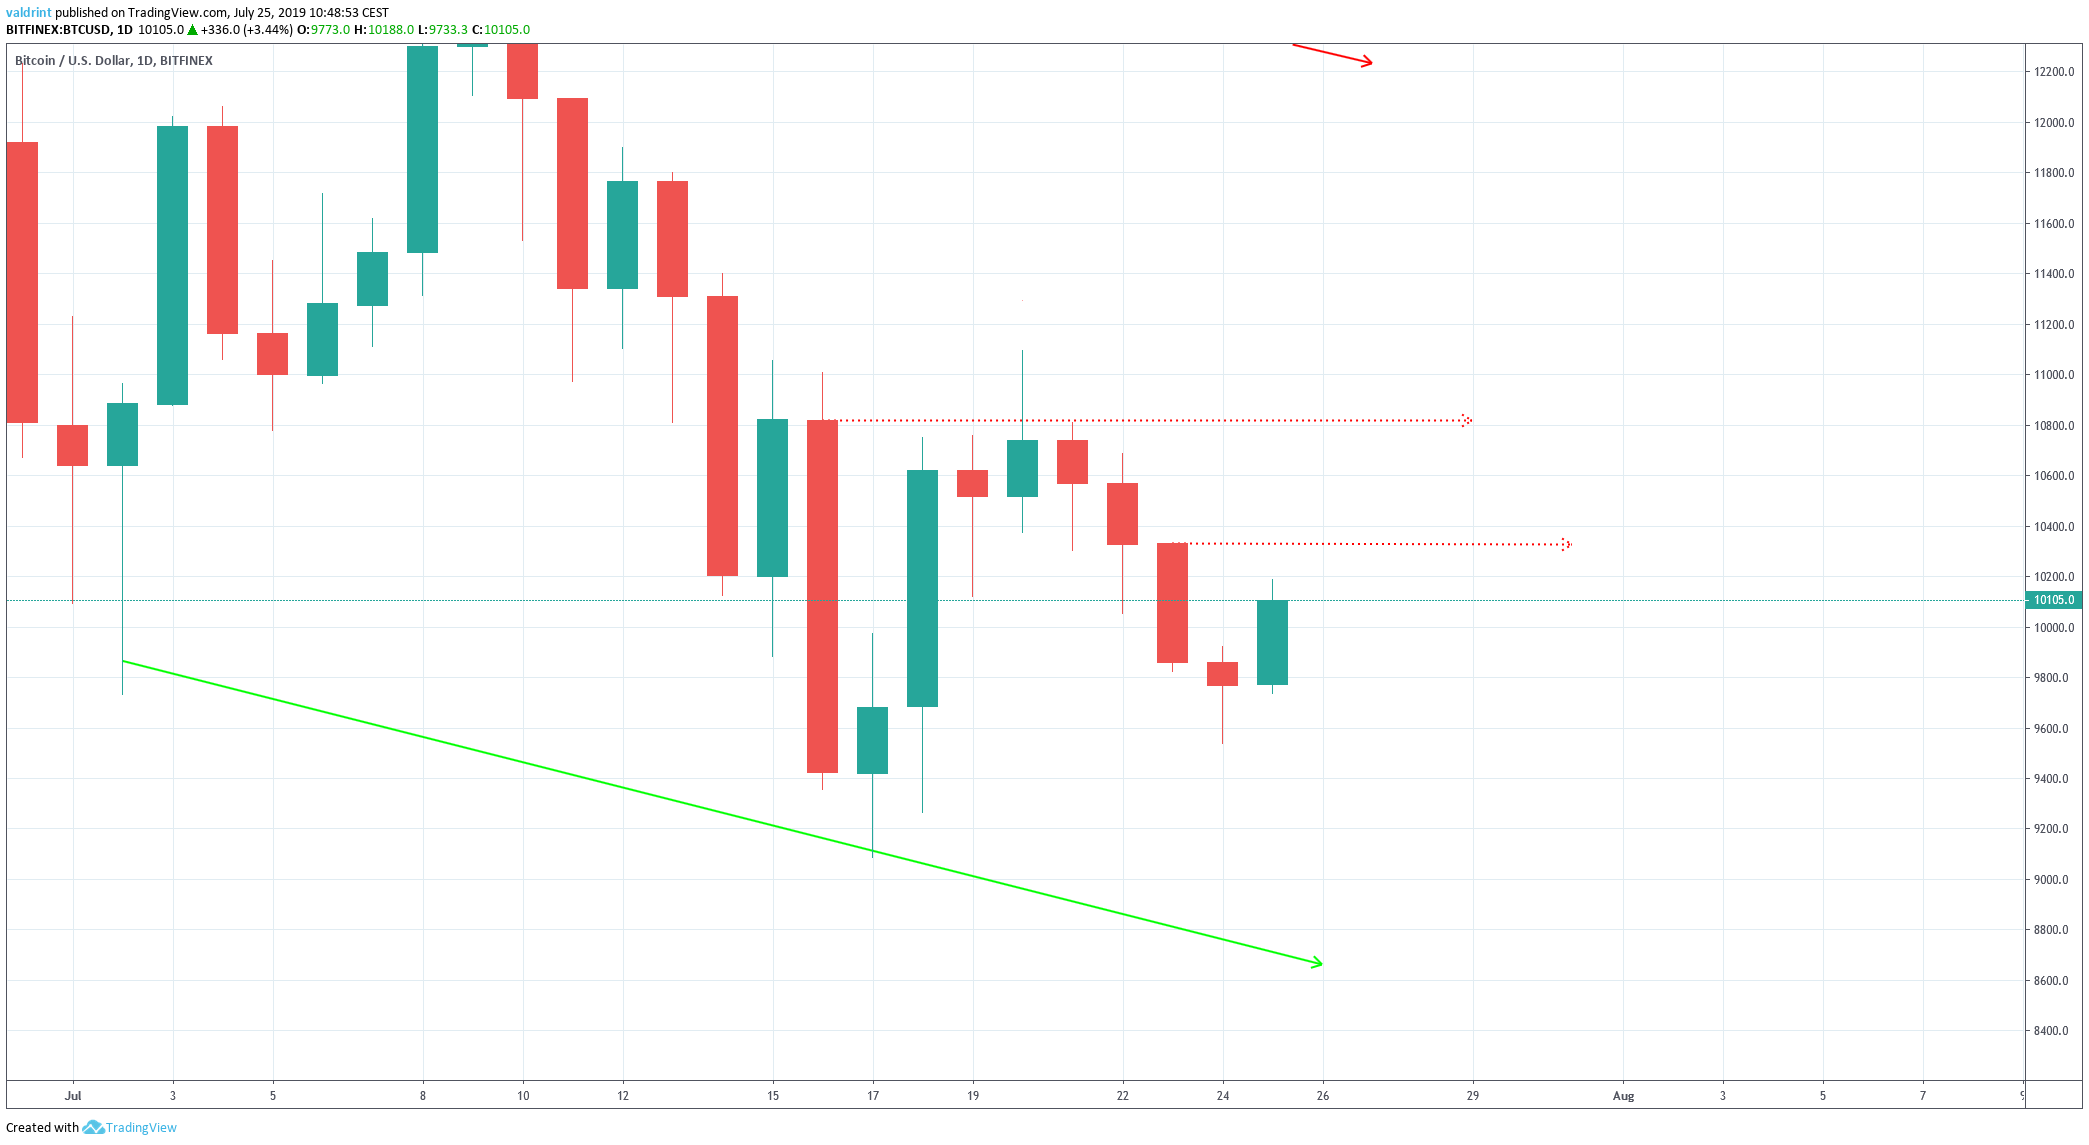
In order to get a better understanding of possible BTC price movement, one resistance and one support area are outlined below.
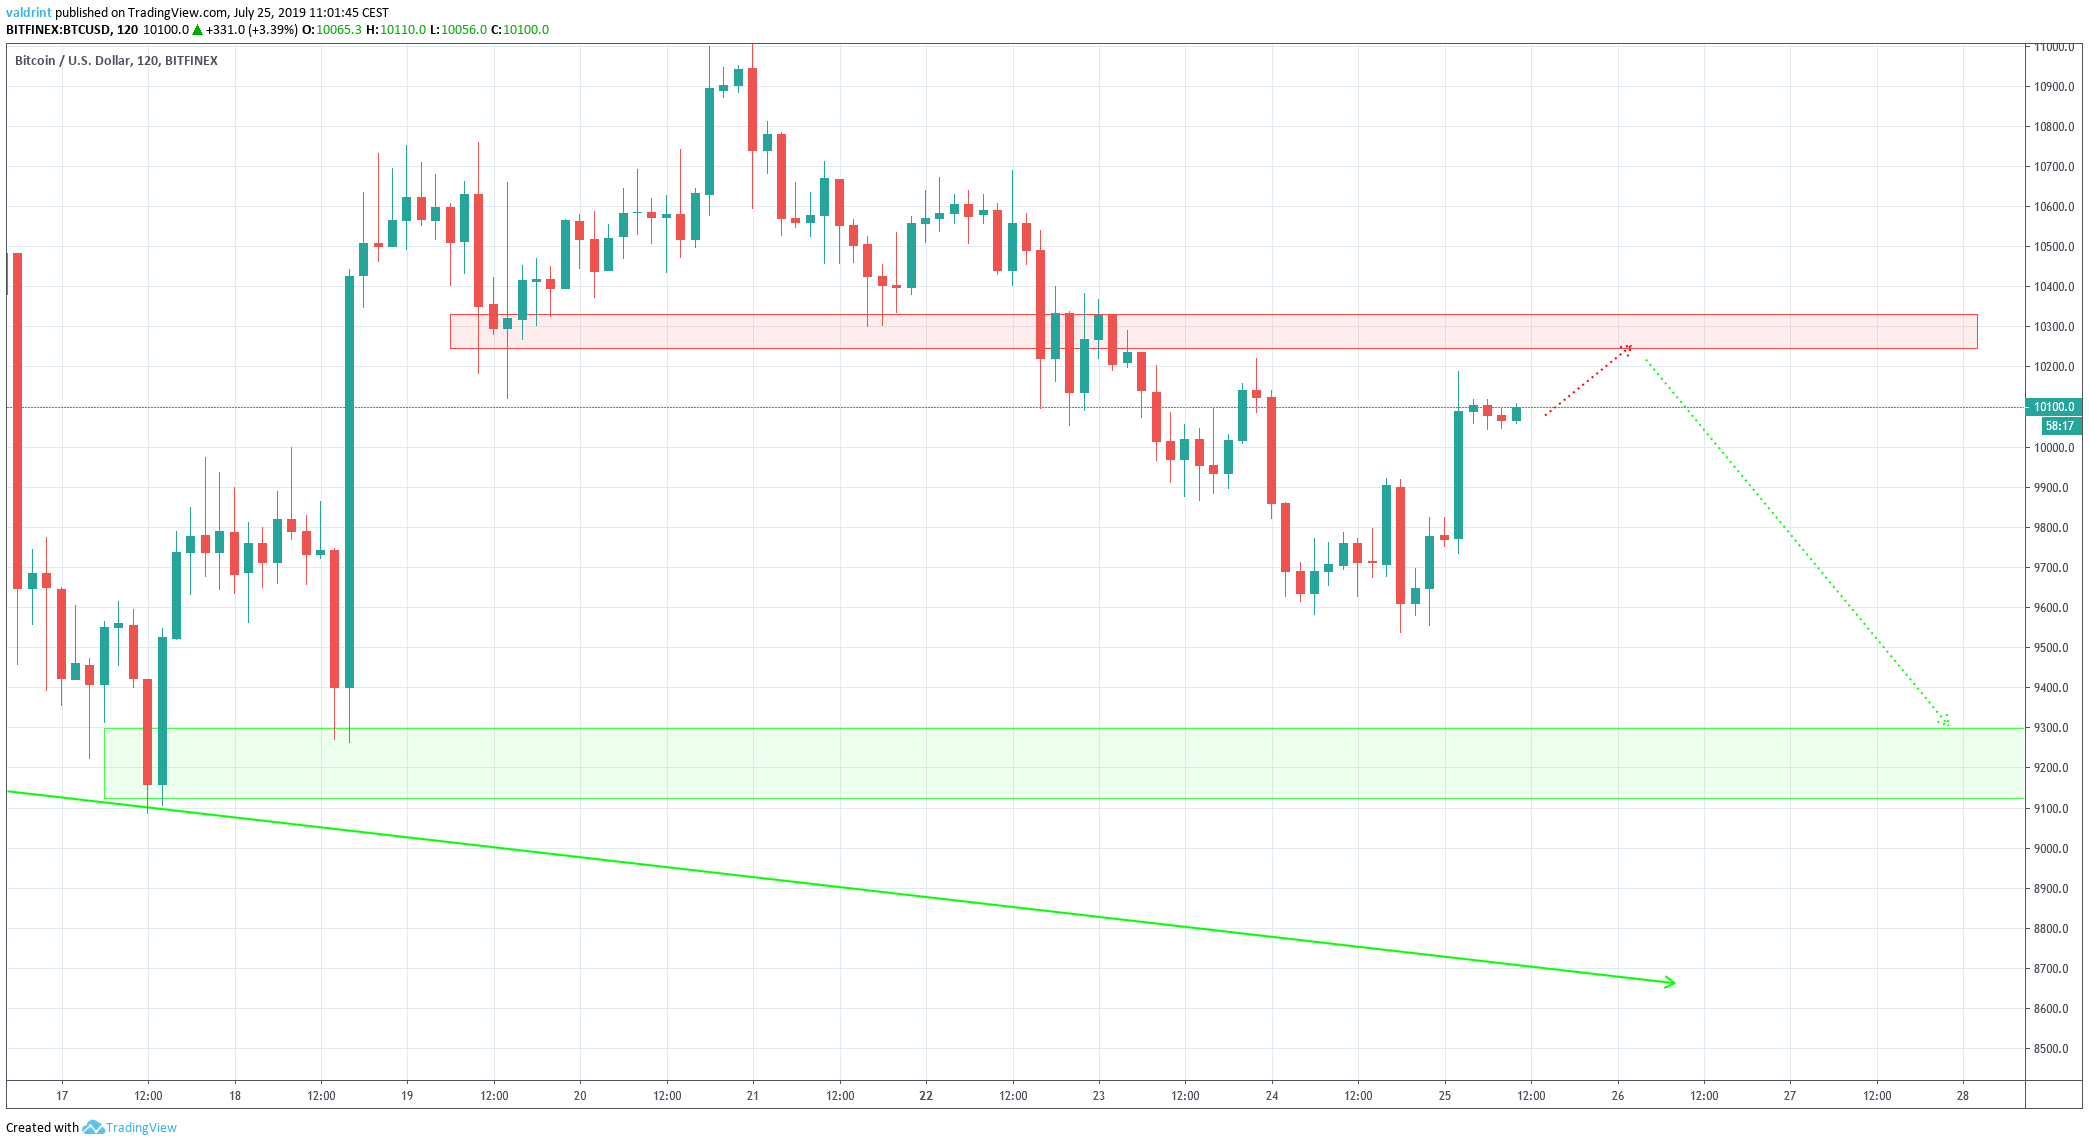
The closest resistance area is found at $10,300.
The closest support area is found at $9200.
According to our analysis, the price is likely to continue its increase until it reaches the resistance area before beginning to decrease.
We believe it will eventually reach the support area documented above.
Summary
The BTC price recently broke out from a descending channel.
It is facing resistance from the daily moving averages.
According to our analysis, it will increase in the short-term before continuing its downtrend.
Do you believe BTC will reach the support area outlined above? Let us know your thoughts in the comments below.
Disclaimer: This article is not trading advice and should not be construed as such. Always consult a trained financial professional before investing in cryptocurrencies, as the market is particularly volatile.
Images are courtesy of TradingView.


