
On June 4, the Bitcoin (BTC) price reached a high of $8498.59. A rapid decrease began and the price reached a low of $7449.4 the same day. Since then, it has been increasing, reaching highs of $8134.99 on June 7.
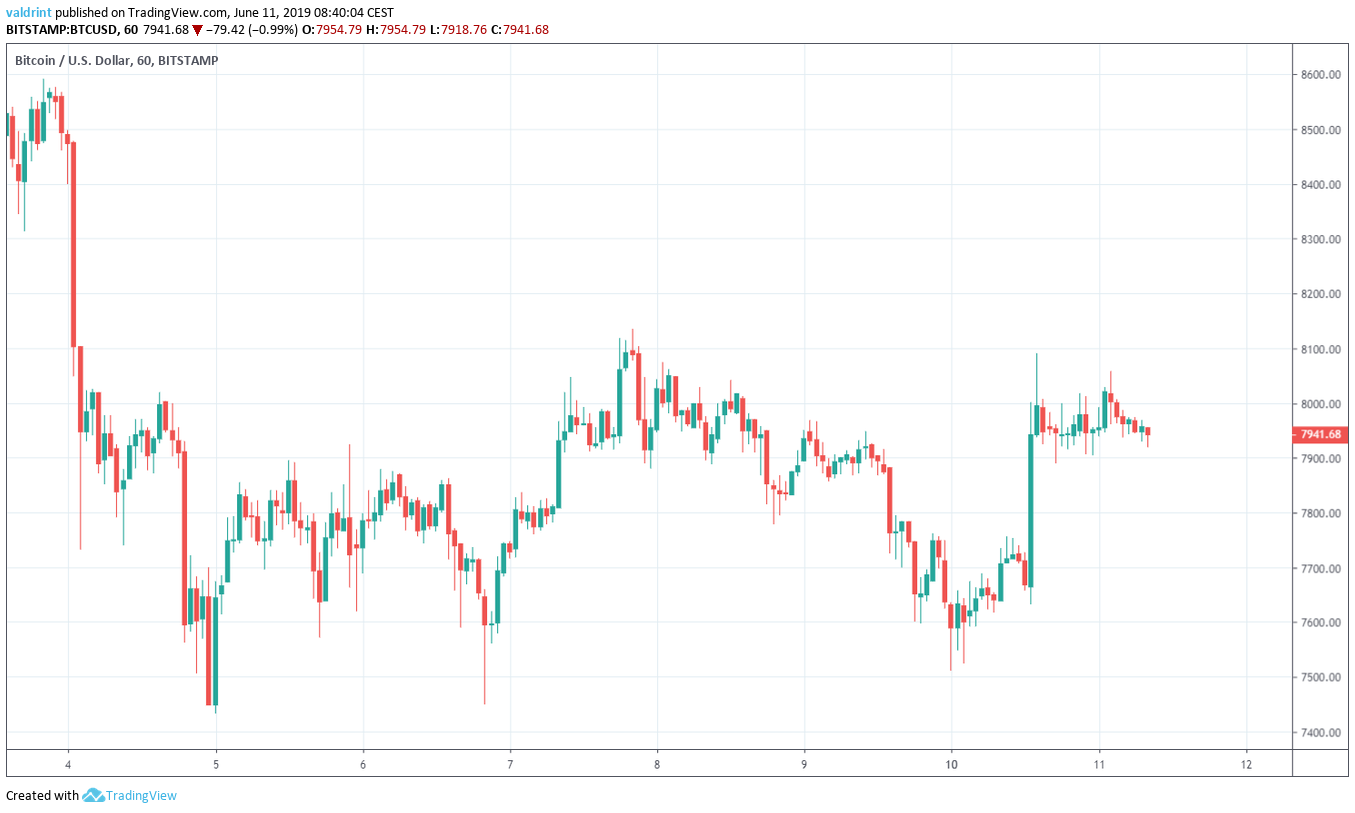
Will Bitcoin create a trading range above $8000 or will the BTC price break down? Keep scrolling below in order to find out. (Click here to read our previous analysis.)
Bitcoin Price (BTC): Trends and Highlights for June 11, 2019
- The price of BTC/USD reached a high on June 4.
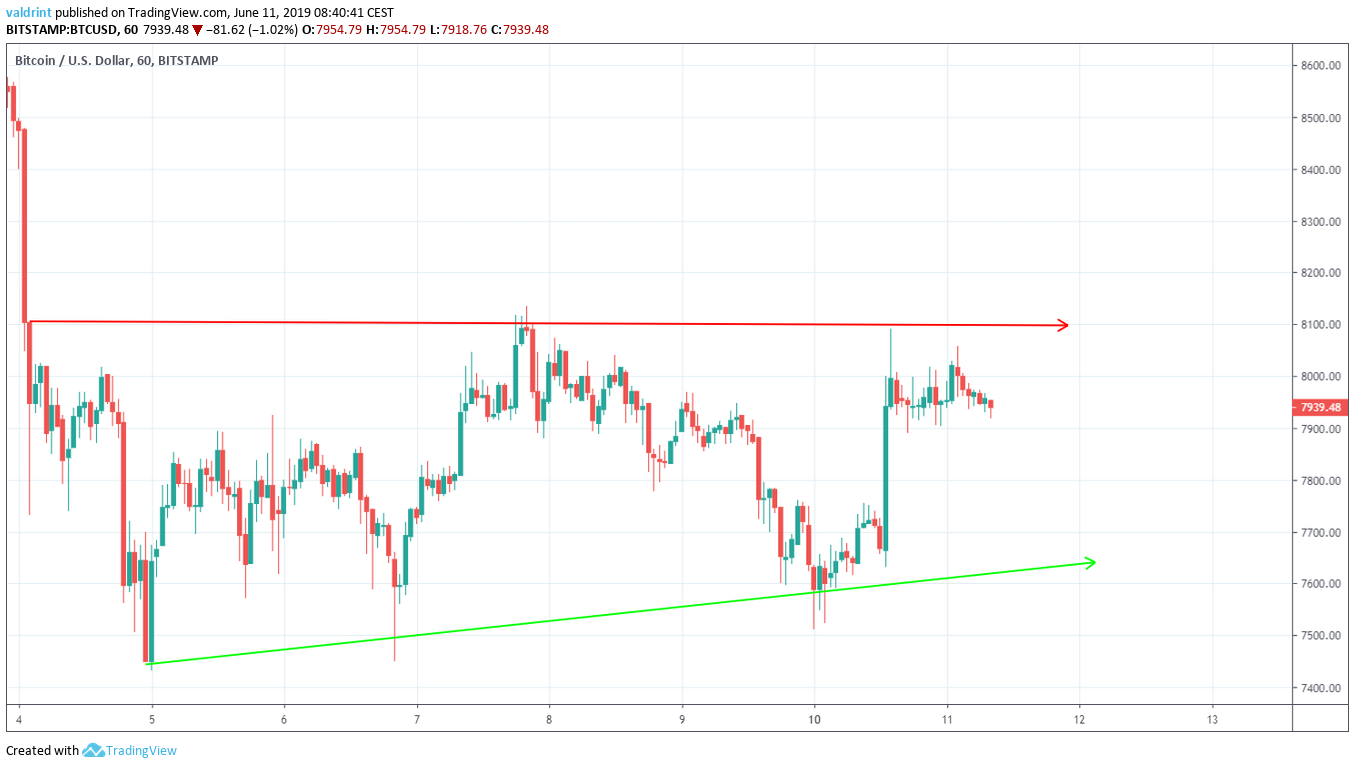
- It is trading inside an ascending triangle.
- There is a short-term bearish divergence developing in the RSI.
- The 10- and 20-day moving averages have made a bearish cross.
- The BTC price has created an evening star reversal pattern in a weekly time-frame.
- There is resistance near $8400.
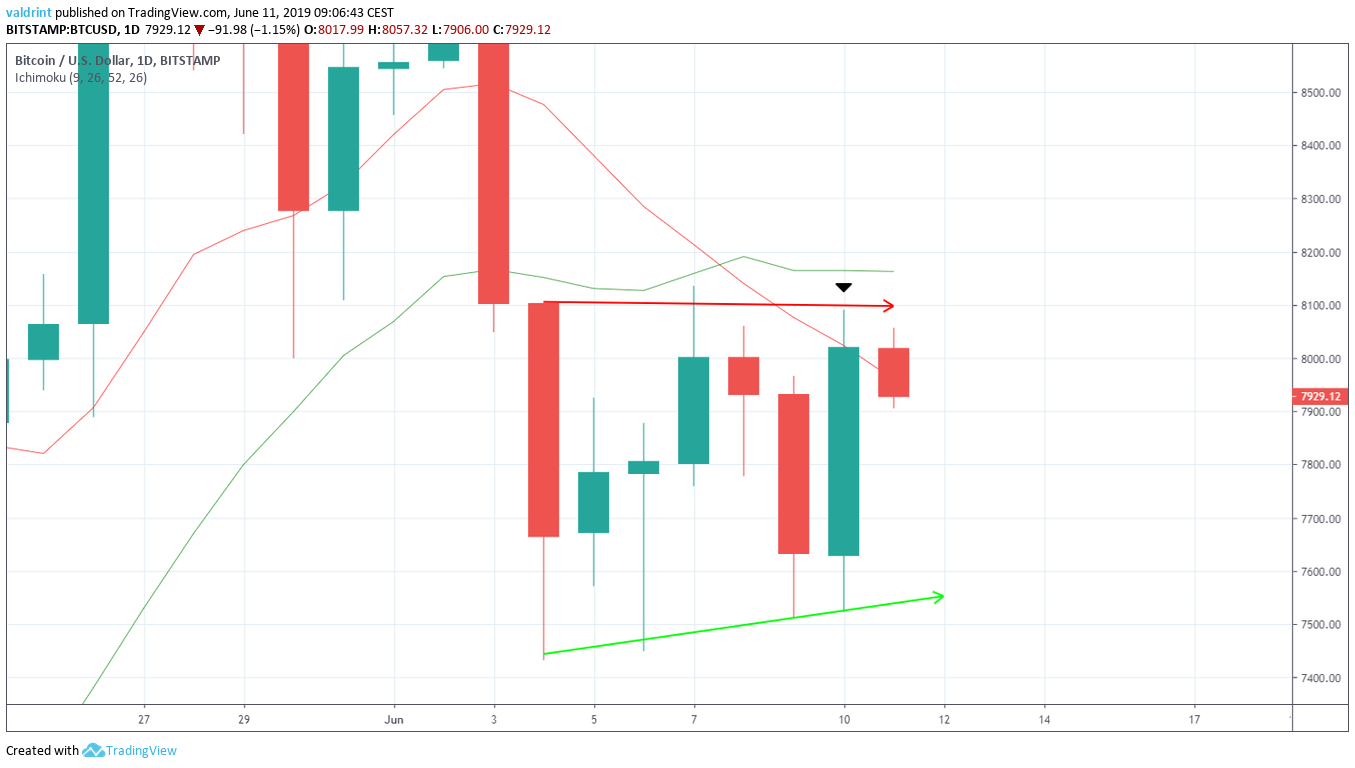
Ascending Triangle
On June 3, the price of BTC reached an hourly high of $8103.63. A rapid decrease began the same day. The Bitcoin price reached lows of $7449.68 the same day. A gradual increase ensued.
Since then, the price has been trading inside the ascending triangle outlined below:
An analysis of weekly candlesticks refutes this possibility.
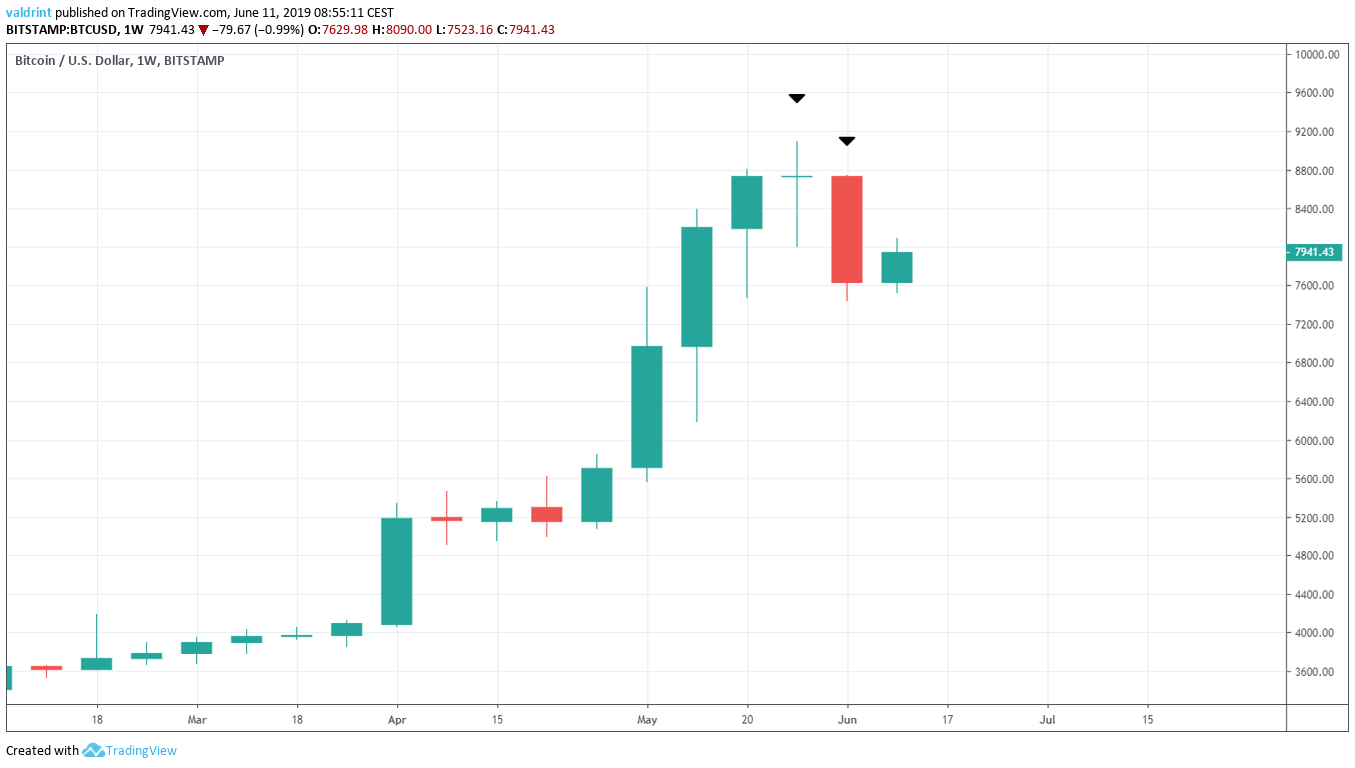
The price of BTC has created an evening star pattern. It is a bearish reversal pattern consisting of three candles: a large bullish candlestick, a candlestick with a small body and a bearish engulfing candle.
Last week’s candle ($7633) closed below the opening price of the candle for the two weeks prior ($8133).
Even though the Bitcoin price increased yesterday, this does nothing to change the overall long-term view. Yesterday’s increases are still insignificant relative to the massive bearish candle of the week prior. A close for the week above $8800 would invalidate this pattern.
Now, let’s take a look at technical indicators and try to predict future BTC price movements.
Bitcoin Price: Technical Indicators
The price of BTC is analyzed alongside the RSI below:
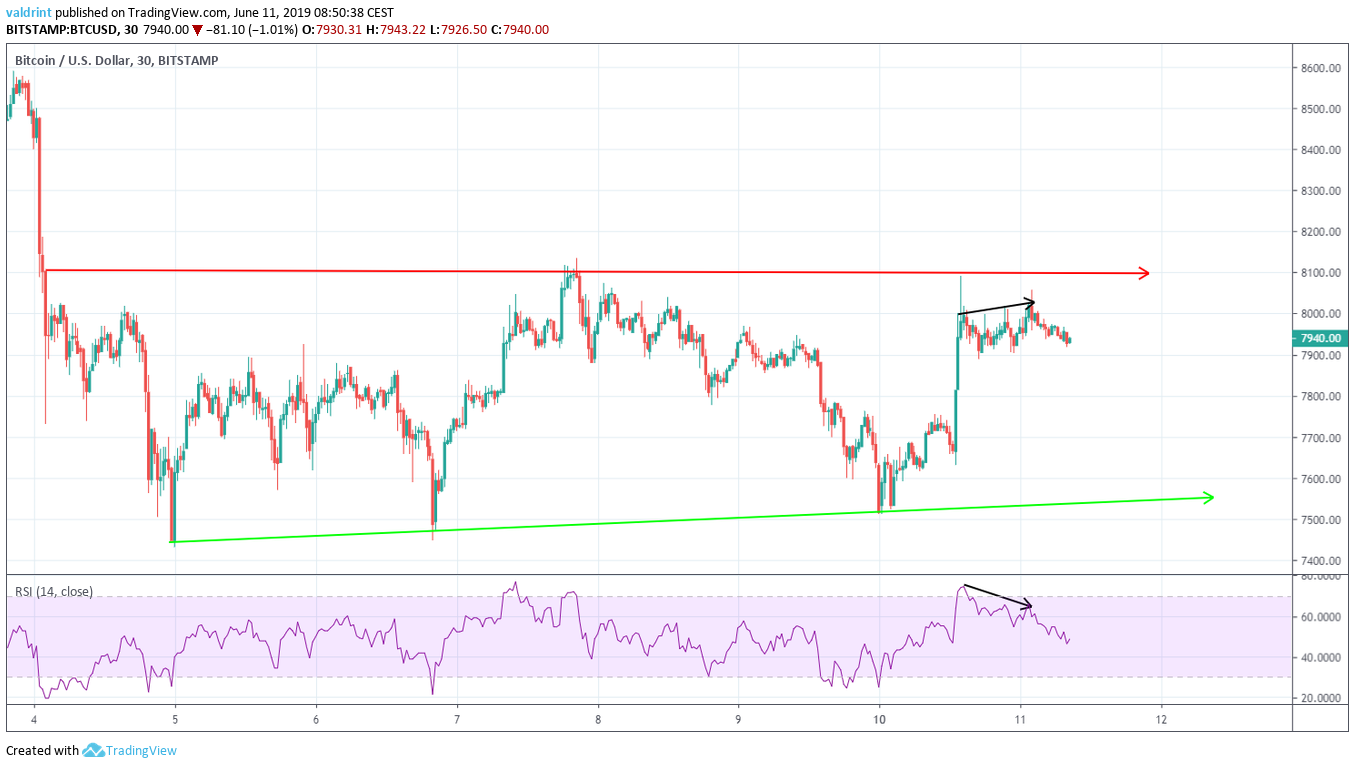
On June 10 and 11, the price twice touched the resistance line of the triangle. The RSI however, created successive lower highs. This is known as bearish divergence and often precedes price decreases. However, it is only occurring in very short-term time-frames.
Furthermore, the ascending triangle is a bullish pattern, reducing the significance of the divergence.
However, an analysis of long-term moving averages gives a similarly bearish outlook.
On June 7, the 10-day MA crossed below the 20-day one. This is known as a bearish cross and often indicates that a downtrend has begun. Furthermore, yesterday’s candlestick made an unsuccessful attempt at moving above the 10-day MA.
At the time of writing, the price was trading below both moving averages, facing very close resistance from the 10-day one.
The use of these indicators supports price decreases towards the support line of the triangle.
Future Movement
One resistance area for BTC/USD is traced in the graph below. It is used to determine future areas of reversal.
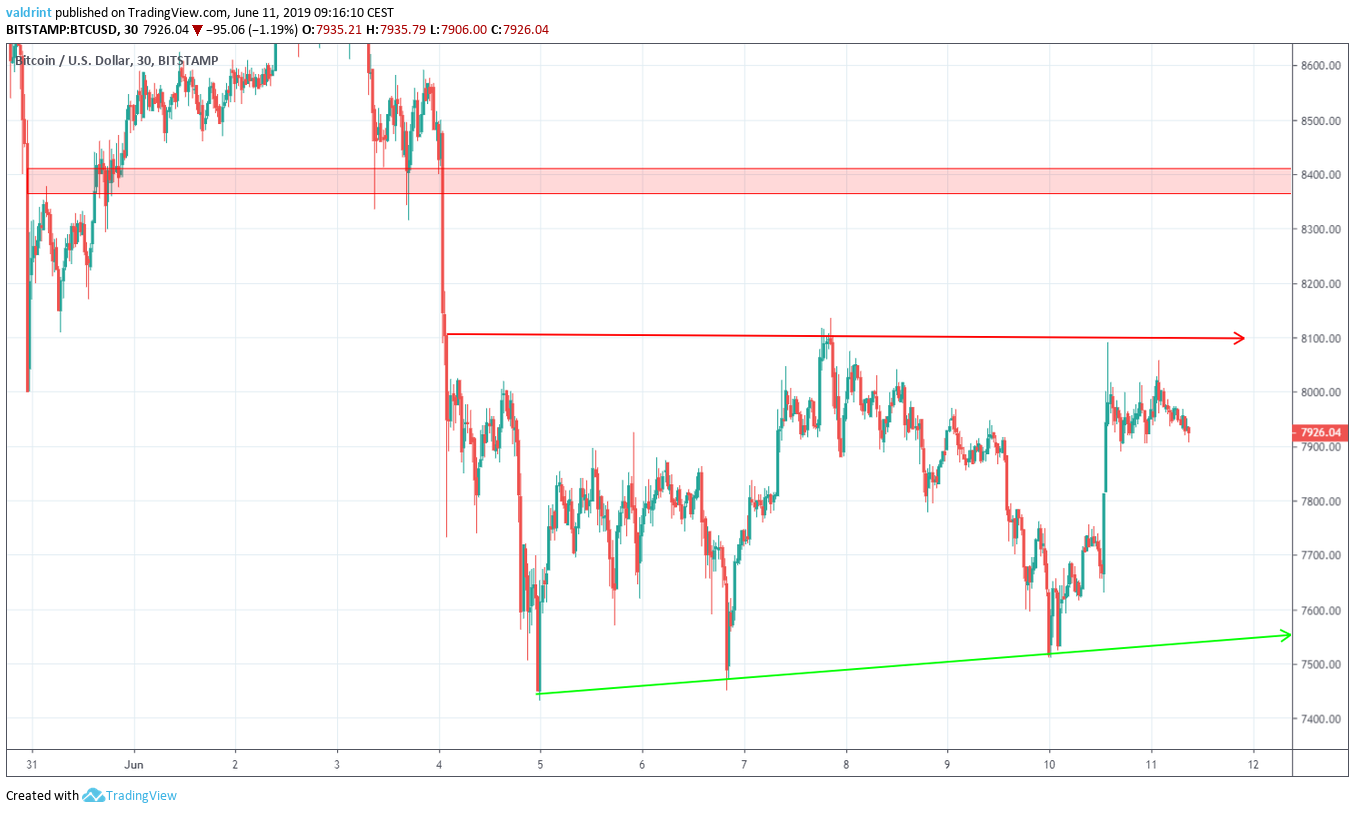
Even though technical indicators support a BTC price decrease, a breakout is still technically possible. If the price breaks out, the closest resistance area is found near $8400. It is likely to provide a reversal.
Summary
Bitcoin (BTC) is trading inside an ascending triangle. The daily moving averages give a bearish outlook. Furthermore, in a weekly time-frame, the Bitcoin price has created a bearish reversal pattern. The short-term bearish divergence supports a decrease toward the support line outlined above.
Do you think the Bitcoin price will break reach the support line of the triangle? Let us know in the comments below.
Disclaimer: This article is not trading advice and should not be construed as such. Always consult a trained financial professional before investing in cryptocurrencies, as the market is particularly volatile.
