


On May 30, the Bitcoin (BTC) price reached a high of $9109.0. The same day, a rapid decrease began — which was followed by a gradual increase. On June 2, the price of BTC reached highs near $8800. However, another rapid decrease began on June 4.
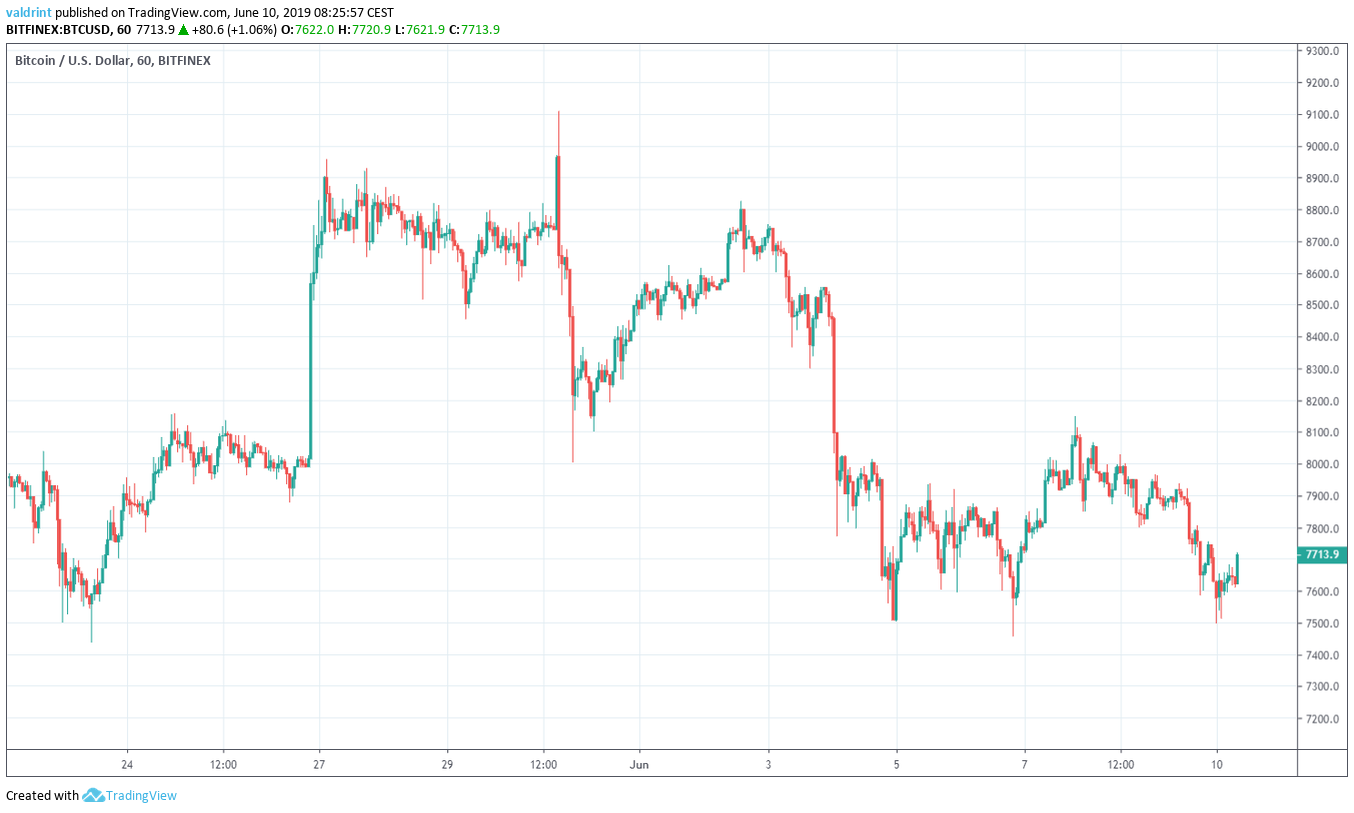
On June 5 and 6, the Bitcoin price made lows near $7500. After a gradual increase, the price reached the same levels on Jun 10.
Will the $7500 level hold or will the BTC price break down? Keep scrolling below in order to find out. (Click here to read our previous analysis.)
Bitcoin Price (BTC): Trends and Highlights for June 10, 2019
- The price of BTC/USD reached a high on May 30.
- It is trading inside a descending triangle.
- The 10- and 20-day moving averages have made a bearish cross.
- The BTC price has created an evening star reversal pattern in a weekly time-frame.
- There is support near $7000.
- There is resistance near $7950.
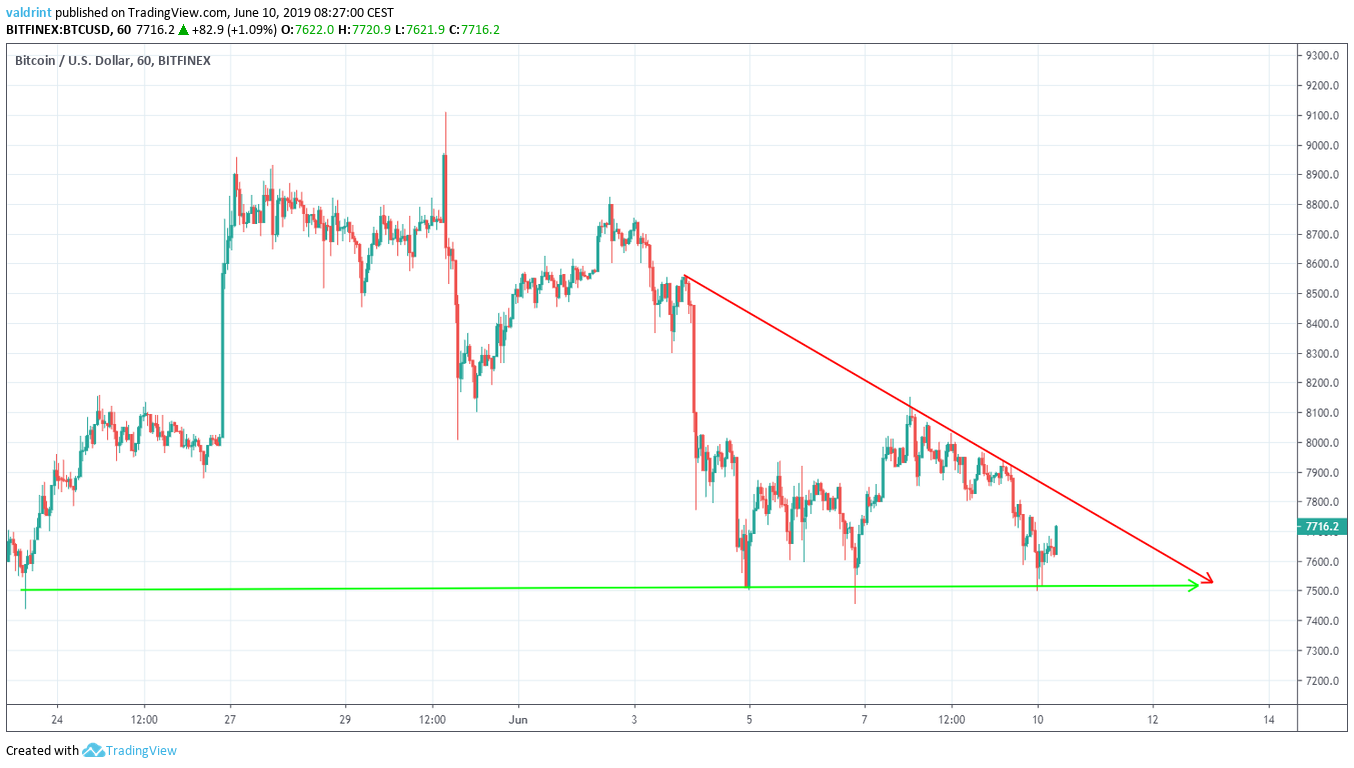
Descending Triangle
On June 3, the price of BTC reached an hourly high of $8555.0. A rapid decrease began the same day. The Bitcoin price reached lows of $7501.5 the same day. A gradual increase was followed by a decrease.
Since then, the price has been trading inside the descending triangle outlined below:
An analysis of weekly candlesticks refutes this possibility.
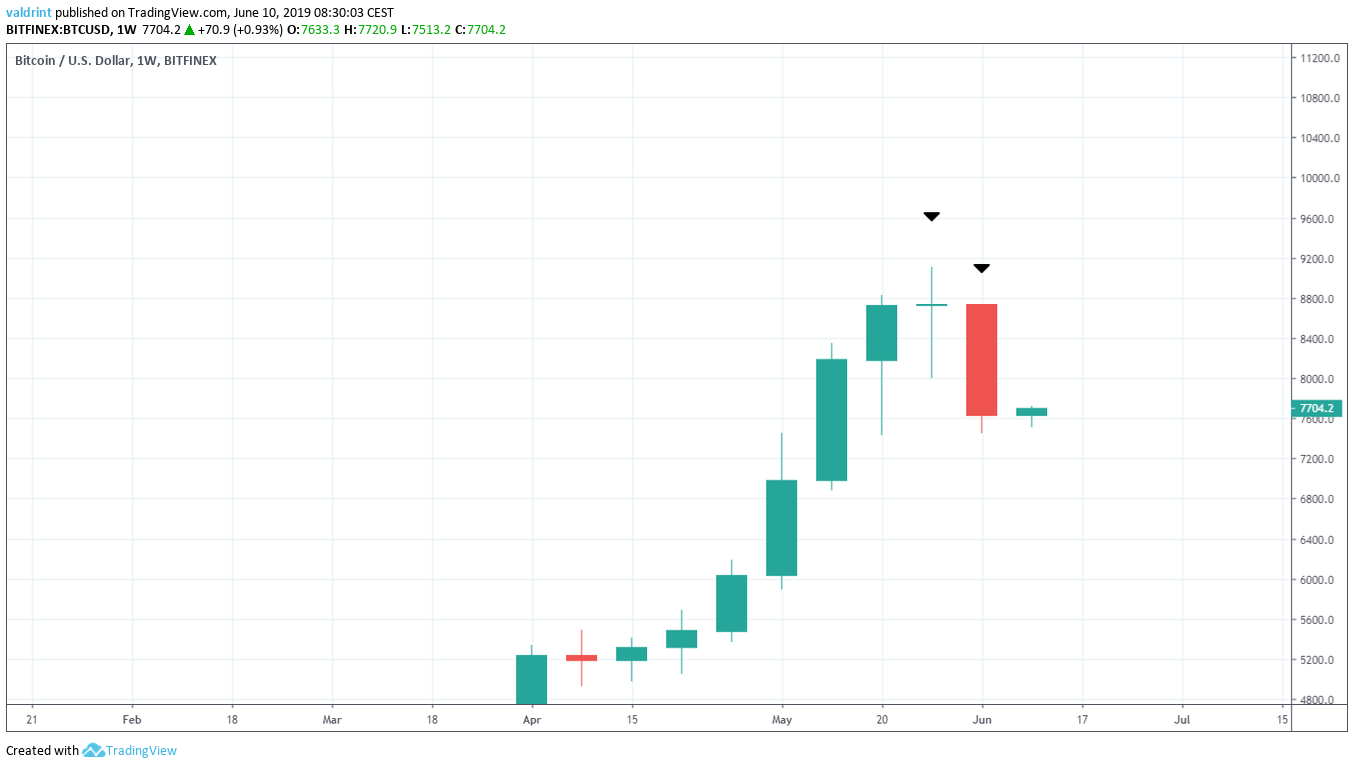
Last week’s candle ($7633) closed below the opening price of the candle for the two weeks prior ($8133).
Will the Bitcoin price break down? Let’s take a look at technical indicators and try to find out.
BTC Price: Technical Indicators
The price of BTC is analyzed alongside the 10- and 20- day moving averages (MA) below:
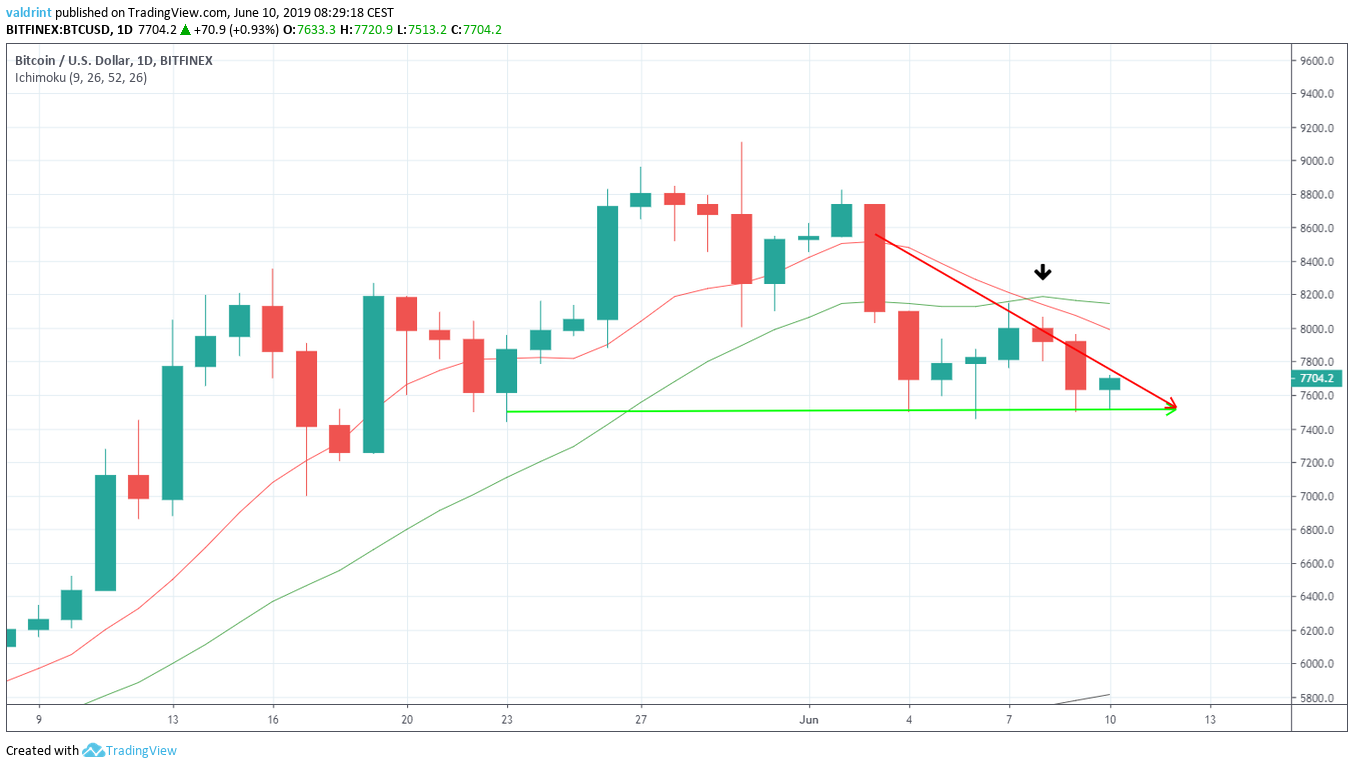
On June 8, a bearish cross occurred between the 10- and 20- day MAs. This is often an indicator that a downtrend has begun. A gradual decrease began shortly after. Furthermore, the 10-day MA is providing very close resistance to the Bitcoin price.
The use of this indicator, combined with the fact that the descending triangle is a bearish pattern, makes it likely that the BTC price will break down from the triangle.
If it does, where will the price find support?
Future Movement
One support and one resistance area for BTC/USD is traced in the graph below. They are used to determine future areas of reversal.
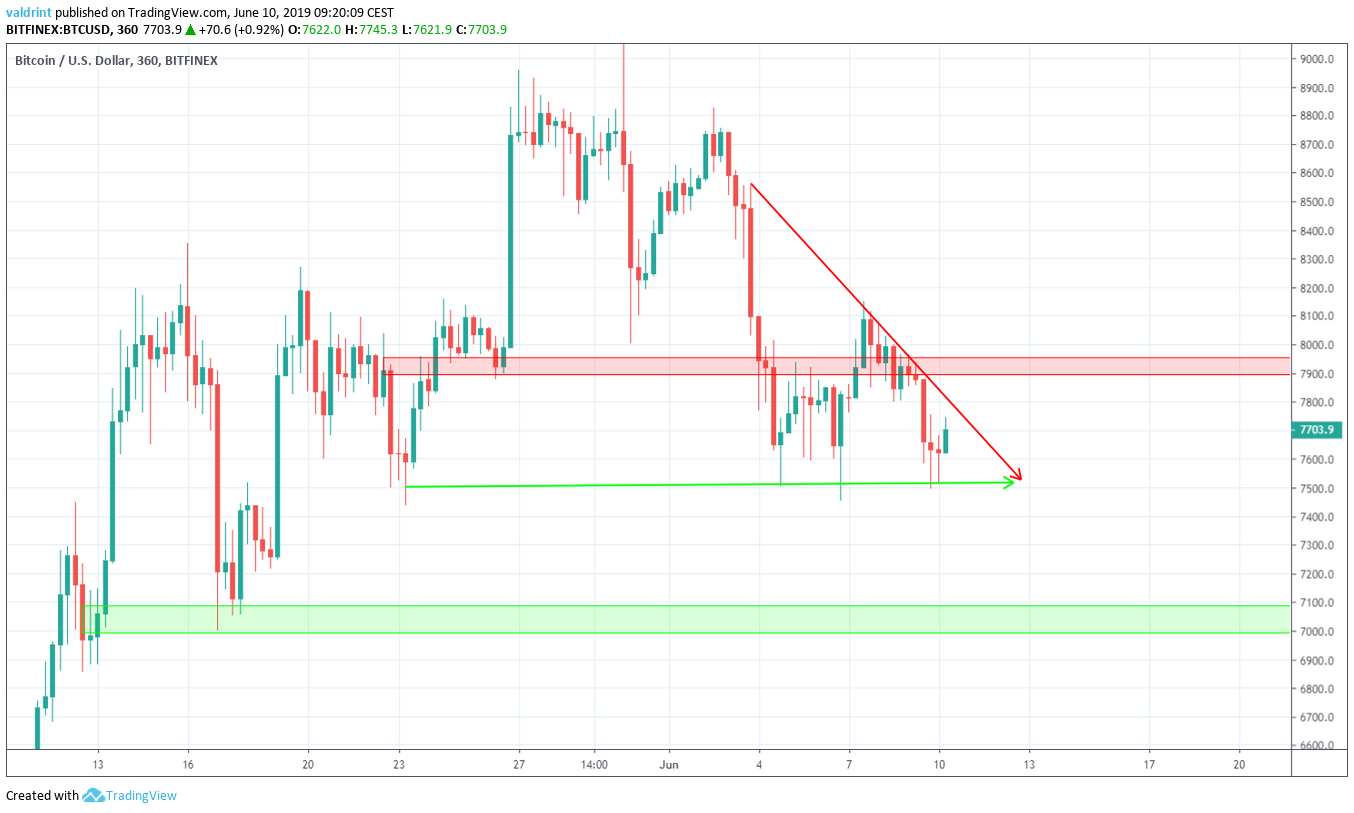
The closest support area is found near $7000. If the Bitcoin price breaks down from the triangle, it is likely to provide support.
Conversely, the closest resistance area is found near $7950. For the price to reach this area it would have to break out from the triangle. An analysis of technical indicators makes this unlikely.
Summary
Bitcoin (BTC) is trading inside a descending triangle. The daily moving averages give a bearish outlook. Furthermore, on a weekly timeframe, the Bitcoin price has created a bearish reversal pattern. The technical indicators support a decrease toward the support line outlined above.
Do you think the Bitcoin price will break down from the triangle? Let us know in the comments below.
Disclaimer: This article is not trading advice and should not be construed as such. Always consult a trained financial professional before investing in cryptocurrencies, as the market is particularly volatile.


