


On May 30, the Bitcoin price reached a high of $9109.0. A rapid decrease began on the same day, which was followed by a gradual increase. On Jun 2, the price of BTC reached highs near $8800. A rapid decrease began on Jun 4.
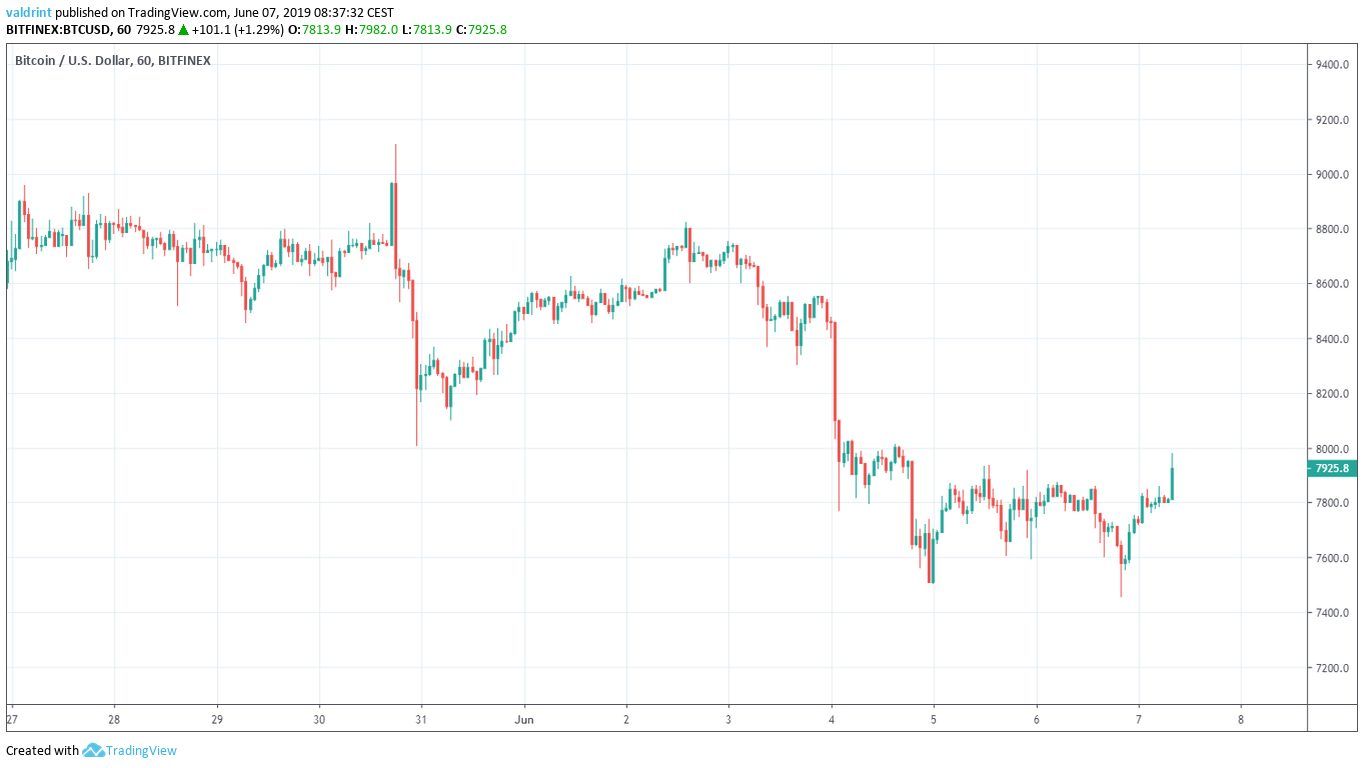
On Jun 5 and 6, the Bitcoin price made lows near $7500.
Will the price continue to decrease or is there a reversal in store? Keep scrolling below in order to find out.
Bitcoin Price (BTC): Trends and Highlights for June 7, 2019
- The price of BTC/USD reached a high on May 30.
- It is trading inside a descending channel.
- It is facing resistance from moving averages
- It is possibly creating an evening star reversal pattern in a weekly time-frame.
- There is support near $7500.
- There is resistance near $8200.
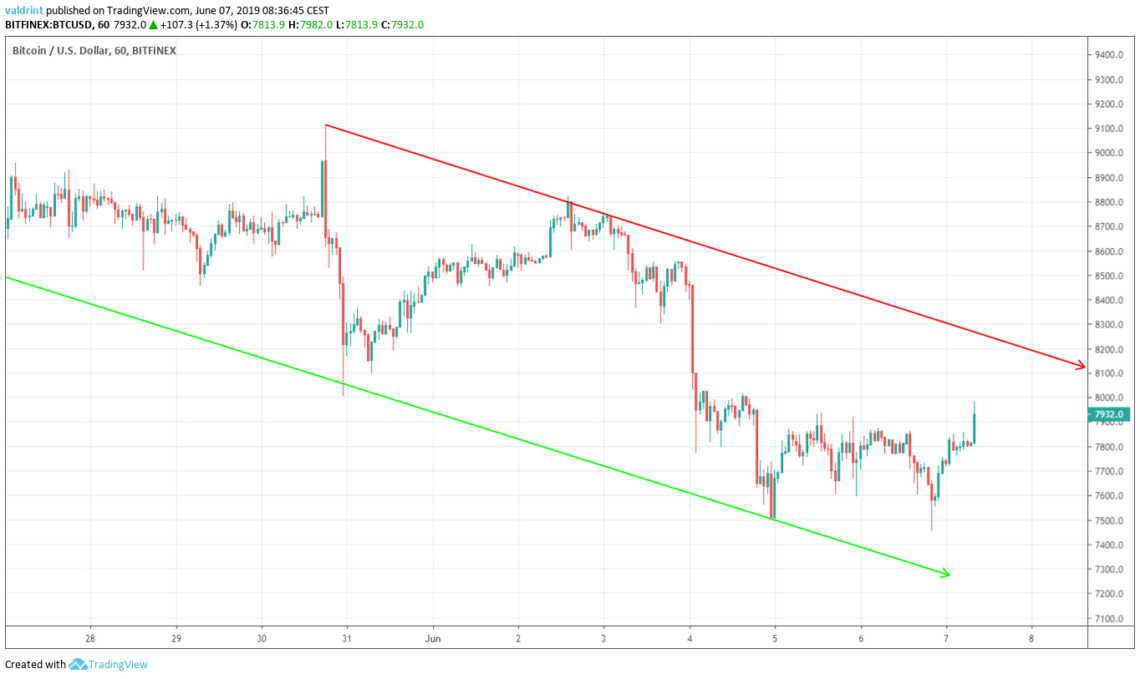
Descending Channel
After reaching a high of $9109.0 on May 30, the Bitcoin price began a rapid decrease. A low of $8005.00 was reached the same day. Several market cycles have been completed and the price has created several lower highs and lows. Tracing them gives us the descending channel outlined below:
After making a low, the price began another upward move on Jun 7. As mentioned in our previous analysis, we believe this upward move is part of the fourth wave according to the Elliott Wave Theory.
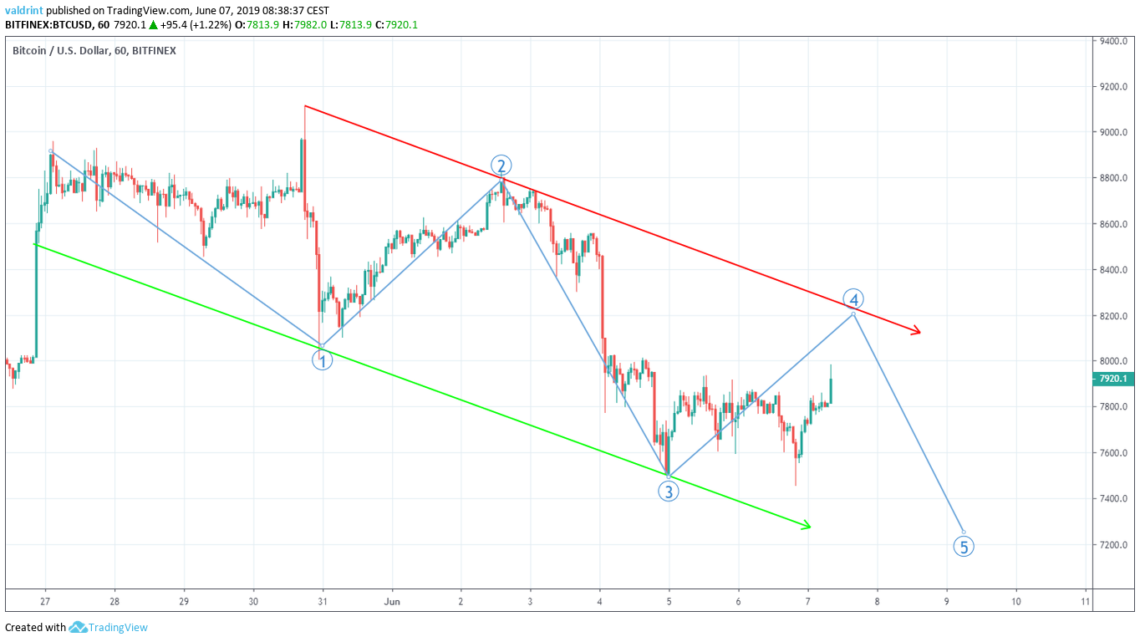
Will the Bitcoin price follow our outlined path? Let’s take a look at some technical indicators:
BTC Price: Technical Indicators
The price of BTC is analyzed alongside the 100- and 200- period moving averages (MA) below:
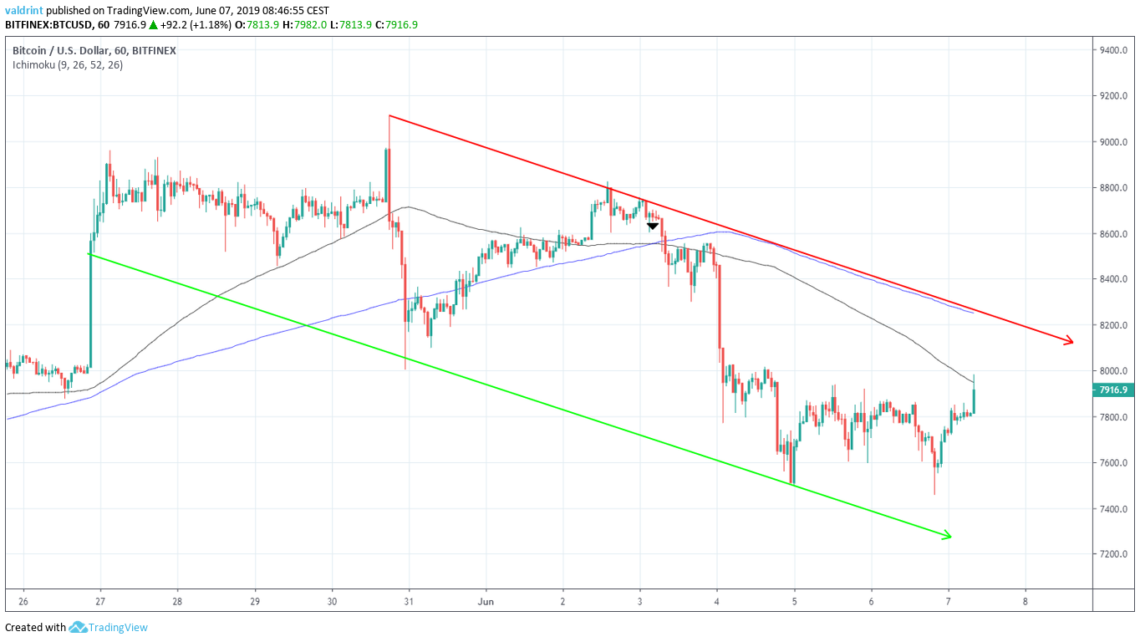
On Jun 3, a bearish cross occurred between the 100- and 200- period MAs. This is often an indicator that a downtrend has begun. A rapid decrease followed shortly after.
Since then, the Bitcoin price has been trading below both moving averages. At the time of writing, it was trying to move above the 100-period one. The 200-period MA coincides with the resistance line of the channel.
As stated in the previous section, we believe it is likely that the price reaches this area — but is a breakout likely?
An analysis of weekly candlesticks refutes the possibility of a breakout.
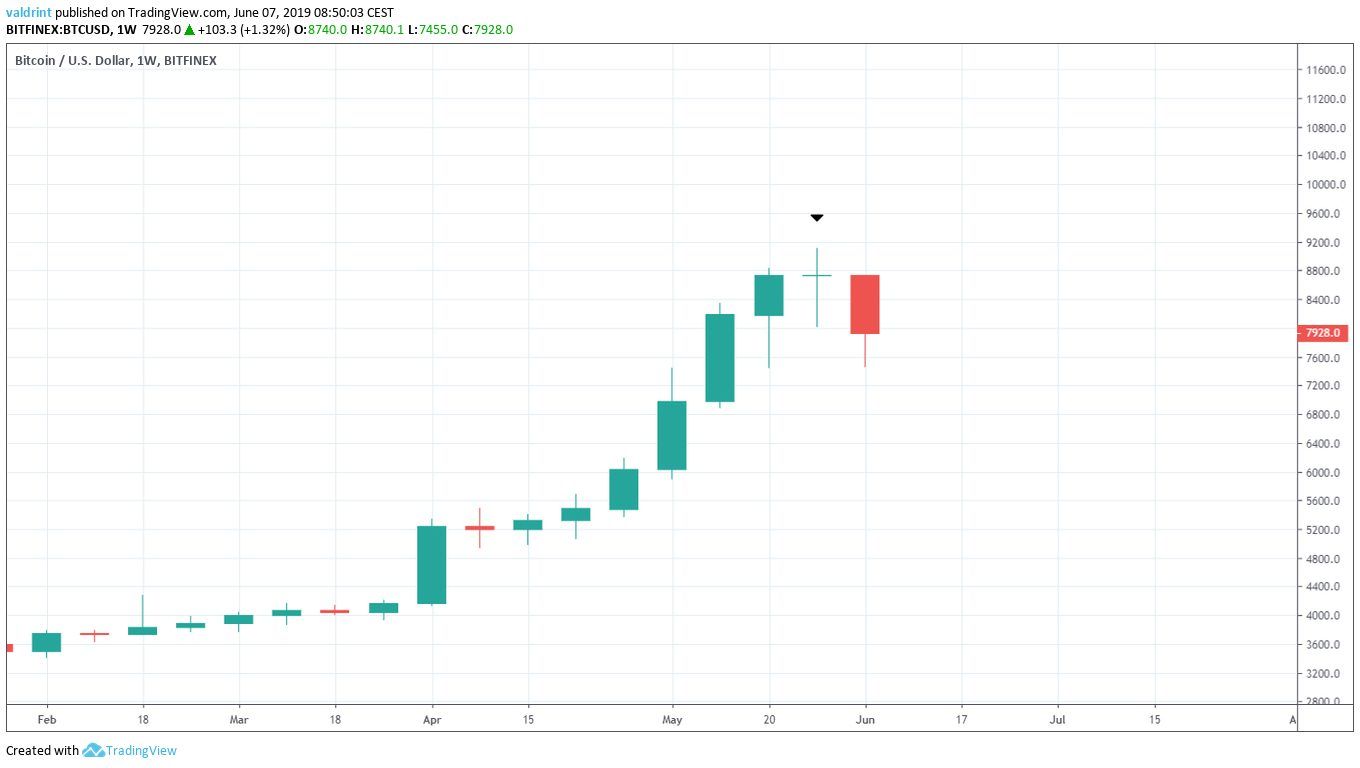
The price is currently in the process of creating the third candle. A close below $7500 would validate this pattern.
Future Movement
One support area for BTC/USD is traced in the graph below. It is used to determine future areas of reversal. In the case of BTC, we will use it to find a possible bottom for our fifth wave.
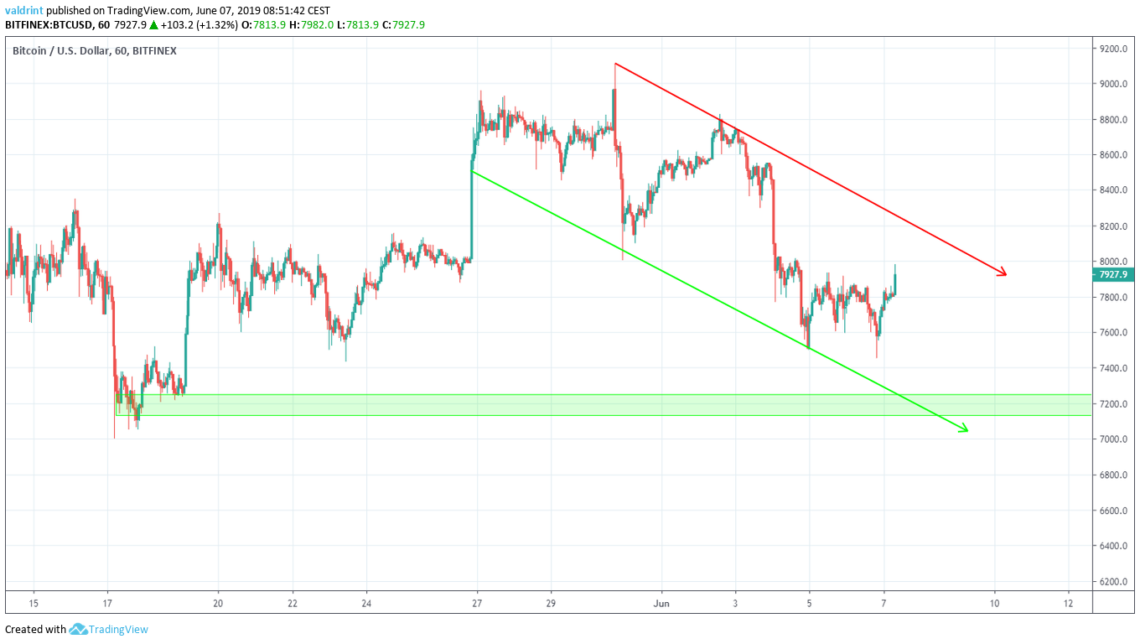
The closest support area is found near $7200. If the price continues to decrease at the rate predicted by the channel, it is likely to reach this area on Jun 10, at the latest.
Summary
Bitcoin (BTC) is trading inside a descending channel. The recent upward move beginning on Jun 7 is likely the fourth wave in a five-wave Elliott formation. The Bitcoin Price is facing resistance from moving averages. In a weekly timeframe, it is creating a bearish reversal candlestick pattern.
Do you think the Bitcoin price will reach the resistance line of the channel? Let us know in the comments below.
Disclaimer: This article is not trading advice and should not be construed as such. Always consult a trained financial professional before investing in cryptocurrencies, as the market is particularly volatile.


