


Bitcoin’s (BTC) monthly RSI suggests a bottom will be reached in the near future. The wave count supports a slightly lower low prior to a reversal.
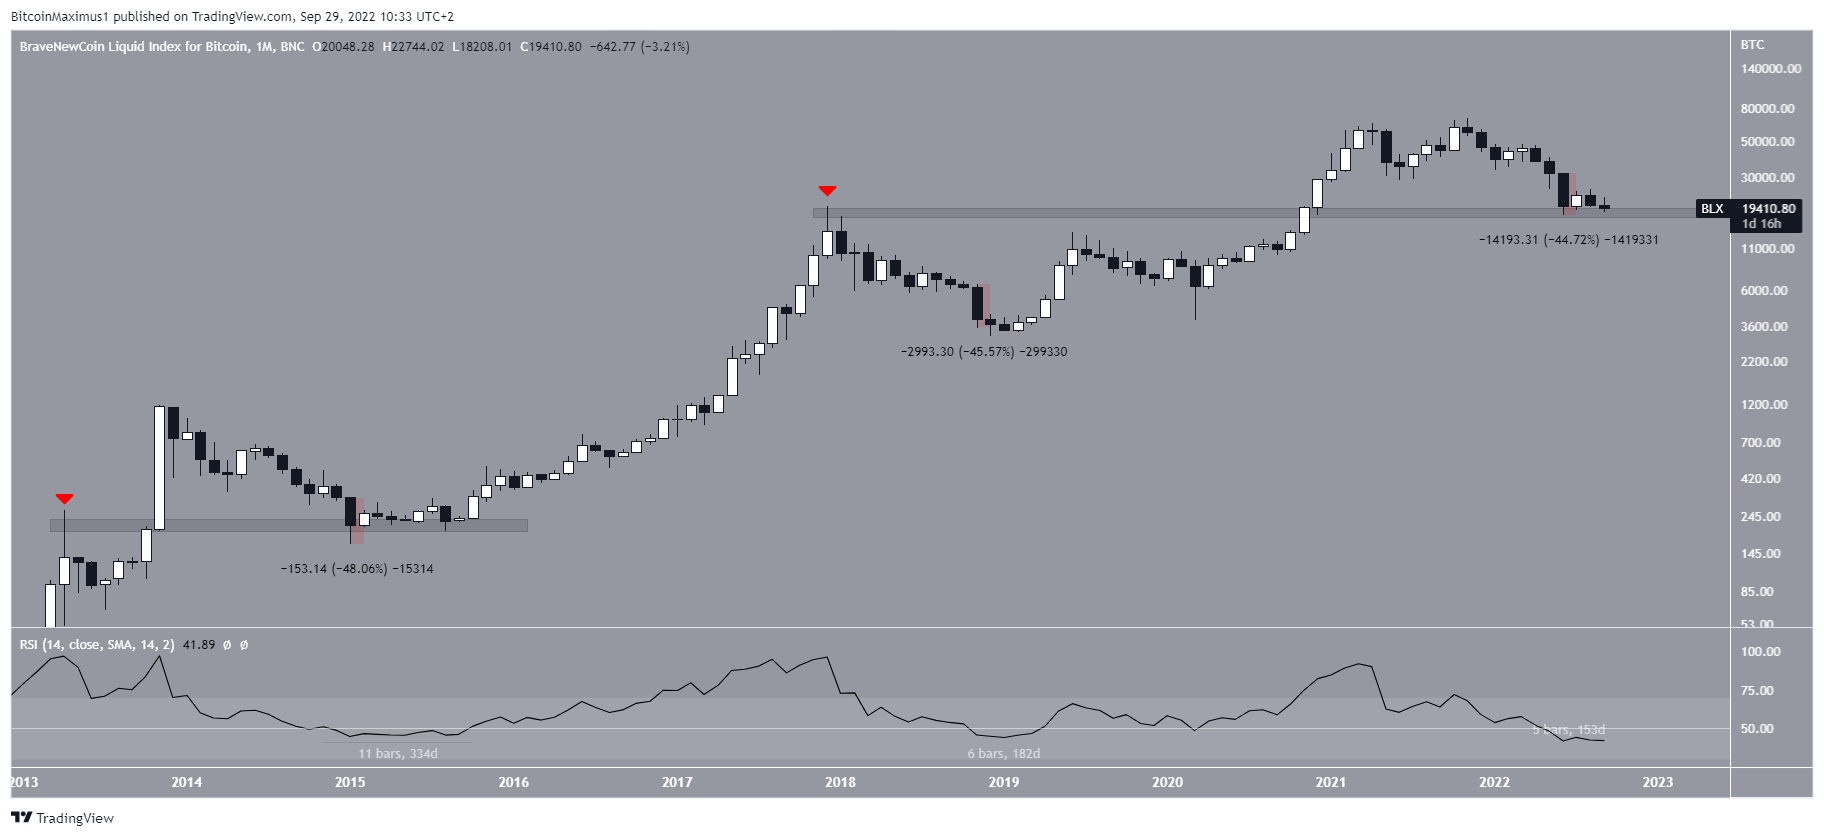
BTC has been falling since reaching an all-time high price of $68,944 in Nov. The downward movement has so far led to a low of $17,607 in June 2022 before bouncing.
The current price movement is extremely similar to that in 2015, since both times the price has bounced at the previous wick all-time high (red icons).
Another interesting similarity between the two previous market bottoms and the current one is the preceding bearish engulfing monthly candlestick.
In both cases, a candlestick with a magnitude close to 46% led to the bottom. Afterward, a very gradual upward movement began, which eventually accelerated.
In the current decrease, the June candlestick had a magnitude of 45%.
Well-known BTC investor and creator of the Stock-To-Flow model @100trillionUSD noted that the monthly RSI is at an all-time low.
When looking at the period of time in which the RSI stayed below 50, it has done so by:
- 2015 – 334 days
- 2019 – 182 days
- 2022 – 153 days
While the current period is the shortest one, even if BTC were to reverse, it would likely take the RSI more than one month to cross back above 50. Additionally, it is worth mentioned that the RSI bottom was reached after 62 and 91 days in 2015 and 2019 respectively. The current RSI bottom was reached after 61 days.
When combined with the large monthly bearish candlestick, these readings suggest that a bottom has either already been reached or will be reached soon.
Will support break after six touches?
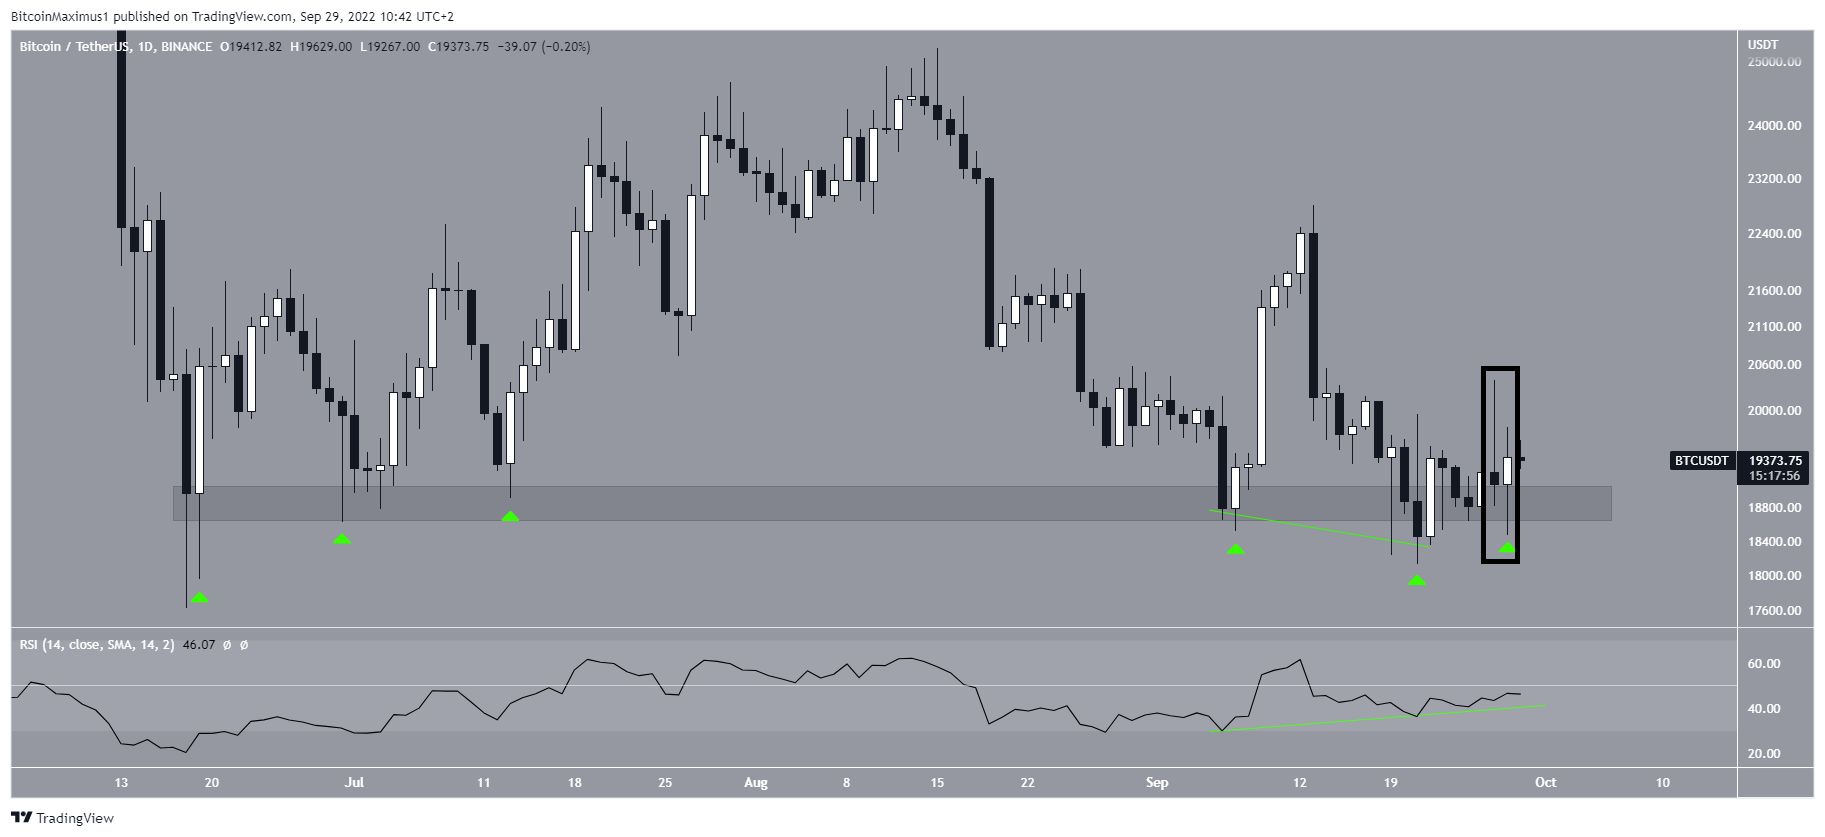
The daily chart shows that BTC has been hovering above the $19,000 support area since the June 18 bottom. It has touched the area six times and deviated below it twice.
More recently, it created a bullish hammer candlestick on Sept. 28, somewhat negating the bearishness from the previous day’s bearish candlestick (black)
The price action and technical indicator readings are not in alignment. Since areas get weaker each time they are touched, an eventual breakdown from this area would seem to be the most likely scenario.
However, the daily RSI has generated bullish divergence (green line) and its trend line is still intact.
So, readings from the daily time frame fail to confirm the direction of the future movement.
But downside seems more likely
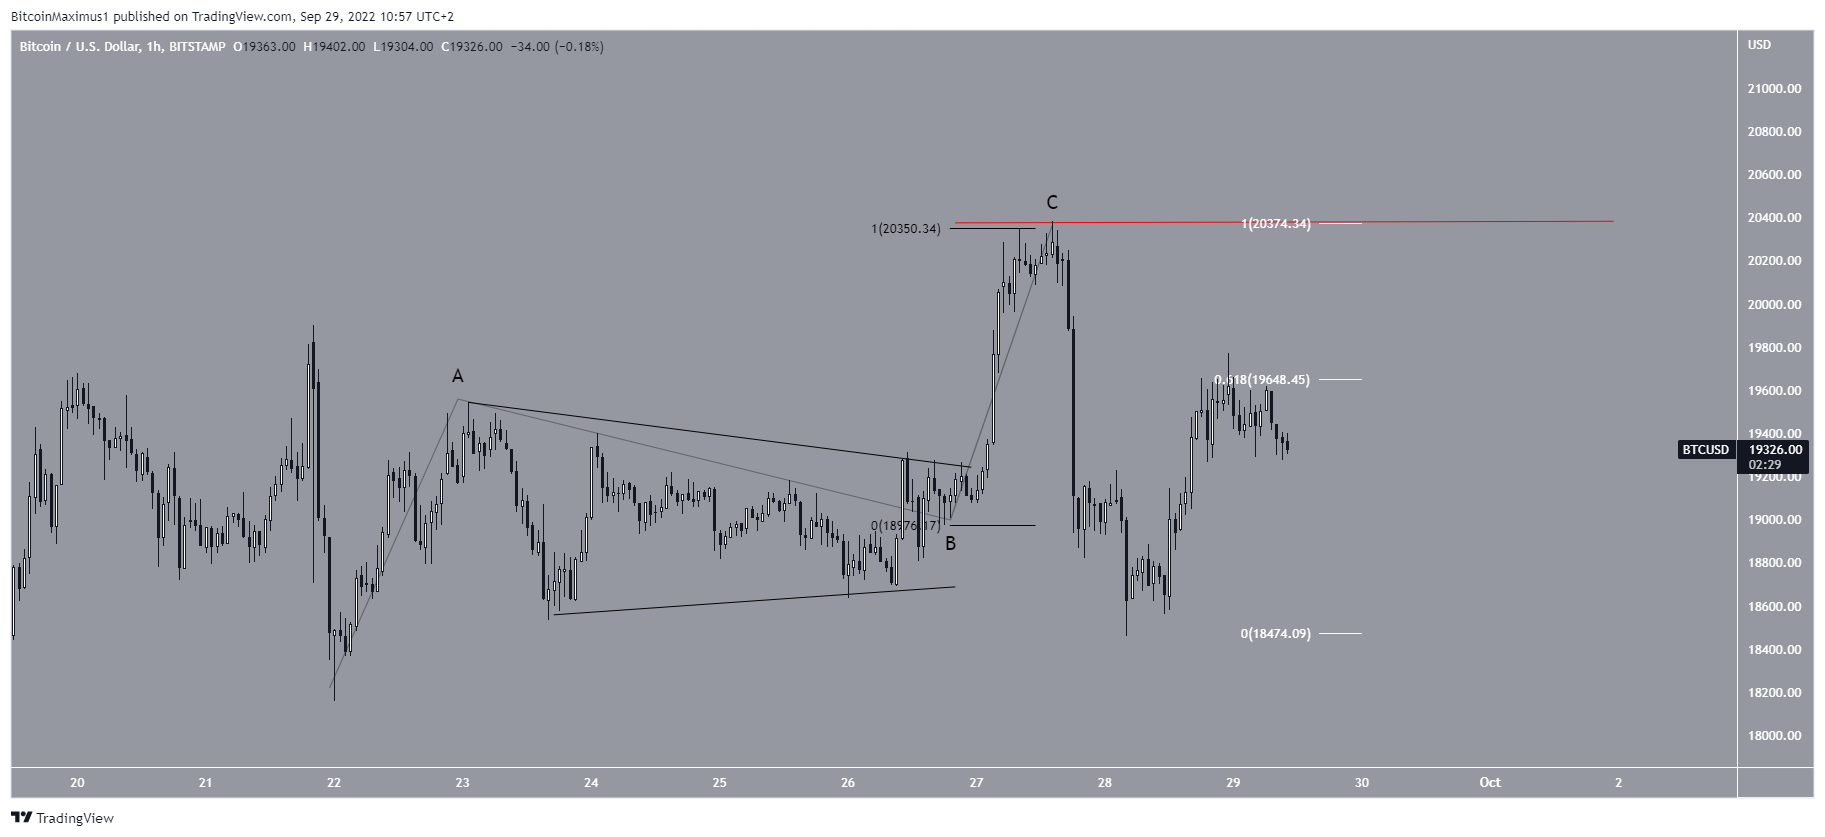
An analysis of the wave count indicates that more downside is likely. The main reason for this is the completed A-B-C corrective structure in which wave B took the shape of the triangle and waves A:C had an exactly 1:1 ratio.
Additionally, the ensuing downward movement looks impulsive (highlighted) and the following bounce was rejected at the 0.618 Fib retracement resistance level (white).
Therefore, this indicates that more downside is likely and BTC will break down from the $19,000 support area.
An increase above the wave C high at $20,381 would invalidate this potential wave count and suggest that the price will increase towards new highs instead.
For Be[In]Crypto’s latest Bitcoin (BTC) analysis, click here


