


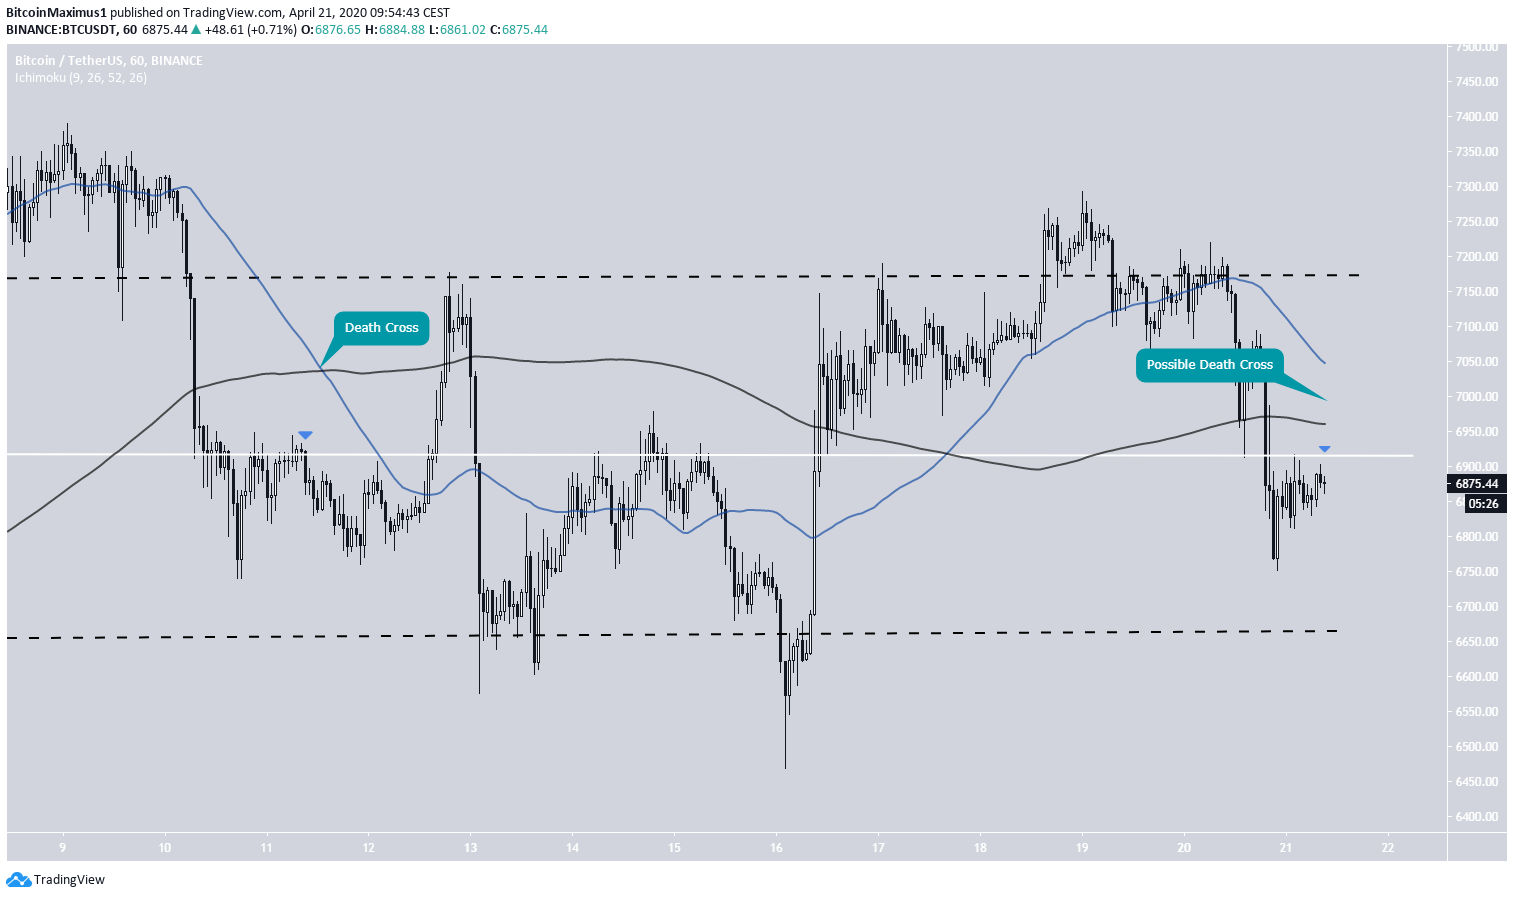
The price of BTC decreased considerably on April 20. While it initially reached a high of $7,220, the price began a rapid downward move shortly after, reaching a low of $6,751.
Yesterday’s decrease caused the price to fall back within the $7,150-$6,650 trading range. While it initially found some support above the midpoint of the range, it fell below afterward. The bearishness is strengthened by the possible bearish cross between the 50 and 200-period moving averages (MA), otherwise known as a death cross.
Bitcoin Backs Off
An almost identical movement occurred on April 11. The price had increased above the resistance of the range, only to fall back inside it shortly afterward. After the death cross occurred, the price moved upwards all the way to the resistance line, only to drop sharply afterward.
If the same movement transpires this time around, the BTC price would increase and touch the resistance line only to fall towards support afterward.
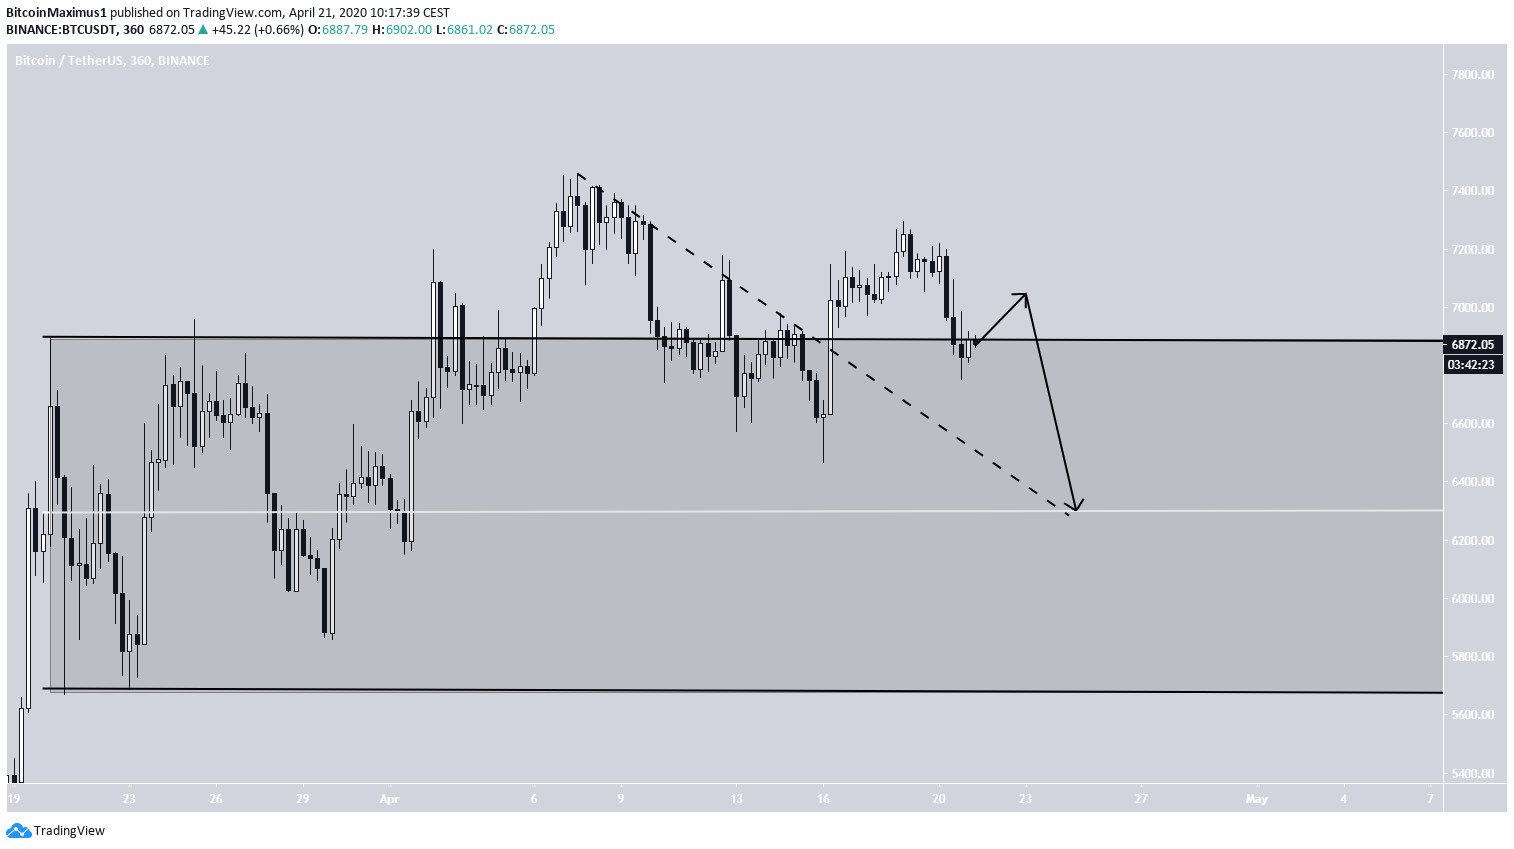
Trading Range
The decrease has also caused the price to fall inside the next trading range, which is found between $5,700-$6,900. At the time of publishing, the price was trading very close to the resistance line of this range.
In addition, we can see a descending resistance line (dashed) that the price has broken out of. If the movement outlined in the previous section transpires, the price should fall and validate the midpoint of the range along with the descending resistance line within the next few days.
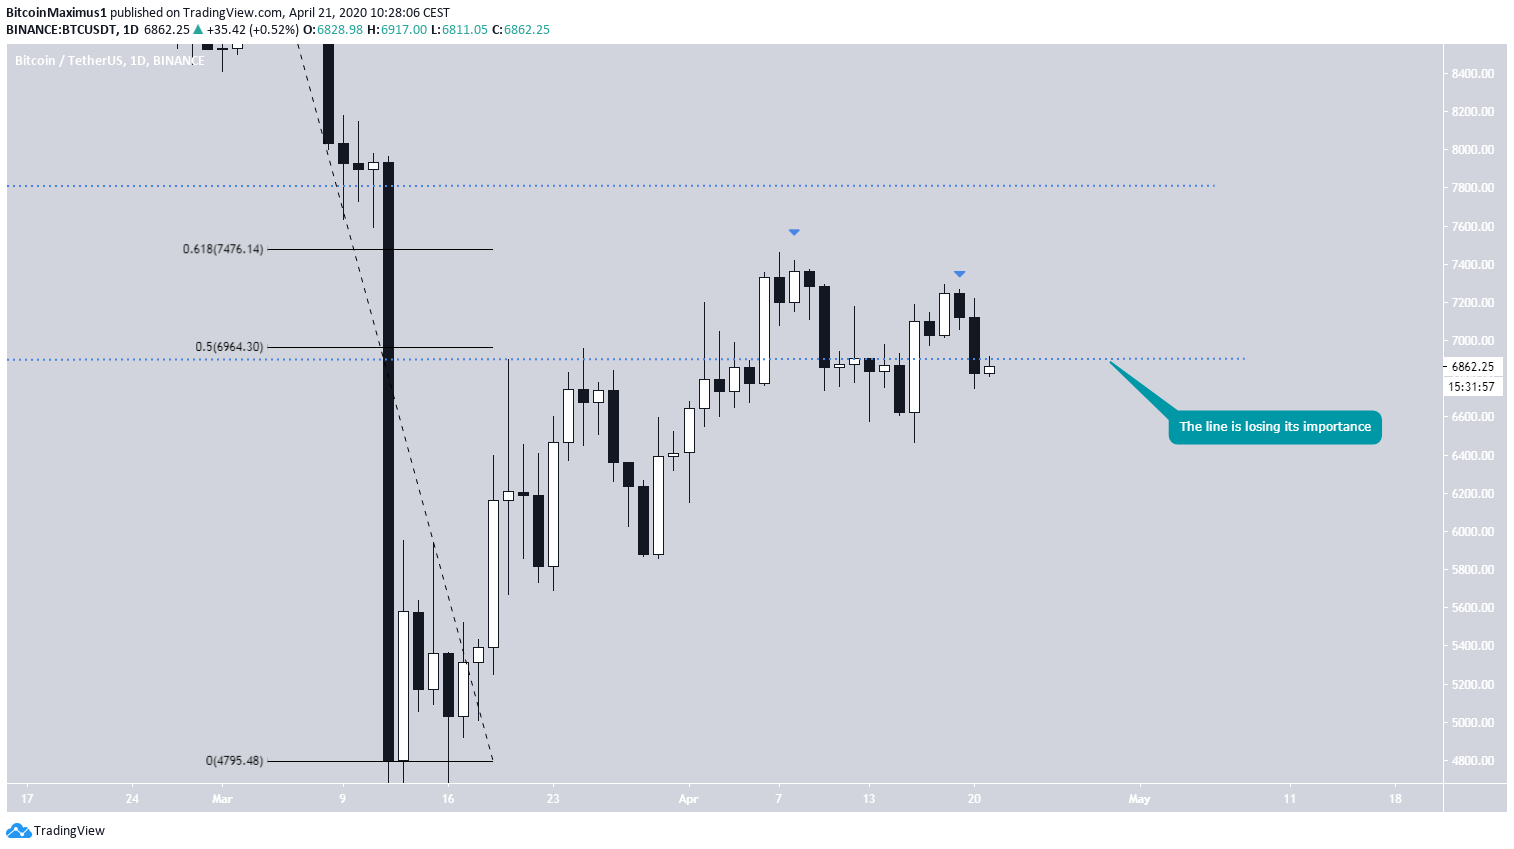
Daily Outlook
In the daily time-frame, the price has once more fallen below the $6,900 level, which initially acted as resistance and then as support after. This is making the level irrelevant, since the price is not reacting to it.
The price has now clearly made its first lower-high, which might indicate that a bearish trend has begun, aligning with the analysis from lower time-frames.
To conclude, the Bitcoin price decreased considerably on April 20, falling back within its trading range. The price is expected to decrease towards the support of the range and possibly break down. An initial short-term upward move is not ruled out, but a breakout seems unlikely.
For those interested in BeInCrypto’s previous Bitcoin analysis, click here.


