


In the late hours of June 10, the Bitcoin price made an attempt at breaking out from the current resistance area to reach a high of $9,981.
However, it failed to sustain the higher prices and has been decreasing since, returning to the breakout level.
Bitcoin Breakout Attempt
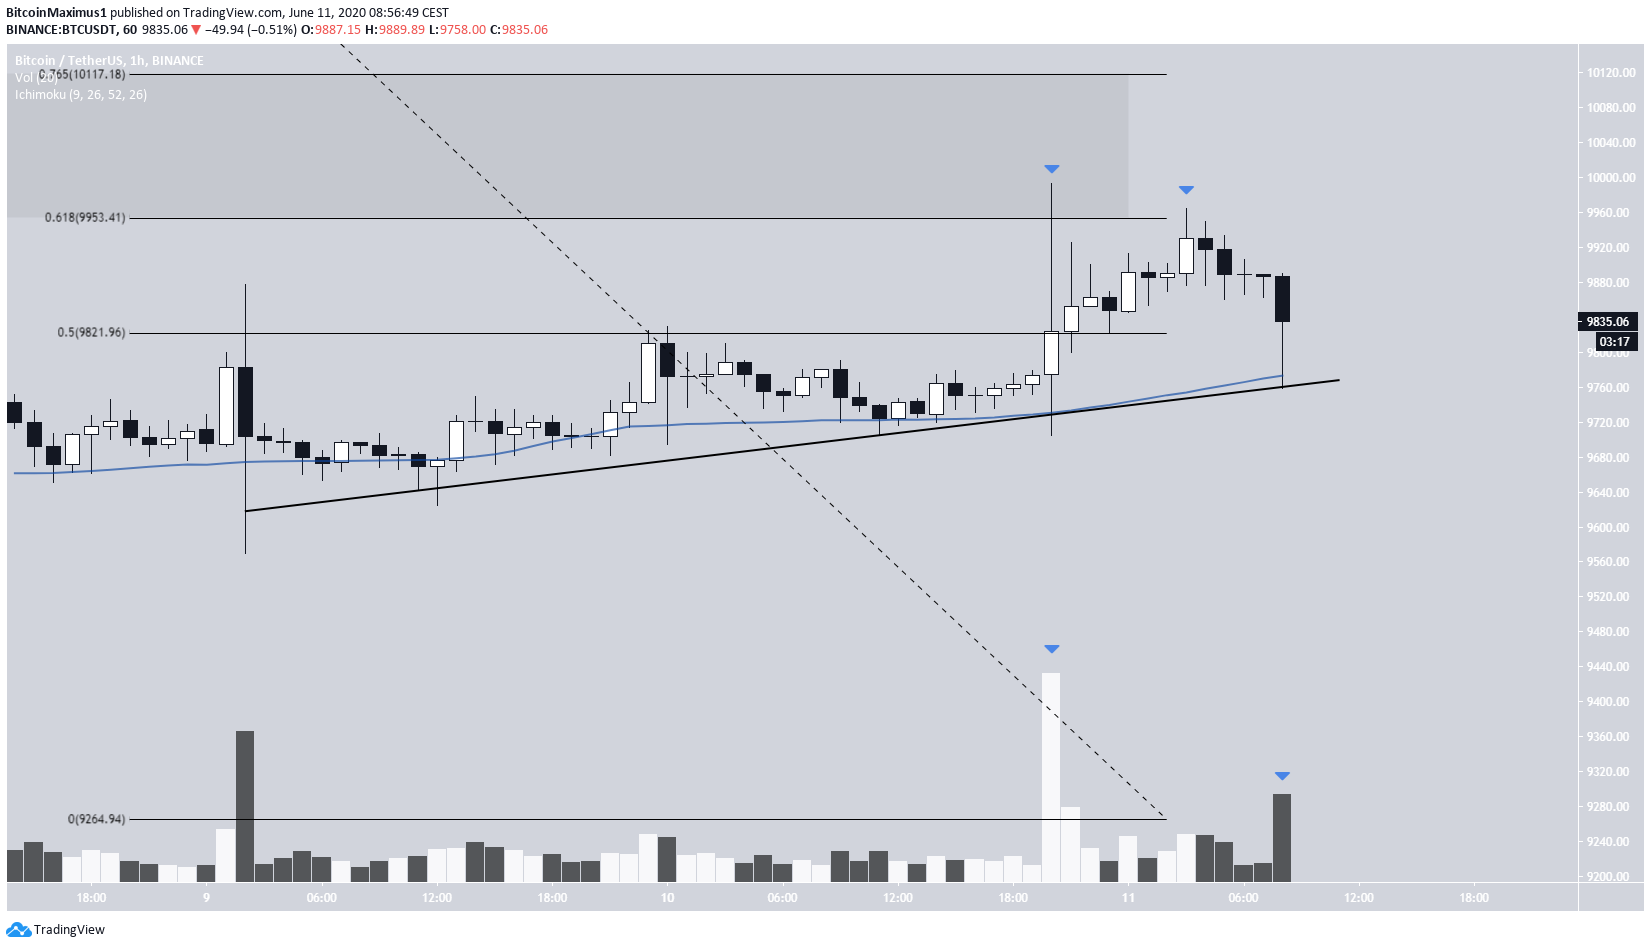
On June 10, the Bitcoin price made its fourth attempt in recent times at breaking out above $9,820, the 0.5 Fibonacci level of the previous downward move. The price was finally successful in doing so, increasing and reaching a local high of $9,981. However, it was met with considerable selling pressure between the 0.618-0.765 Fib level at $9,950-$10,100, creating a long upper-wick in the process.
Afterwards, the price made another attempt at moving above this resistance area, but failed to reach the same high and has been decreasing since. The rate of decrease alongside volume has picked up considerably during the last hour.
On a bullish note, the price is following a short-term ascending support line, which is strengthened by the presence of the 50-hour MA and has seemingly bounced above it. As long as the price stays above this line and the MA, it is expected to make another attempt at breaking out.
Possible Correction
A slightly longer-term view reveals a possible ascending wedge for BTC, which is considered a bearish reversal pattern. If the pattern plays out, the price would likely break down and head towards $9,450.
The pattern would be confirmed with a higher-high at $10,000, which would serve to validate the resistance line once more, along with the previously mentioned resistance area. If this potential high is combined with a bearish divergence in the RSI, it would all but confirm the ensuing breakdown, taking the price to $9,450.
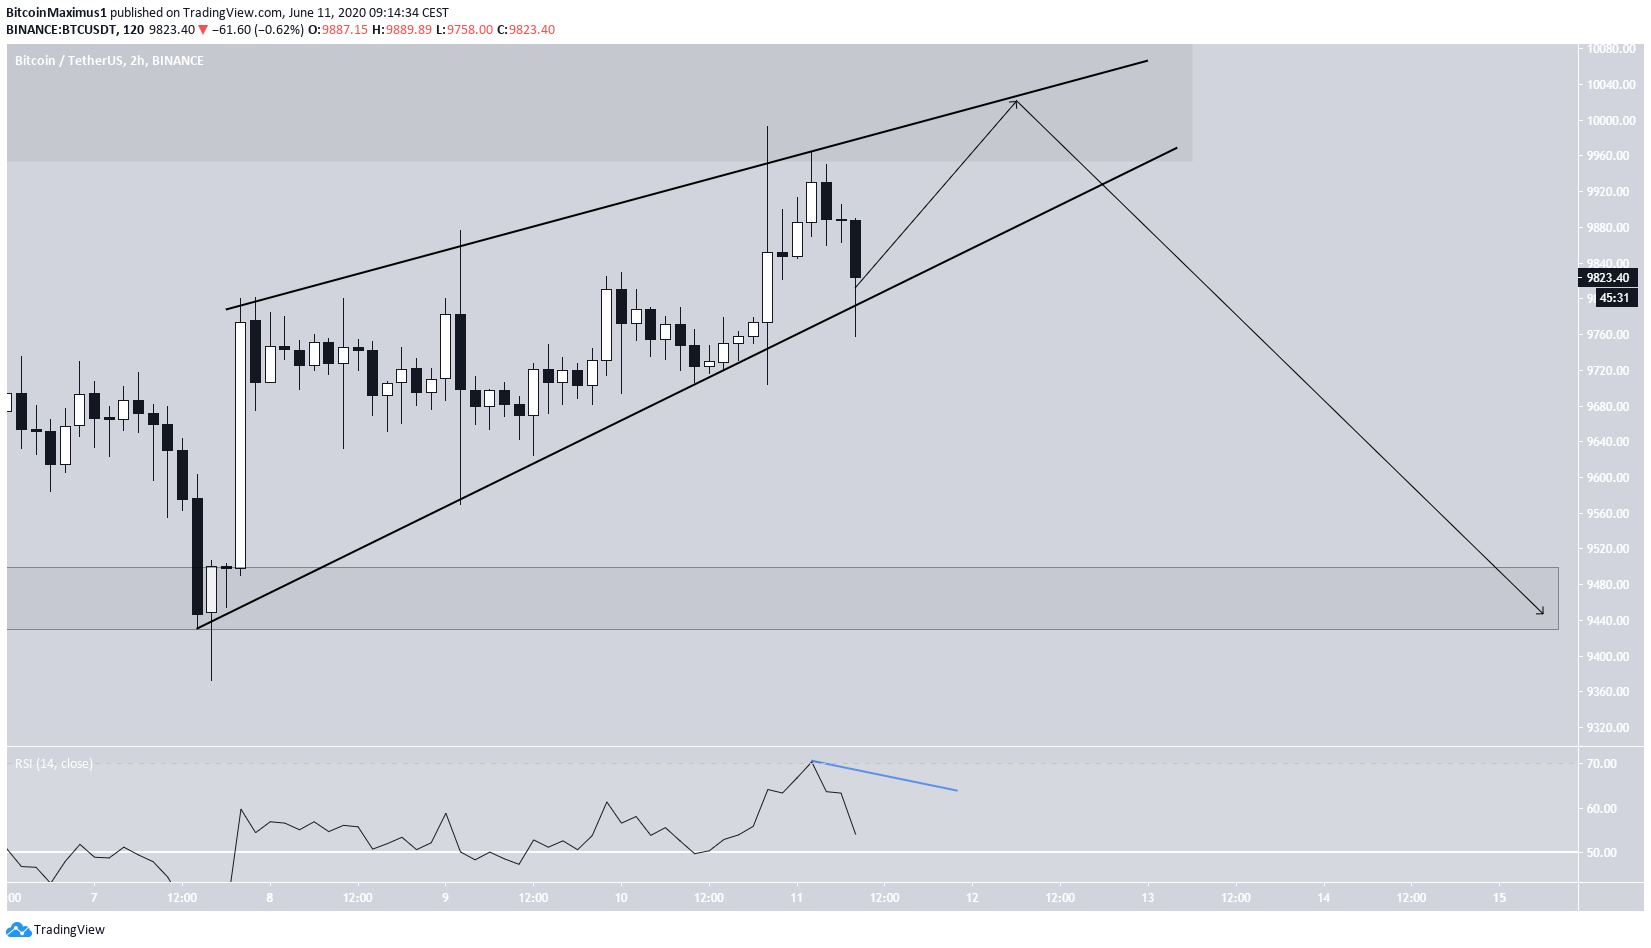
To conclude, the Bitcoin price made an attempt at moving above $10,000, but was swiftly rejected. It is possibly trading inside an ascending wedge, a breakdown from which would take it to $9450.
For our previous analysis, click here.


