


The Bitcoin (BTC) price increased slightly on June 8, creating a tiny inverted hammer candlestick. The next day, it began an upward move, with a false breakout above important resistance at $9,825.
BTC was immediately pushed back from the advance, creating an hourly bearish engulfing candlestick with long wicks on either side. The price is currently trading inside a parallel descending channel.
Price Rejection
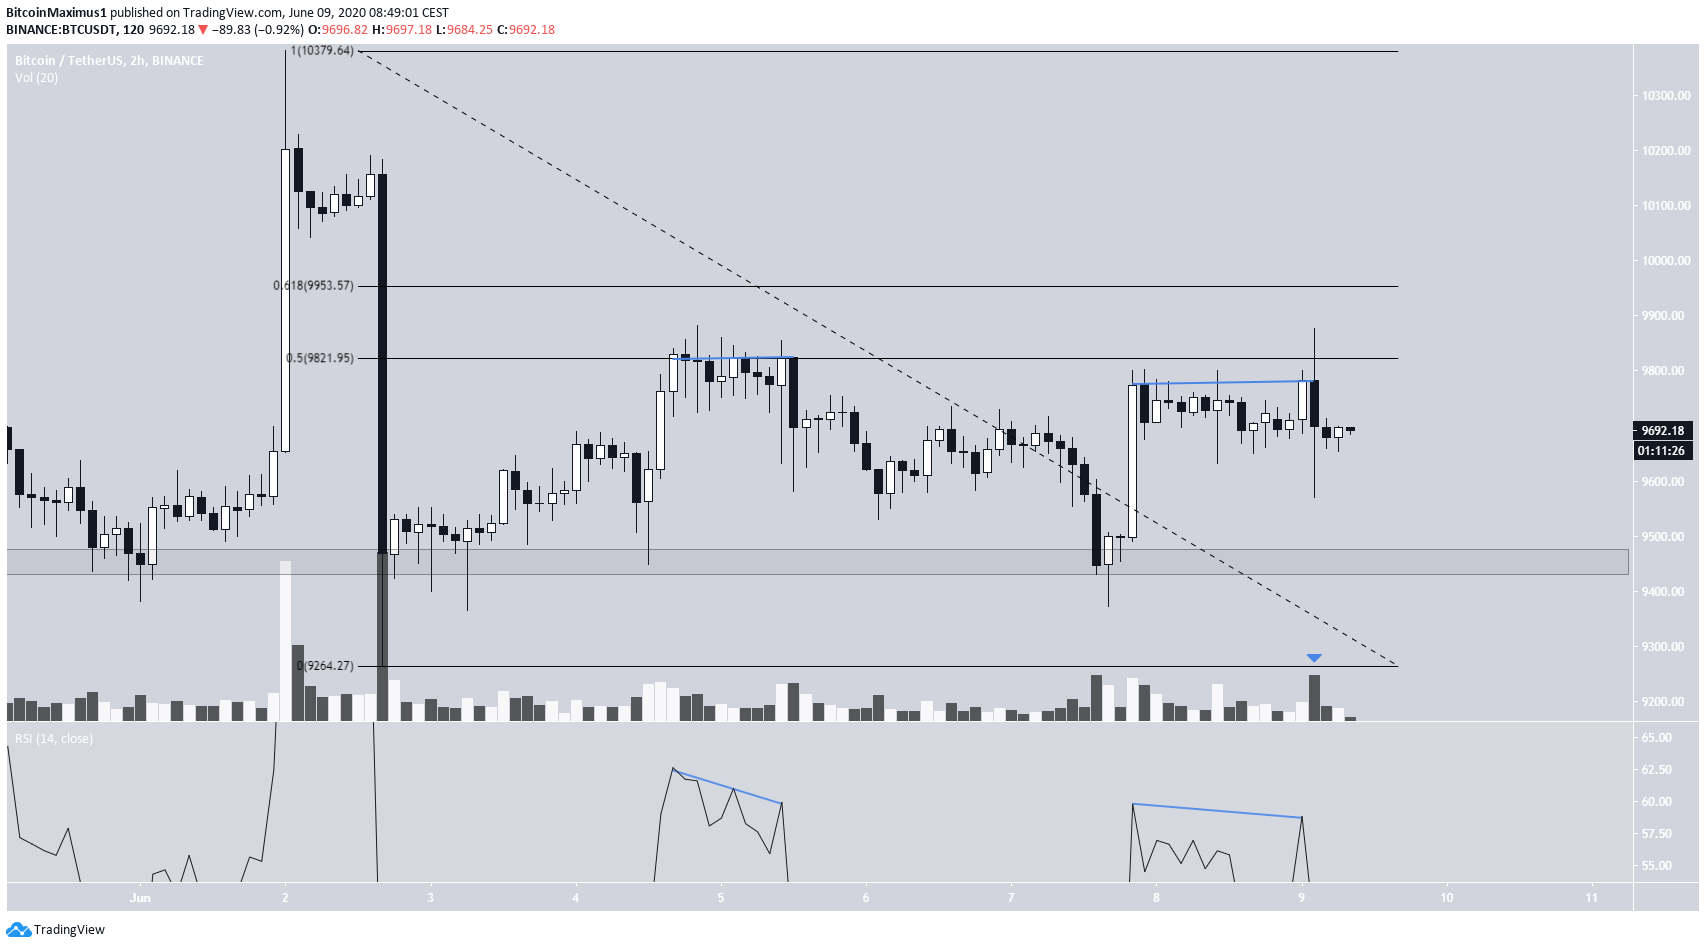
Bitcoin made another attempt at breaking out above the $9,825 resistance area, which is the 0.5 Fib level of the entire decline that began on June 1. However, it subsequently created a bearish engulfing candlestick with long wicks on either side. The move was made on considerable volume, the highest hourly volume since the rapid decline on June 1, in fact.
The double top pattern created at this level eerily resembles the price movements from June 4, where a gradual decrease towards the $9,450 support level took place. Furthermore, both patterns display bearish divergence on the hourly RSI, increasing the chances of a downward move.
If so, the price is likely to decrease all the way down to the $9,450 support area again.
Parallel Descending Channel
In the very short-term, the Bitcoin price is trading inside a parallel descending channel. Even though the price briefly moved above the resistance line of this channel, creating a long upper wick above, it immediately fell back inside and has been trading there since.
In addition, the long lower wick touched the 0.5 Fib level and caused an upward bounce, a bullish sign.
The most likely scenario would be a decline inside the confines of the channel until the 0.5 Fib level at $9,570 – after which it should bounce and then break out. However, if the $9,570 area fails to support the price, BTC will likely drop down to the $9,450 area.
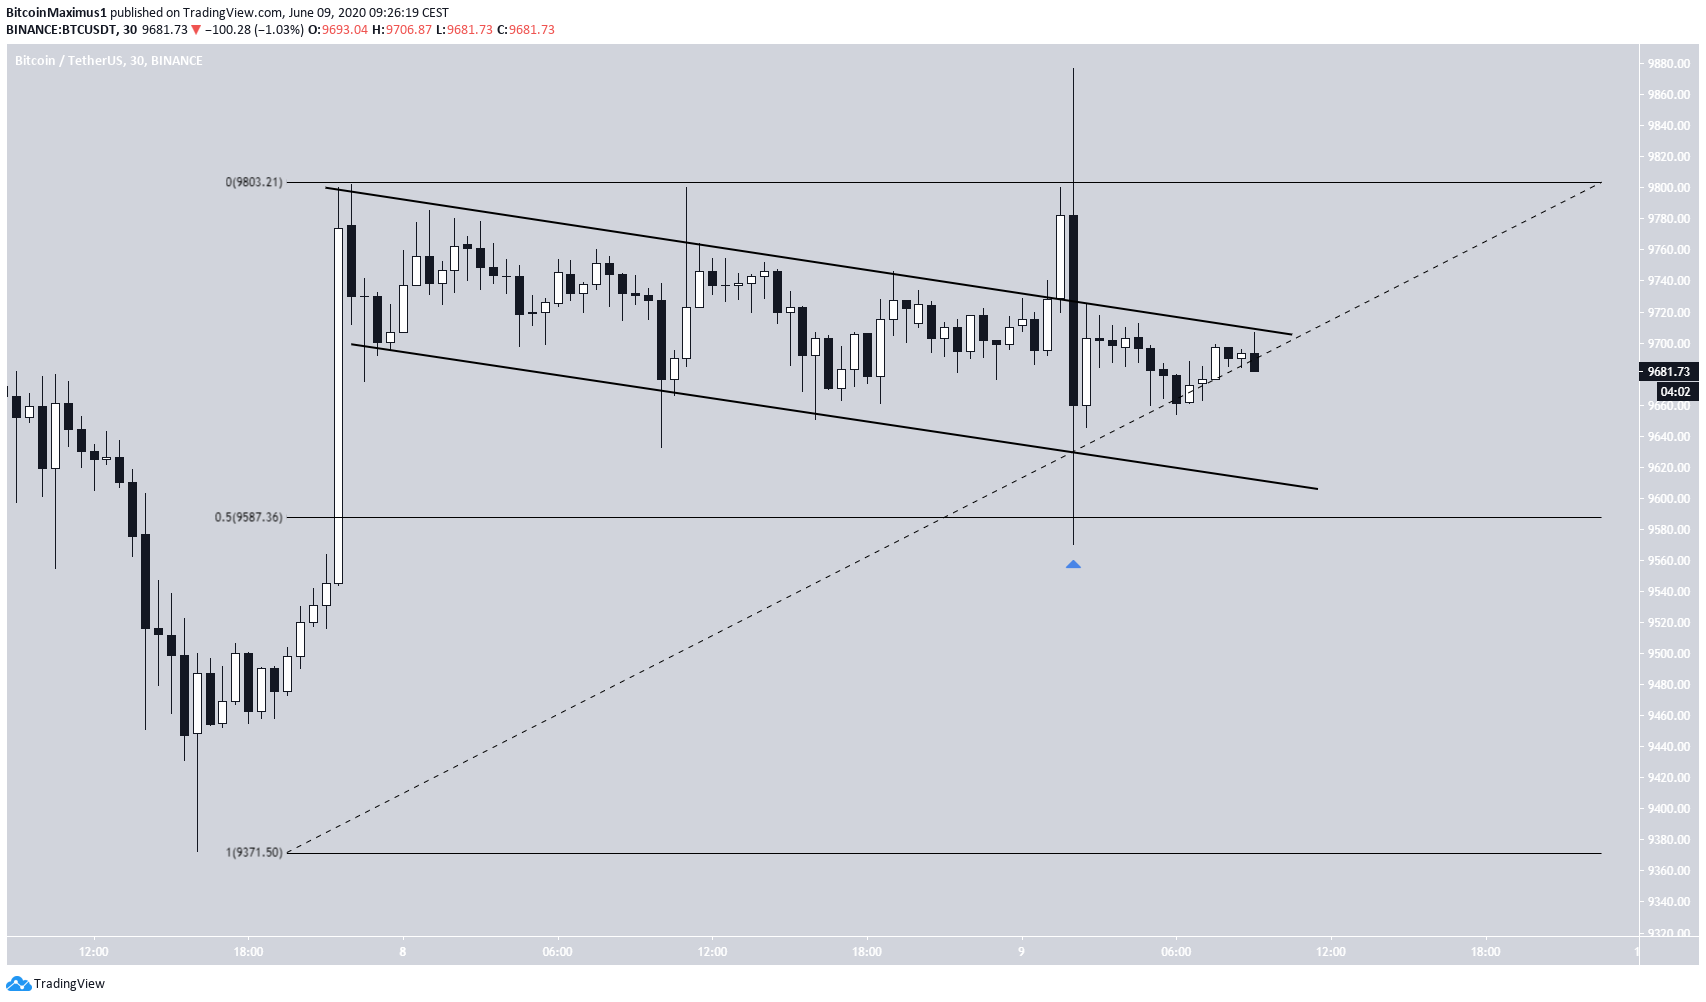
To conclude, the Bitcoin price is trading inside a parallel descending channel. The most likely scenario is a bounce at $9,580 – followed by another attempt at breaking out above $9,800. If the $9,580 area fails, BTC is expected to decline down to $9,450.
For our previous analysis, click here.



