


The Bitcoin (BTC) price is trading slightly below a crucial support area at $9,250. The price has been trading near this level for the past five days but has failed to initiate a bounce.
At the time of writing, the price was in the process of breaking down from a parallel ascending channel.
Bitcoin Long-Term Support
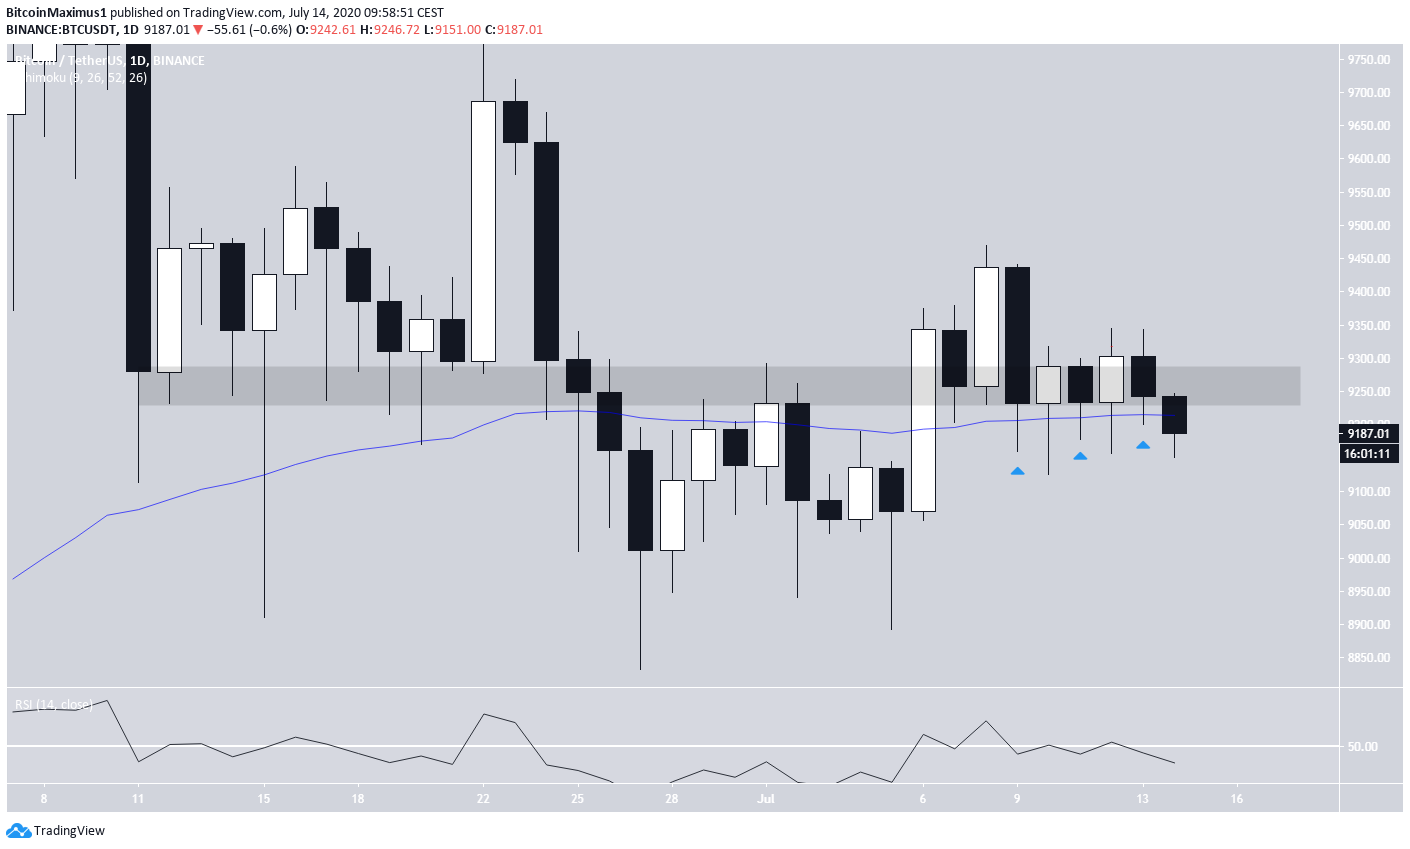
The Bitcoin price is currently trading slightly below the $9,250 support area and the 50-day moving average (MA). The same MA and support area have been providing support to the price since July 7.
At the time of writing, BTC was in the process of breaking down from this support area, along with the MA. However, the daily close is far from being reached, so it is possible that BTC creates a long lower-wick and bounces upwards, similar to the candlesticks of the past five days.
The daily RSI has been rejected by the 50-line and is in the process of moving downwards—a bearish sign.
Ascending Channel
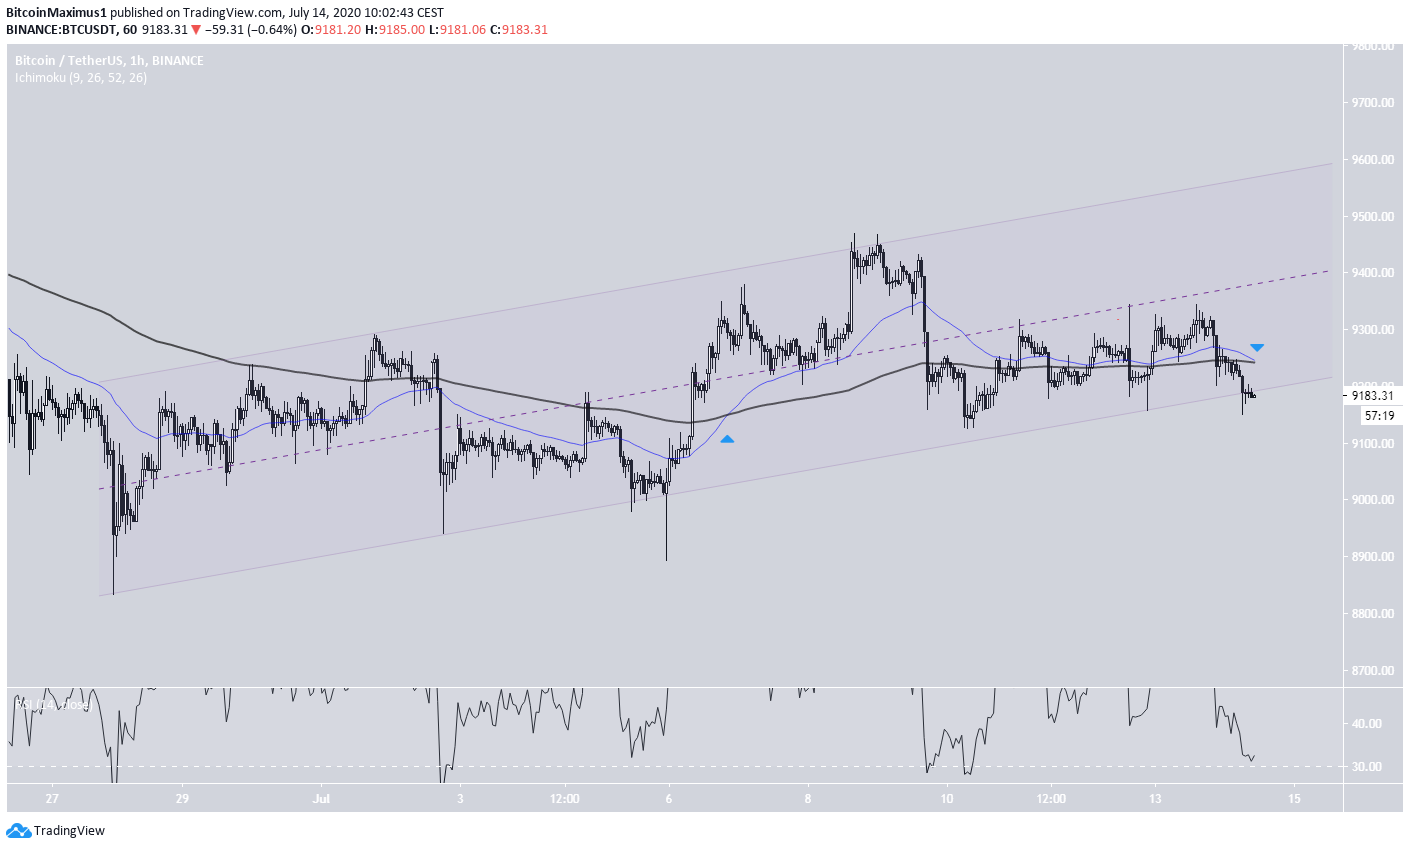
The hourly chart shows that the price is trading inside a parallel ascending channel, and has been doing so since June 28. Parallel channels often contain corrective movements, so a breakdown from this pattern wouldn’t be surprising.
At the time of writing, the price was trading right at the support line of the channel, having created a few long lower-wicks below it.
The 50 and 200-hour MAs have made a bearish cross and both are providing resistance to the price. The previous bullish cross between these same MAs transpired on July 6, so this bearish cross could indicate that the price has completed its upward move.
Future Movement
If the price were to break down, the next closest support areas would be found at $8,950 and $8,650. While it looks that the price will reach the first support, the reaction once it gets there should help determine if BTC is expected to decrease further towards the lower support or will make a bounce.
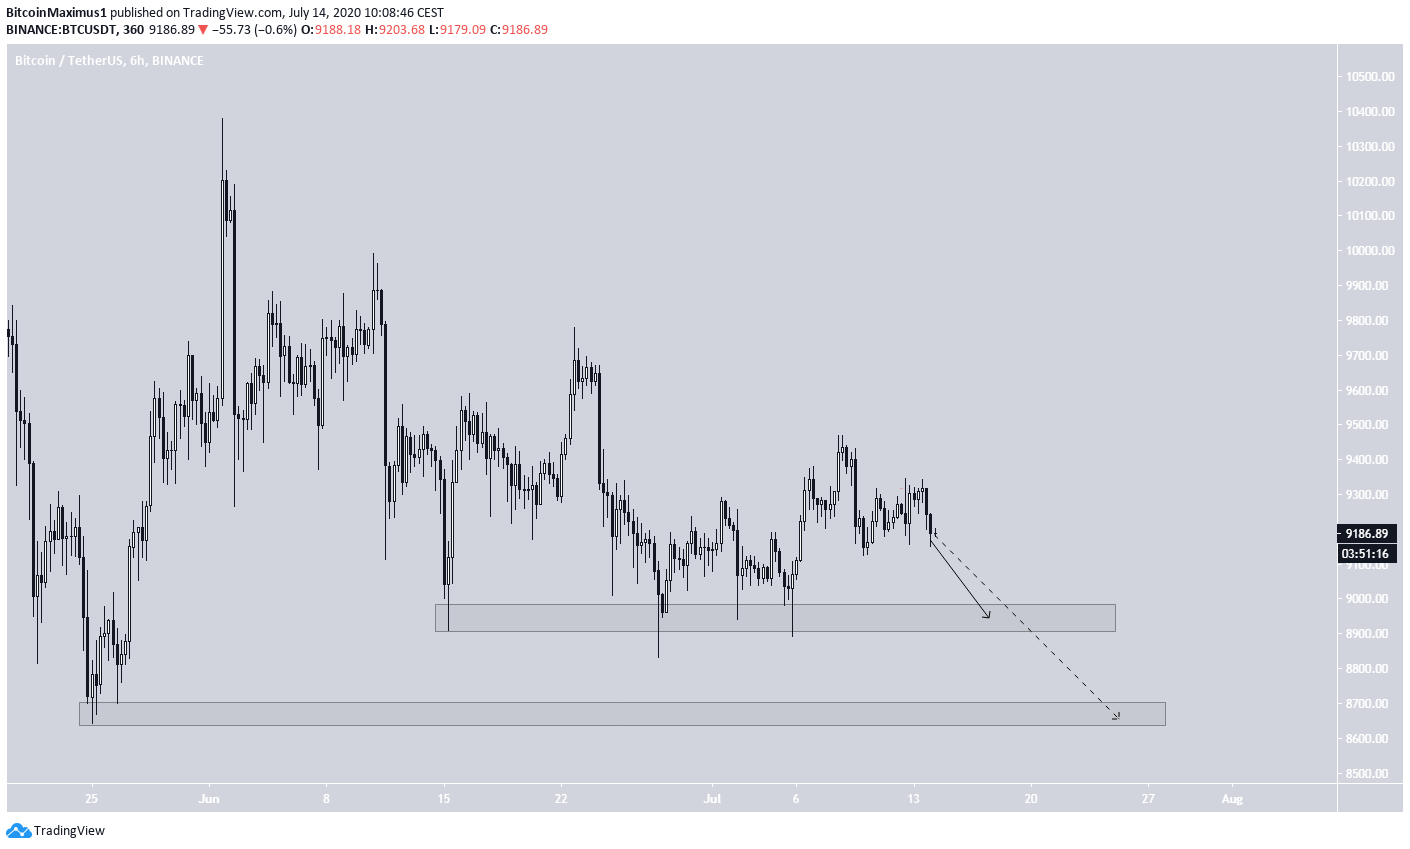
To conclude, the BTC price is expected to break down from its current ascending channel and move towards the lower support areas outlined above.
For our previous analysis, click here.


