


On Sept 20, the Bitcoin (BTC) price was rejected at a critical fib level and dropped sharply the next day.
If the price manages to hold on above $10,100, the possibility of bullish continuation remains.
Bitcoin Rejected at Important Fib Level
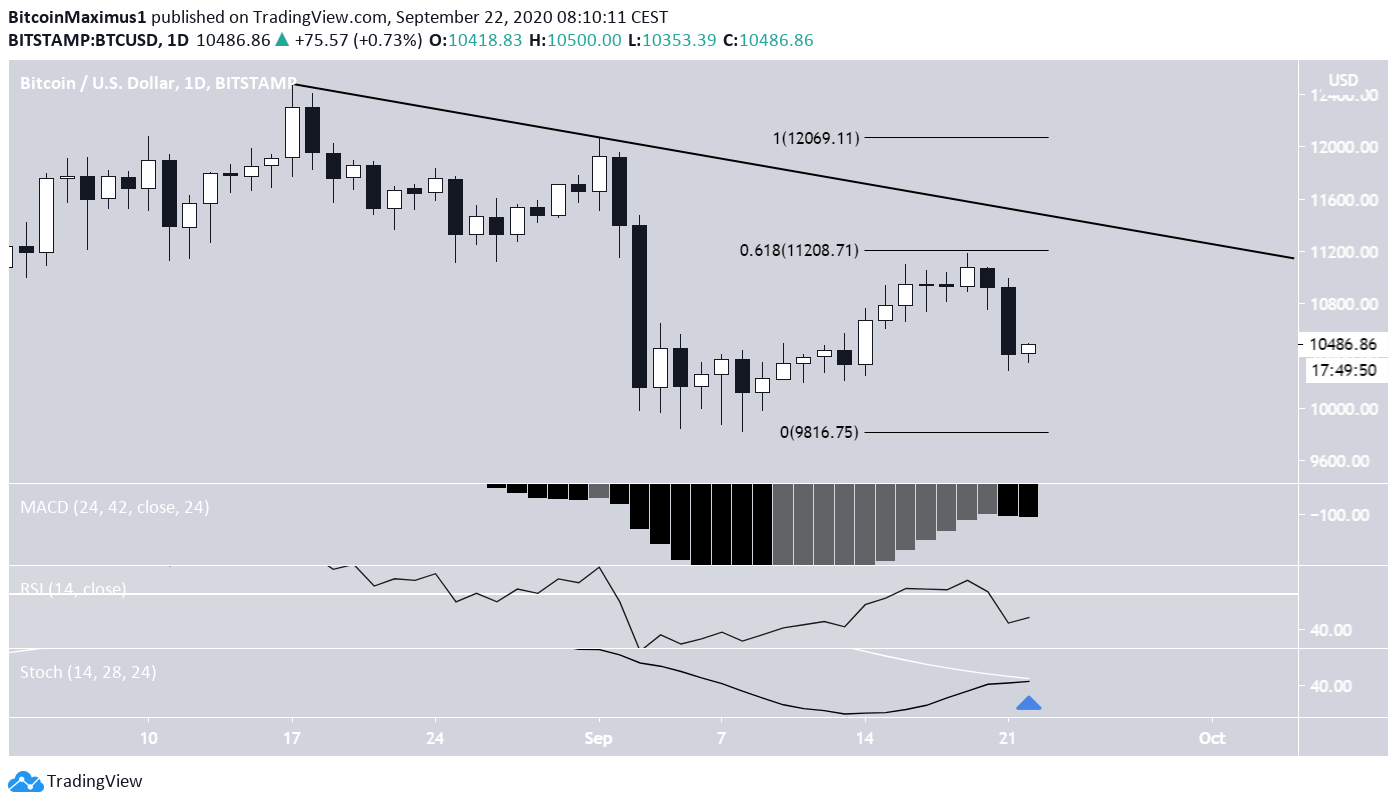
The Bitcoin price reached a local high of $11,183 on Sept 19. The high was very close to the 0.618 Fib level of the previous increase. The price was rejected shortly afterward and created a bearish engulfing candlestick on Sept 22.
The fact that the price has yet to reach the descending resistance line drawn from the two most recent lower-highs makes it possible that the movement is still a correction in response to the prior decrease.
Technical indicators are undecided. The MACD has possibly begun to fall, and the RSI has dropped below 50. However, the Stochastic Oscillator is still on track to make a bullish cross.
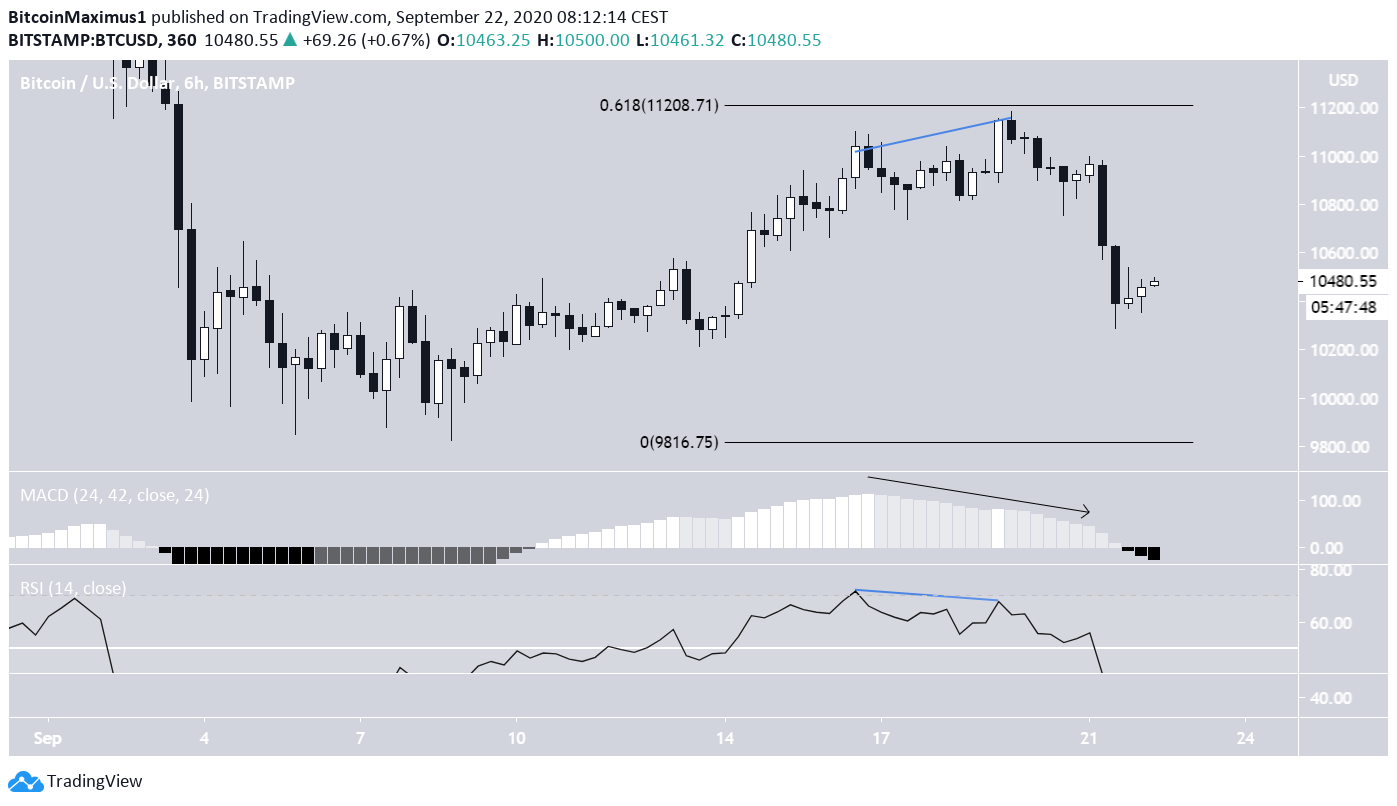
A look at the 6-hour chart shows that the decrease was preceded by considerable bearish divergence in the RSI. Also, the MACD has lost all strength and has already turned negative.
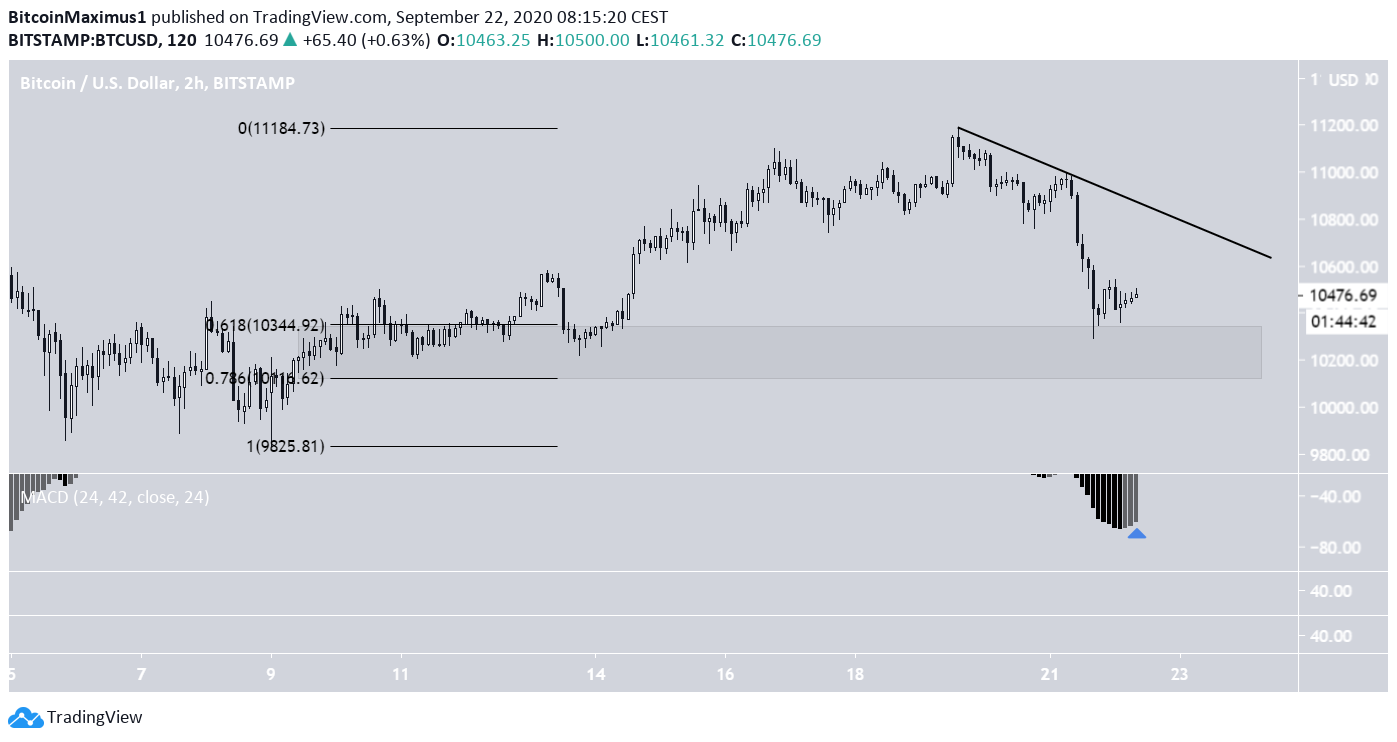
BTC has seemingly found support and bounced above the 0.618 Fib level of the entire upward move. The 0.618-0.786 levels between $10,116-$10,344 are vital to act as support. A decrease below this zone would likely send the price to a lower-low relative to its Sept 4 prices
However, there are no clear reversal signs besides the increasing MACD. A breakout above the possible short-term descending resistance line would indicate that the price is likely to head higher. On the other hand, a breakdown below the support area would likely take the price towards $9,700.
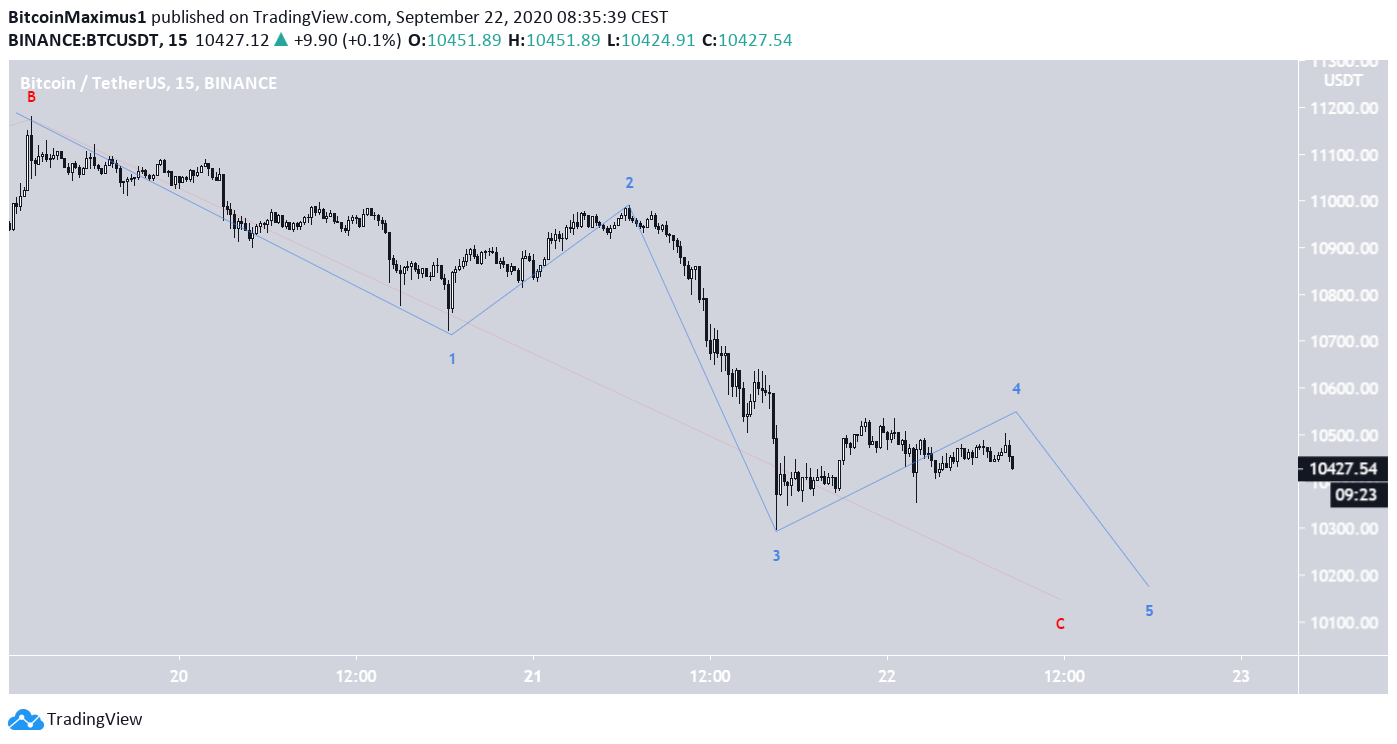
Wave Counts
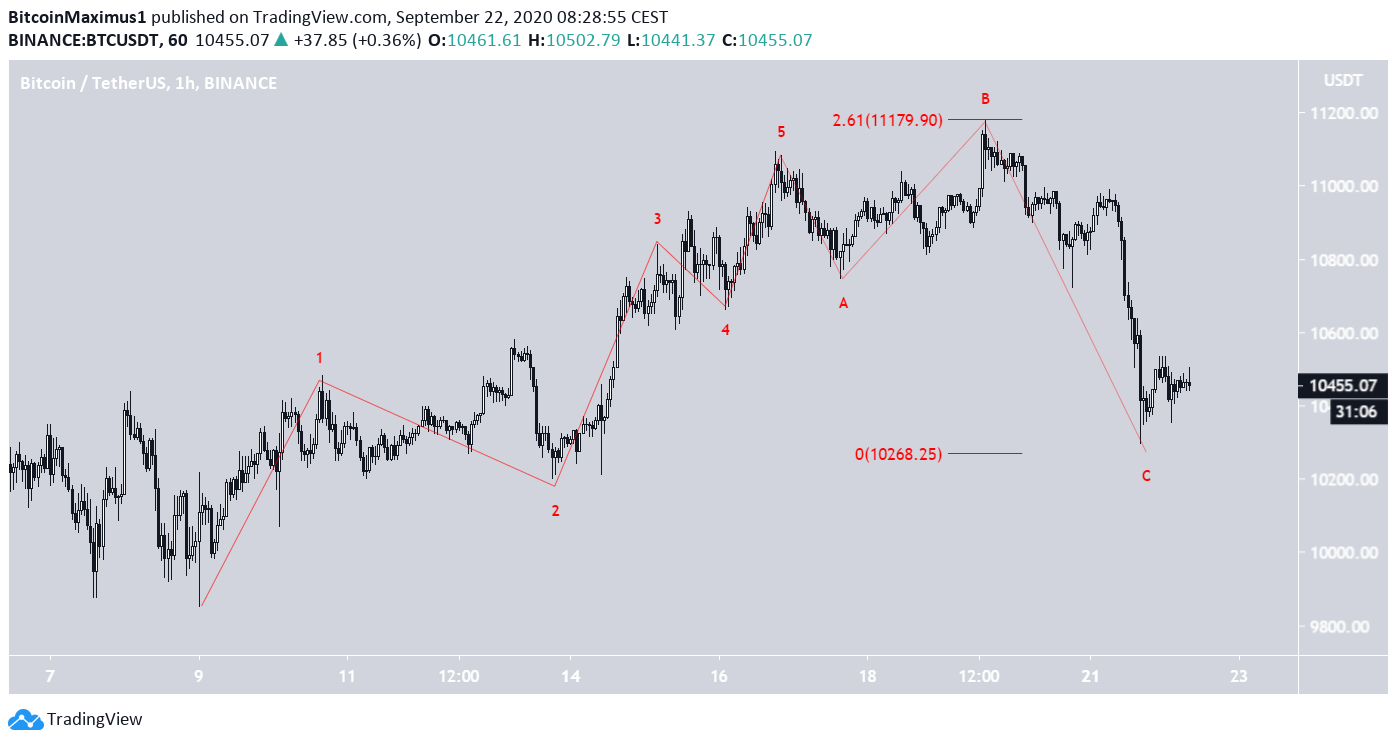
A possible wave count suggests that the price has completed an impulse and is now correcting inside an A-B-C formation (shown in red below).
The shape of the A-B-C is unusual, but the A:C waves have a 1:2.61 ratio, making it possible for this to be the correct formation. However, the price would have to reach a low soon to complete the C wave.
The 15-minute chart shows that another wave down (blue) would be expected to complete the larger C wave. This would take the price to the 0.618-0.786 Fib support outlined in the first section.
Afterward, BTC is expected to move upwards.
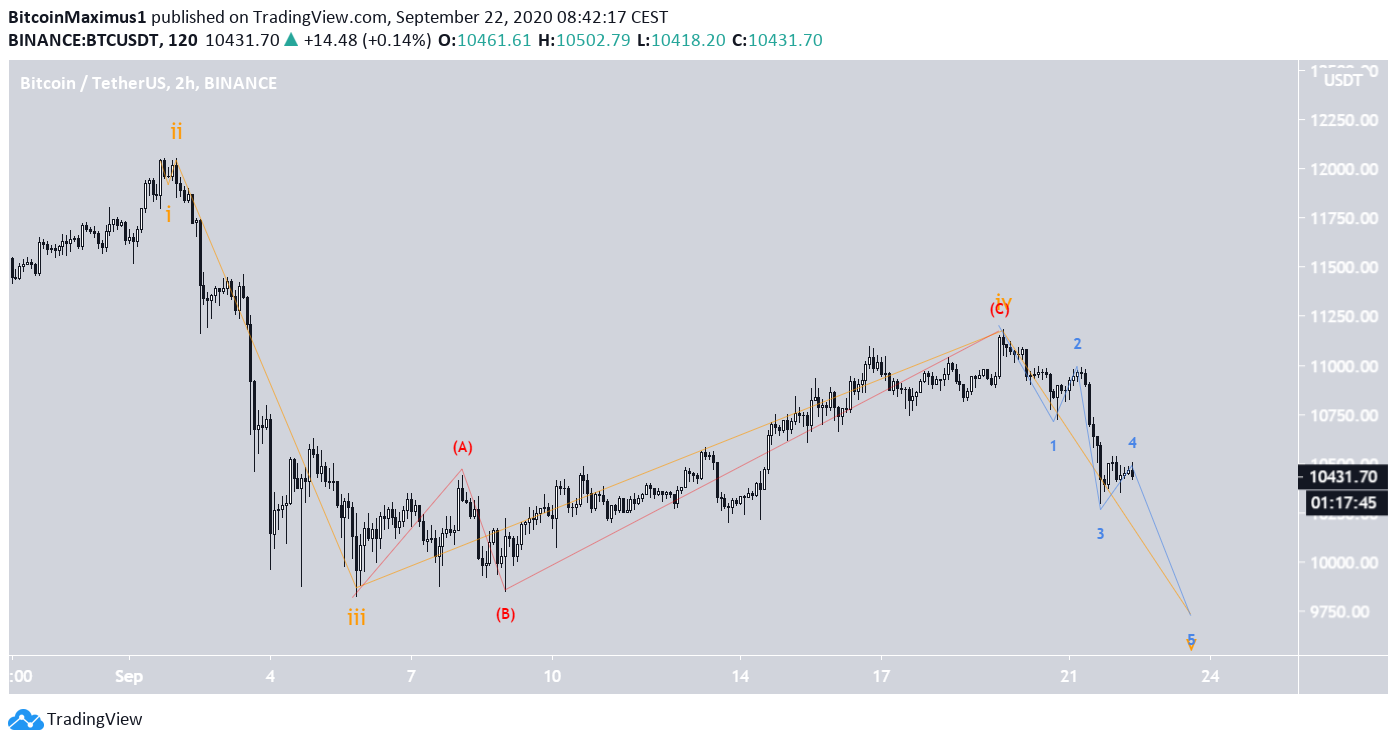
Alternative Count
There is another possible count which we previously dismissed, but the Sept 21 losses put it back in play. The shape and magnitude of wave 4 ( in orange below) makes it unlikely to be the correct count, but it is still valid.
In this case, the short-term count (blue) would remain the same, but the fifth wave would extend, and the price would make a lower-low relative to Sept 4.
To conclude, the most likely scenario for the BTC price is a bounce at the $10,115-$10,355 level, followed by a new upward move.
For BeInCrypto’s previous Bitcoin analysis, click here!


