


On July 20, the Bitcoin (BTC) price decreased slightly. However, it kicked off today with a breakout above an important resistance level and moving average (MA).
This could indicate that its consolidation period might be over.
Bitcoin Consolidation Crawl
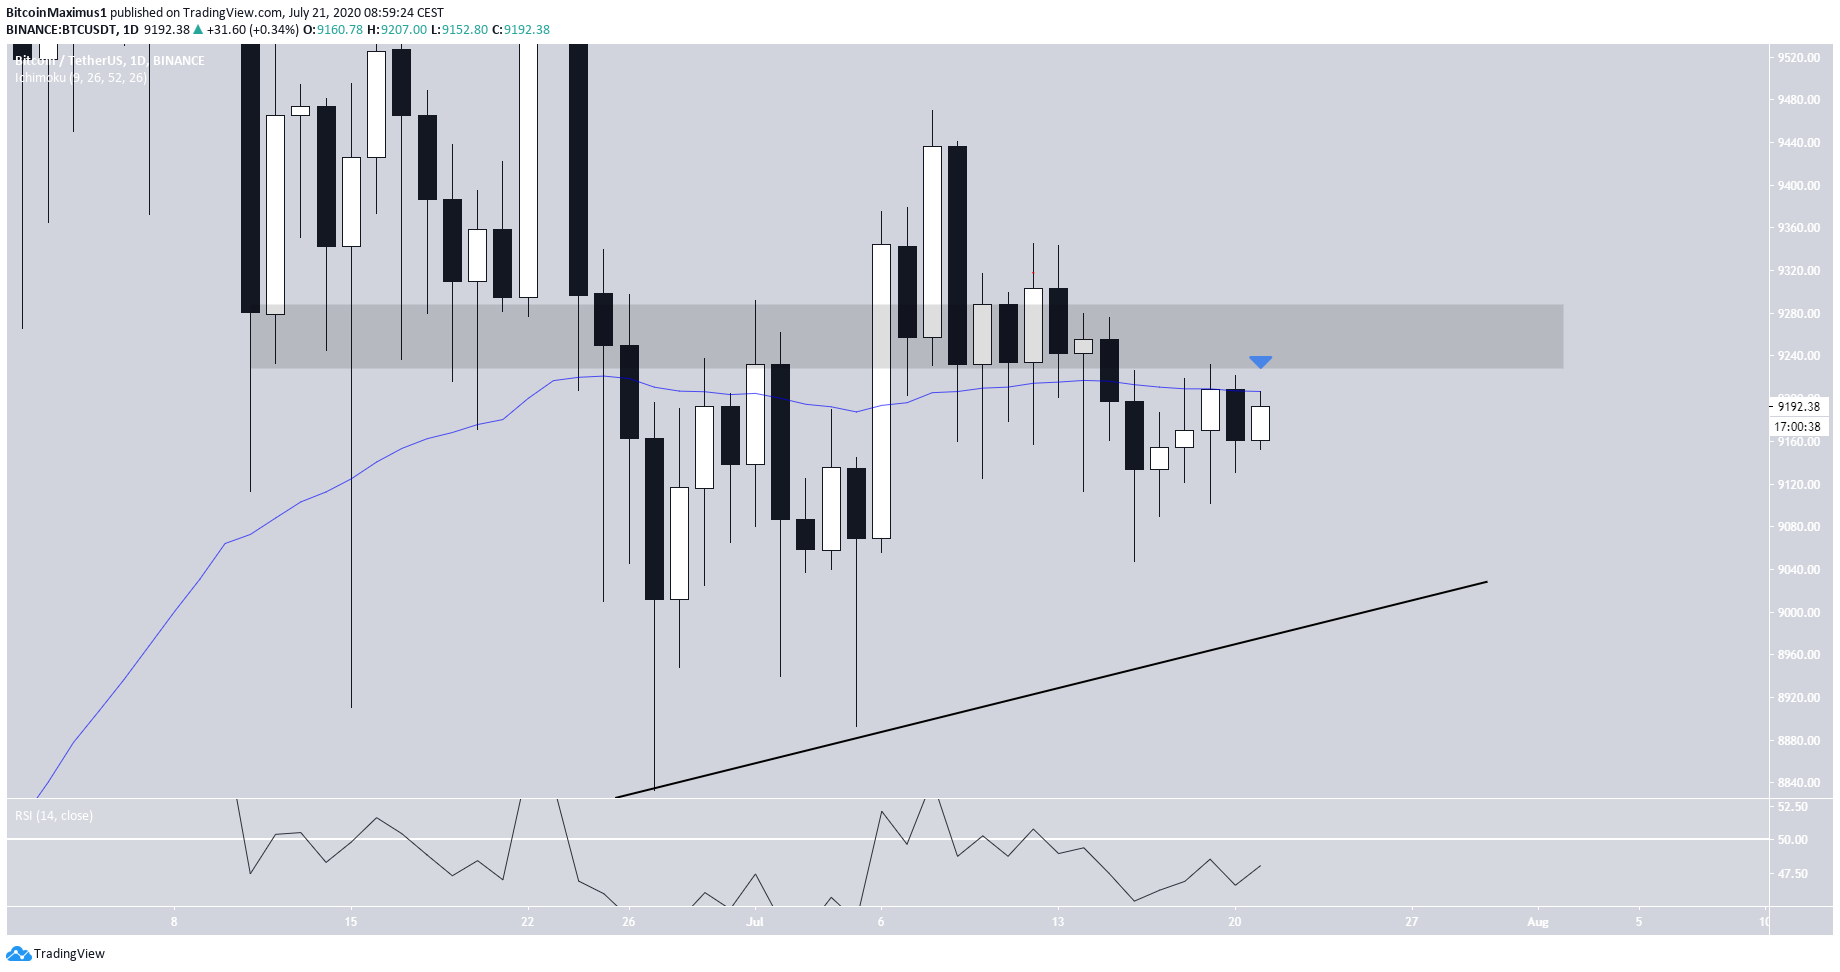
The Bitcoin price had been consolidating below the $9,250 area, which has previously acted as support and resistance and was trading right below the 50-day MA.
The daily RSI began trending below the 50-line, but shot off and is currently sitting at 62.
There have been numerous long lower-wicks over the past two weeks. This mounting buying pressure likely helped BTC to blast through resistance.
If this turns out to be a fake-out rally, the most likely level for support is found at $8,950—an ascending support line that began in May.
Current Breakout
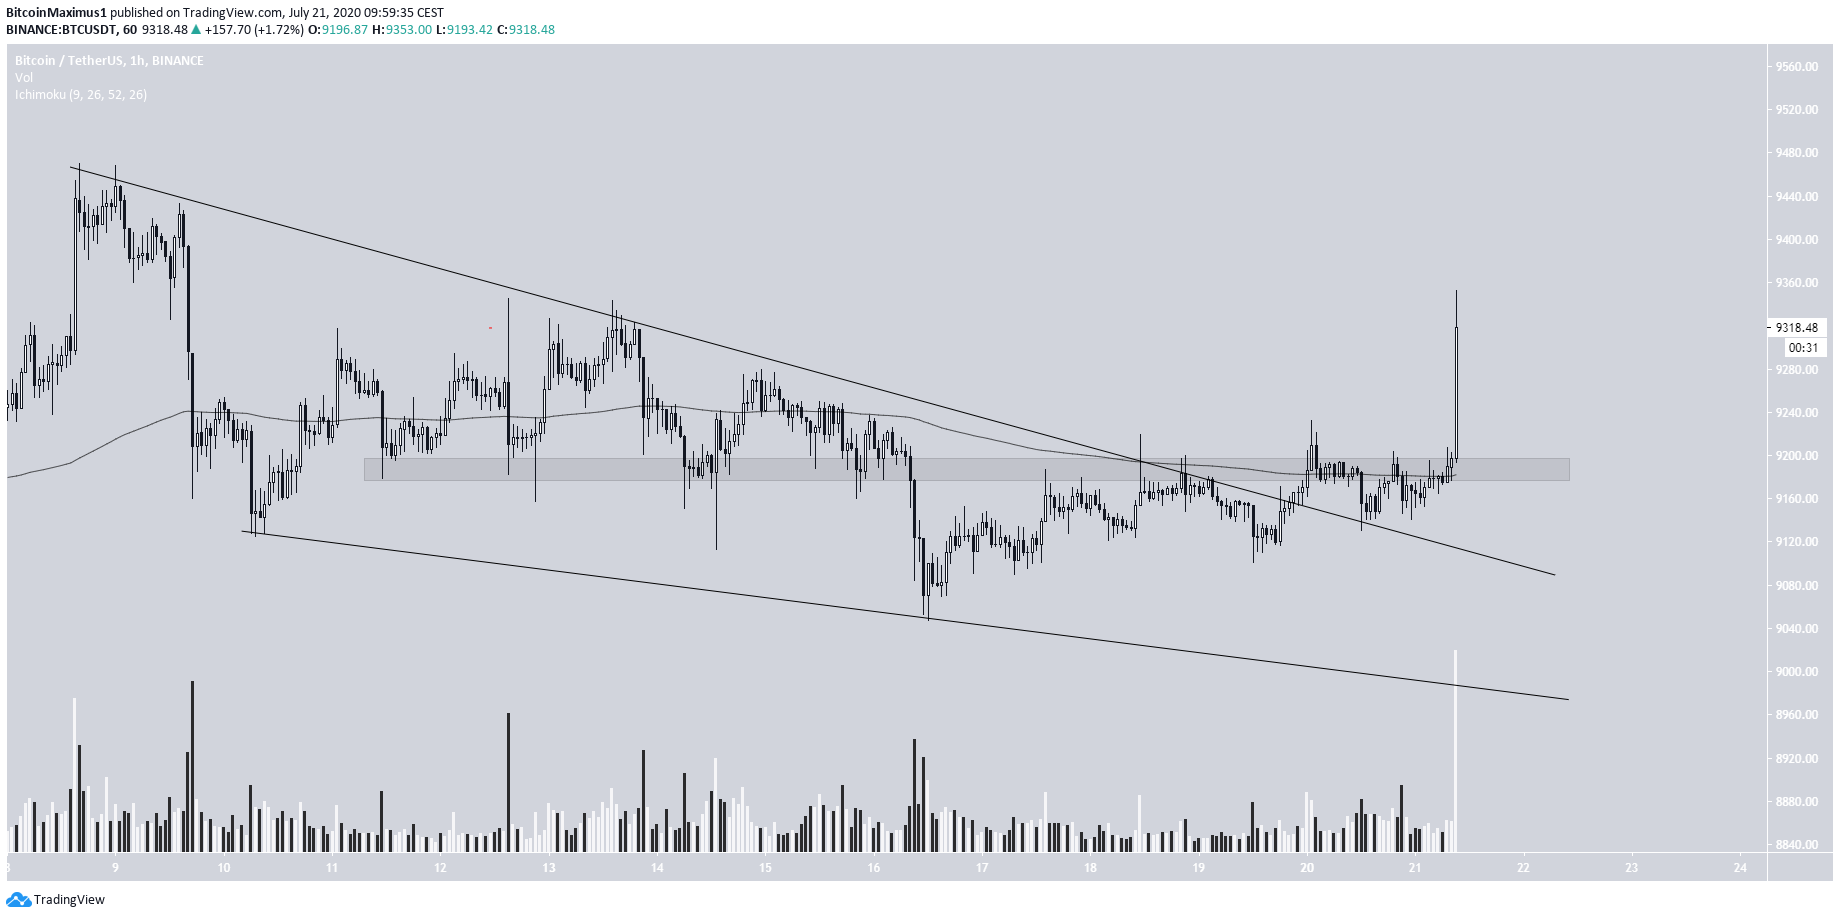
The hourly chart shows that the price has already broken out from a descending wedge, along with the 200-hour MA and a minor resistance level of $9,200.
Furthermore, the breakout has transpired with extremely high volume, increasing its validity. This is a sign that the consolidation period has likely ended and BTC is heading higher.
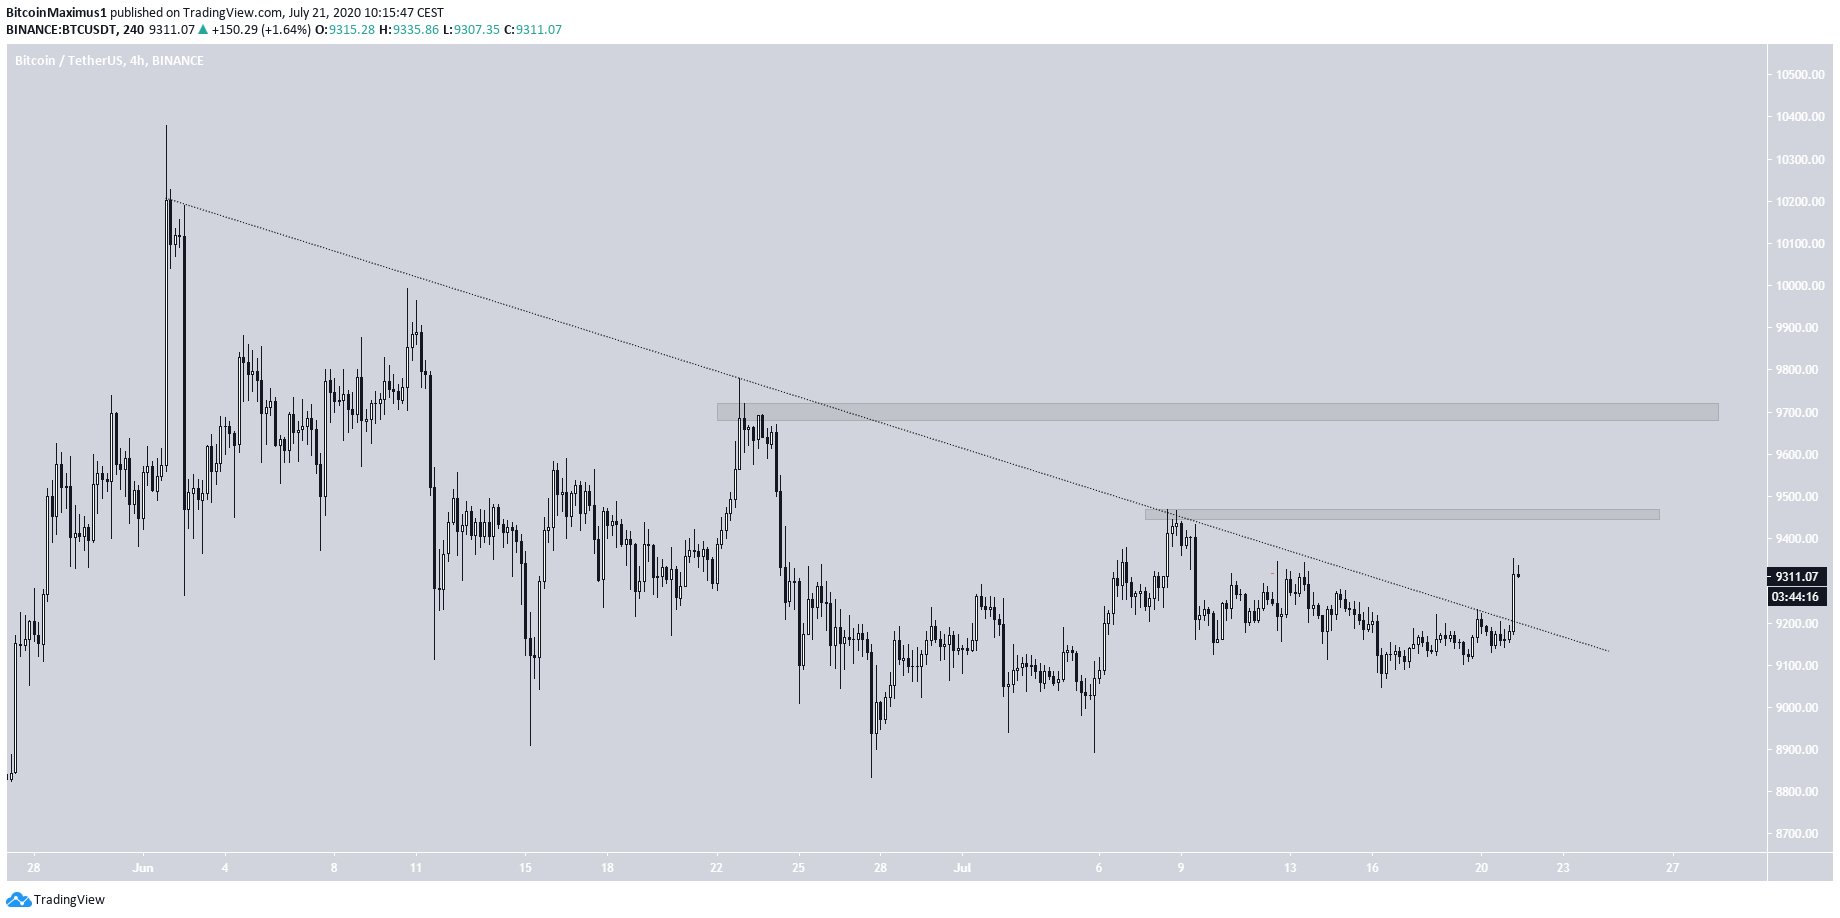
The longer-term chart also shows that BTC has broken out from a descending resistance line, which has been in place since the June 1 high of $10,380. The confluence of these breakout levels increases the possibility of a continued upward move.
If the price continues increasing, as is expected, the next closest resistance areas are found at $9,450 and $9,700. While short-term retracements could occur in between, BTC is expected to eventually hit these levels.
To conclude, the BTC price has broken out from a resistance line both in the short and the long-term, possibly indicating that the corrective period has ended. The price is expected to increase towards the resistance areas outlined above.
For our previous analysis, click here.


