
The crypto market has been moving steadily and cautiously ahead of the US Nonfarm Payrolls (NFP) Report. Bitcoin’s (BTC) price, along with Ethereum (ETH), has been observed to be slightly bearish, while XRP is susceptible to further decline.
BeInCrypto’s analysis finds that while the big three cryptocurrencies may not have noted sharp drawdowns, there is a chance that the coming week may not prove to be bullish for them.
Bitcoin Weekly Wrap: Price Action Remains Bearish
Bitcoin’s price has been stuck in a bearish pattern, forming a right-angled descending broadening wedge. This technical formation projects a potential 21% drop, which would send Bitcoin to $42,804 if the pattern breaks down.
However, a major breakdown may not be imminent. Volatility has been declining, with Bitcoin’s price dropping by less than 5% over the past week.
This decrease in market activity suggests that while the bearish trend remains intact, a sharp downturn might be delayed. The lower volatility gives Bitcoin a chance to consolidate before any significant moves take place.
Read more: Bitcoin Halving History: Everything You Need To Know
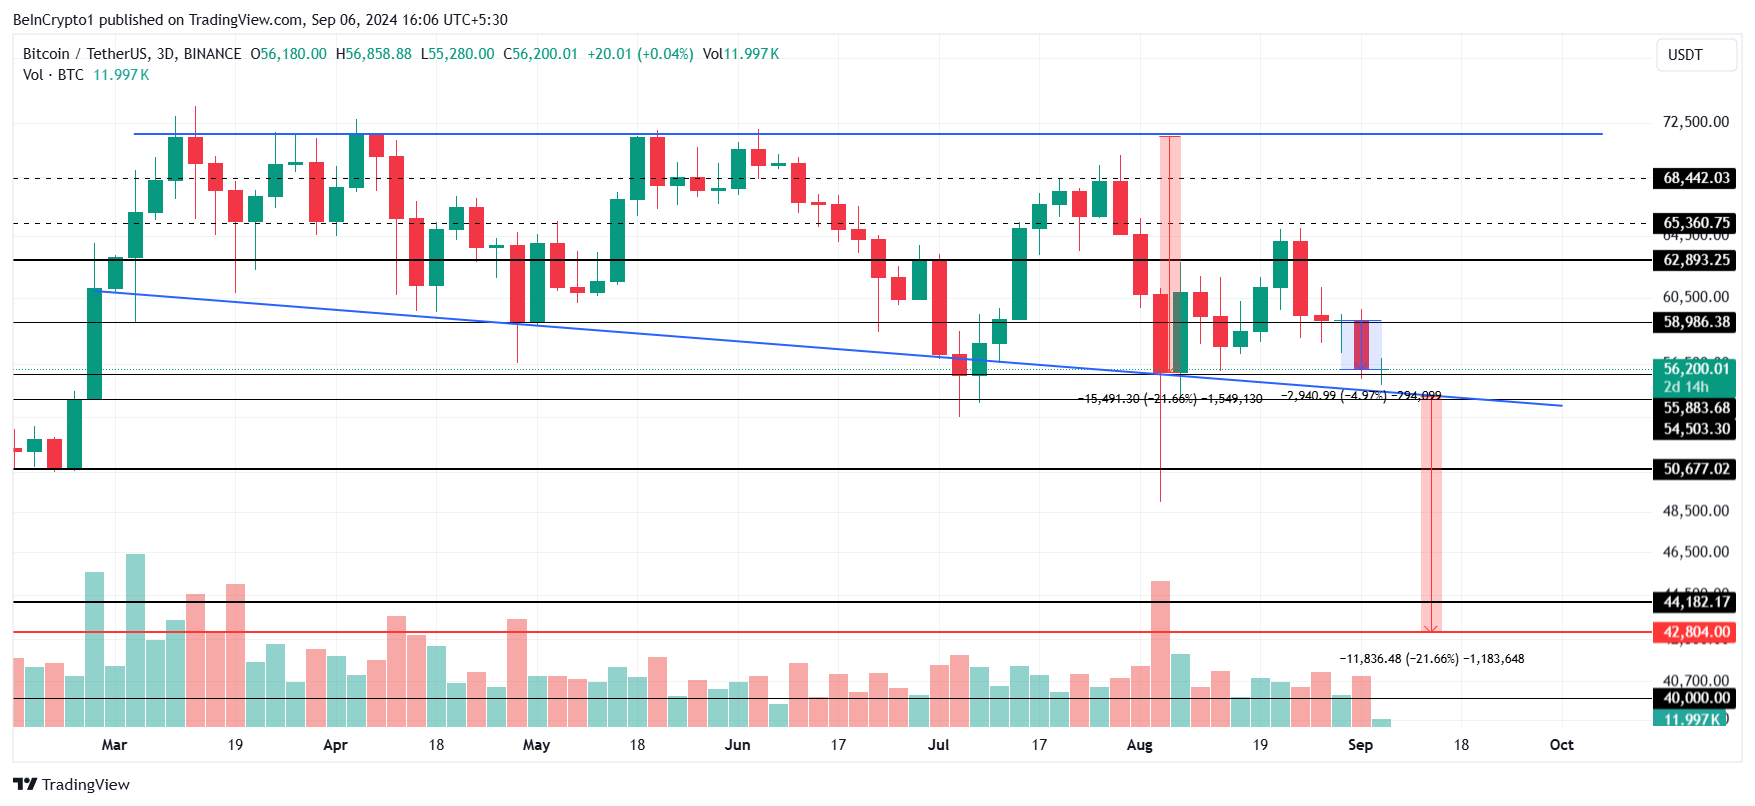
In the coming week, Bitcoin will test the $55,883 support level, a crucial area for bulls. A rebound from this level could allow BTC to recover, but losing it could push the price toward $54,500. Bitcoin might be poised for a breakdown from the bearish wedge pattern if this support breaks.
Ethereum Could Validate a Multi-Month Trend
Ethereum’s price is currently at $2,372, approaching a crucial support level of $2,344. The altcoin has experienced a 6% decline over the past week, but this drawdown may not continue in the immediate future. The recent price action suggests that Ethereum could stabilize or recover rather than extend its losses further.
Historically, Ethereum has shown resilience at $2,344. For instance, after a significant 30% drop at the end of July, ETH bounced back from this price point.
A similar recovery pattern could see Ethereum’s price rise to $2,546, a key resistance level the altcoin has struggled to surpass this week.
Read more: How to Invest in Ethereum ETFs?
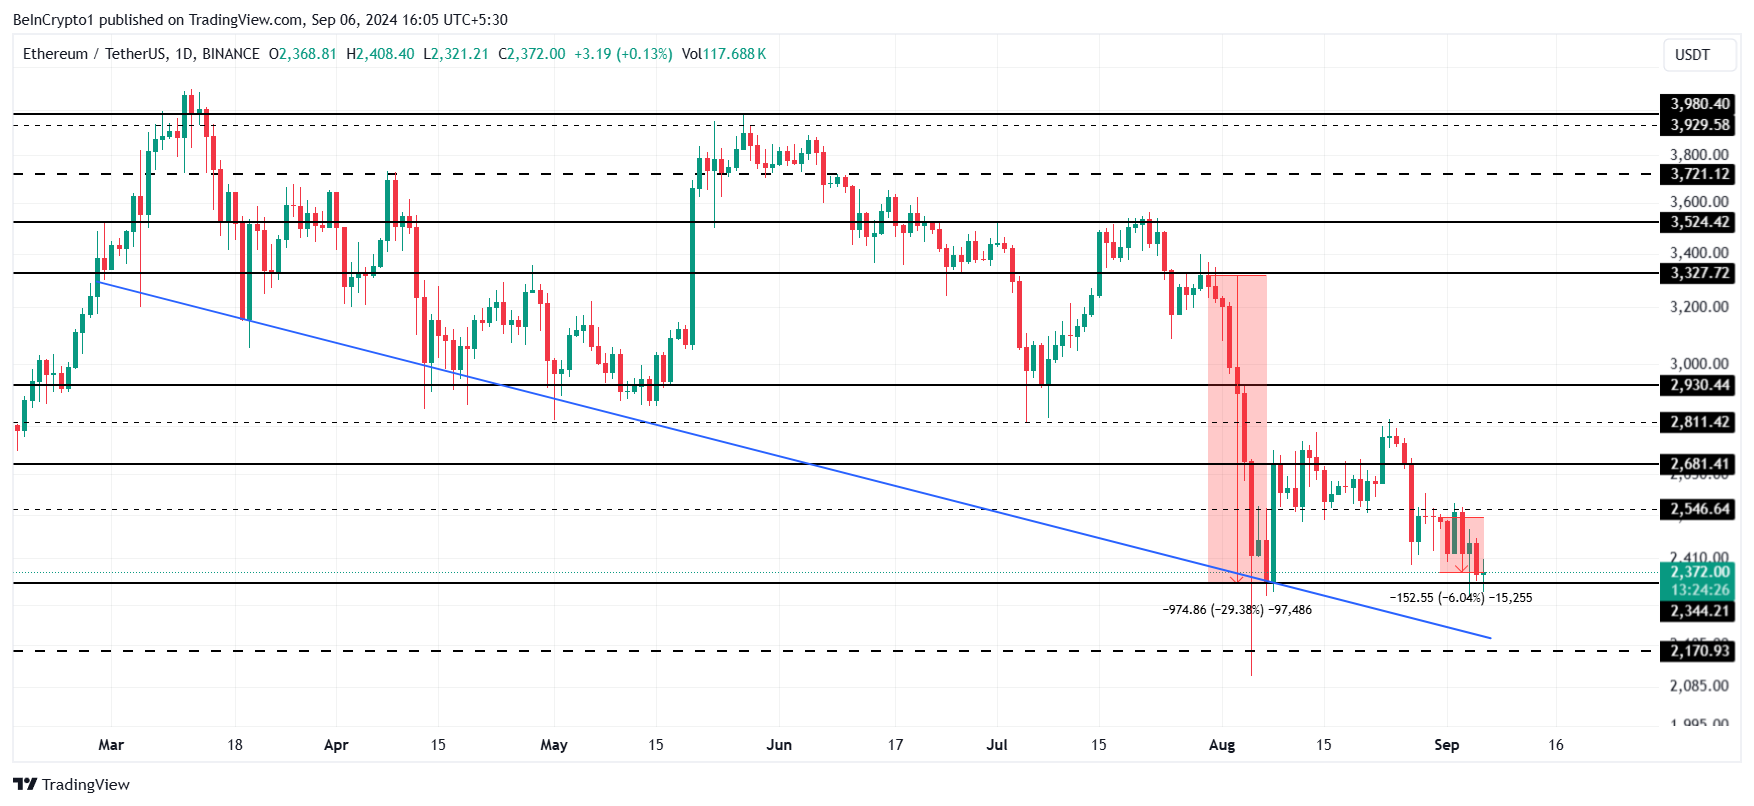
On the other hand, if bearish pressure increases and ETH falls below the $2,344 support, it could confirm a five-month-long downtrend. In such a scenario, Ethereum might test its trend line support above $2,170, which would invalidate any current bullish outlook. This shift could signal further declines and a deeper bearish trend for Ethereum.
XRP Price Is at Risk
XRP’s short-term price outlook appears negative after a recent 5% drop. This decline led the altcoin to lose support at the 38.2% Fibonacci Retracement level of $0.55. The loss of this key support line has raised concerns about further declines, making the short-term forecast challenging for XRP.
The Bollinger Bands are currently showing a squeeze on the 12-hour chart, indicating potential for a short-term decline. With the candlesticks positioned below the basis line, this technical setup suggests that XRP might test the 23.6% Fibonacci line at $0.49. Such a move would further confirm the bearish sentiment in the market.
Read more: Ripple (XRP) Price Prediction 2024/2025/2030
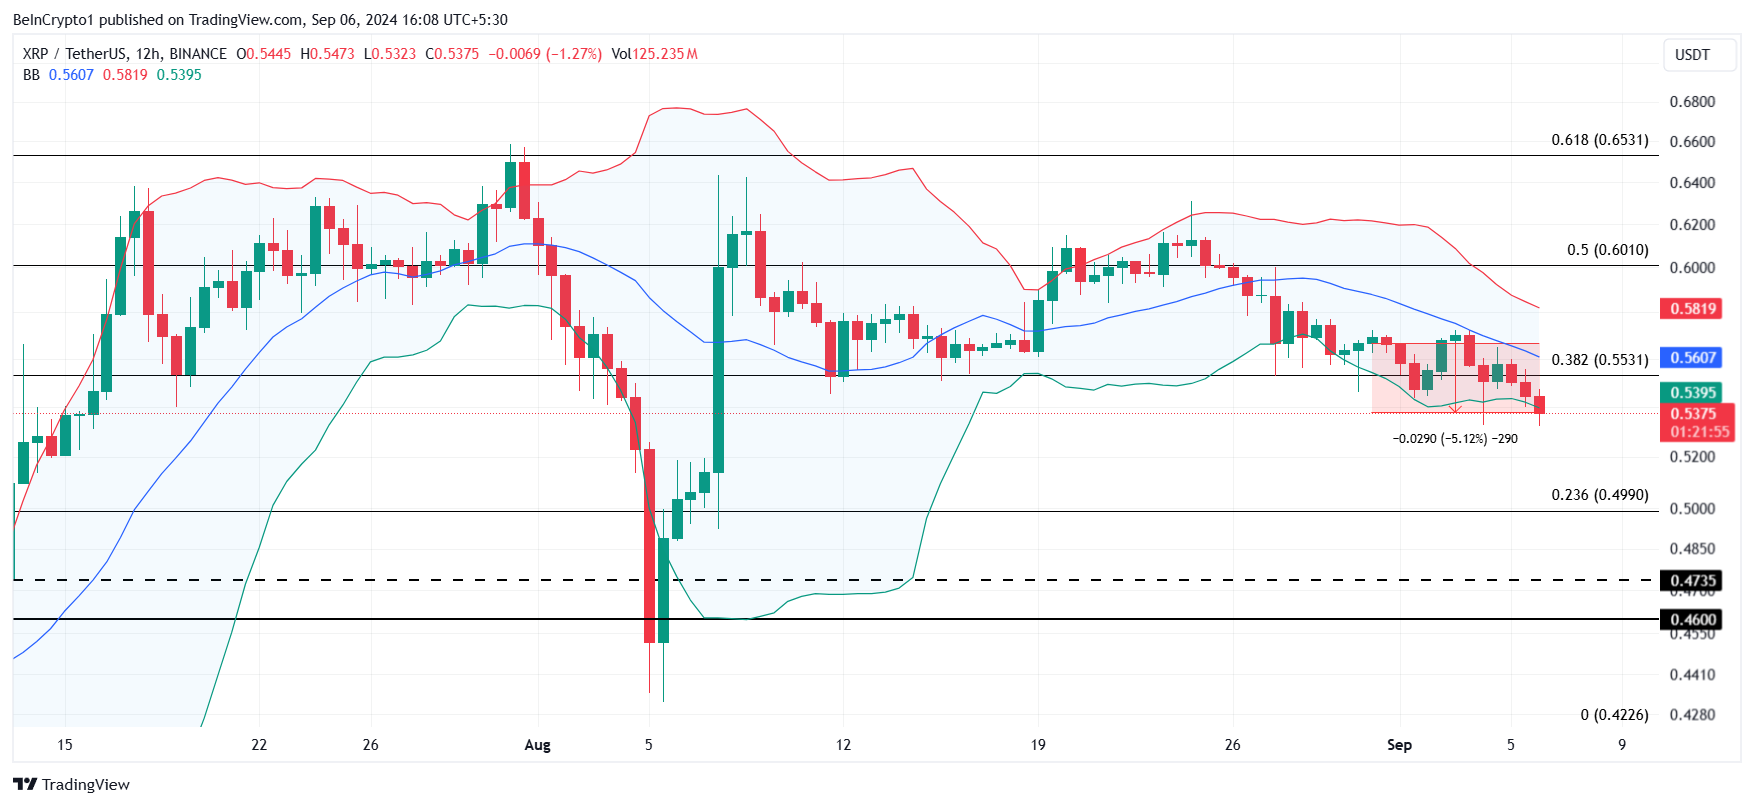
Nevertheless, despite recent losses, XRP has shown the ability to recover from dips below $0.55. If this pattern repeats, the altcoin could stabilize and continue moving sideways above this support. However, the bearish outlook will only be invalidated if XRP manages to reclaim the 50% Fibonacci line at $0.60.
