
On April 2, the Bitcoin price broke out above an important resistance area found at $6,800.
Afterward, it validated this level as support and has been increasing since, breaking through the $7,000 resistance level without difficulty. The price reached a high of $7,452 before correcting back to $7,300.
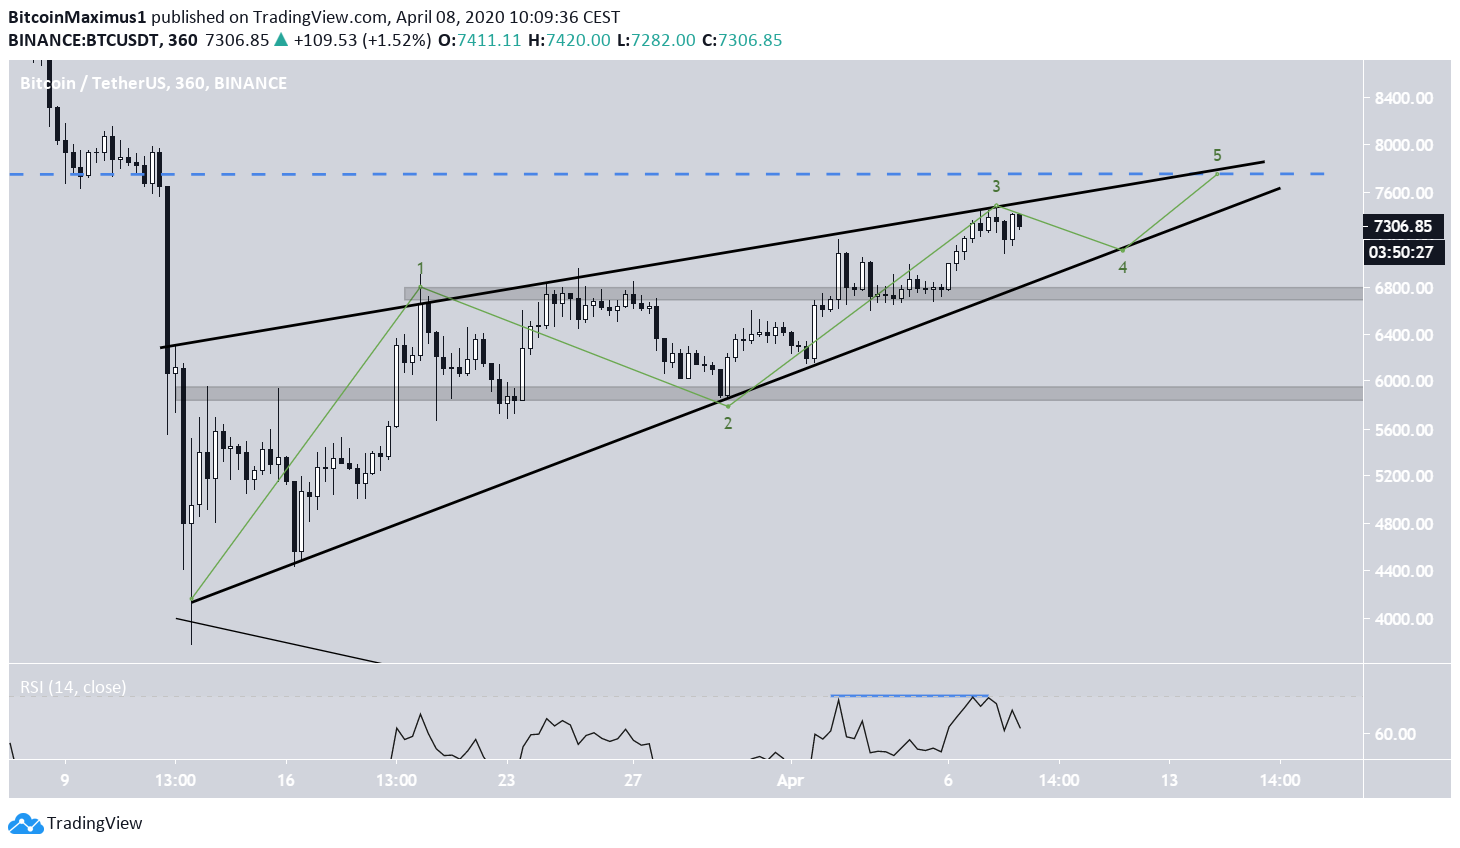
Bitcoin Ascending Wedge
The BTC price has increased significantly since reaching a low on March 13. The increase has taken the form of an ascending wedge, which is considered a bearish reversal pattern.
It is possible that the price continues to trade inside this wedge until it reaches the next resistance level at $7,750. A five-wave Elliott formation looks to be forming that would take the price all the way to this resistance line.
If this is the case, the price is currently at the top of the third wave, after which a decrease towards the support line is expected. Afterward, the price is likely to create the final upward move before breaking down.
This possibility is supported by the slight bearish divergence that has been developing in the RSI, which is more visible in shorter-term time-frames.
If the price breaks down, the closest support areas are found at $6,700 and $5,800.
Short-Term Perspective
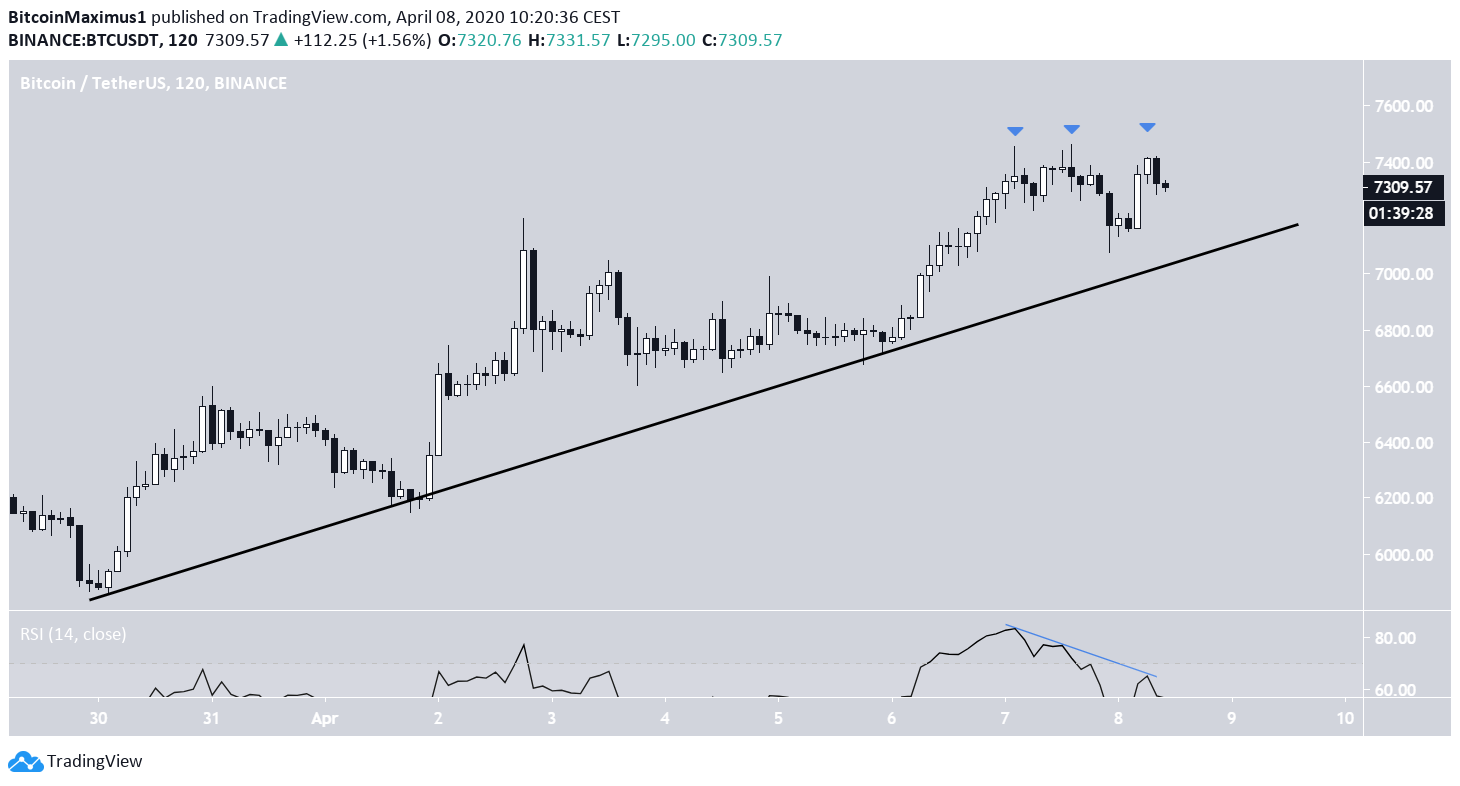
In the short-term, the price is following an ascending support line and has been doing so since March 30, validating it thrice up to this point.
The price has created a triple-top pattern, which is combined with a strong bearish divergence in the RSI. This suggests a downward move is likely, at least towards the ascending support line. This would complete the fourth wave of the five-wave Elliott formation outlined previously.
A breakdown from this line would likely cause a breakdown from the longer-term ascending wedge. At the current time, we cannot confidently predict a breakdown.
To conclude, the BTC price is trading inside an ascending wedge, currently being very close to the resistance line of this pattern. After possibly another upward move, the price is expected to break down and decrease towards the support areas outlined above.
For those interested in BeInCrypto’s previous Bitcoin analysis, click here.
