


On April 6, the BTC price increased considerably, creating a bullish engulfing candlestick to reach a close of $7,355, safely above the resistance of the previous long upper-wick. The next important resistance area is found at $7,750.
Bitcoin’s Daily Movement
The BTC price created a bullish engulfing candlestick on April 7 and moved above the $6,850 level, which will now likely act as support. In addition, the price has moved above the yearly open found at $7,200. Finally, the daily RSI has increased considerably above the 50-line, a bullish sign that suggests the price is in an upward trend.
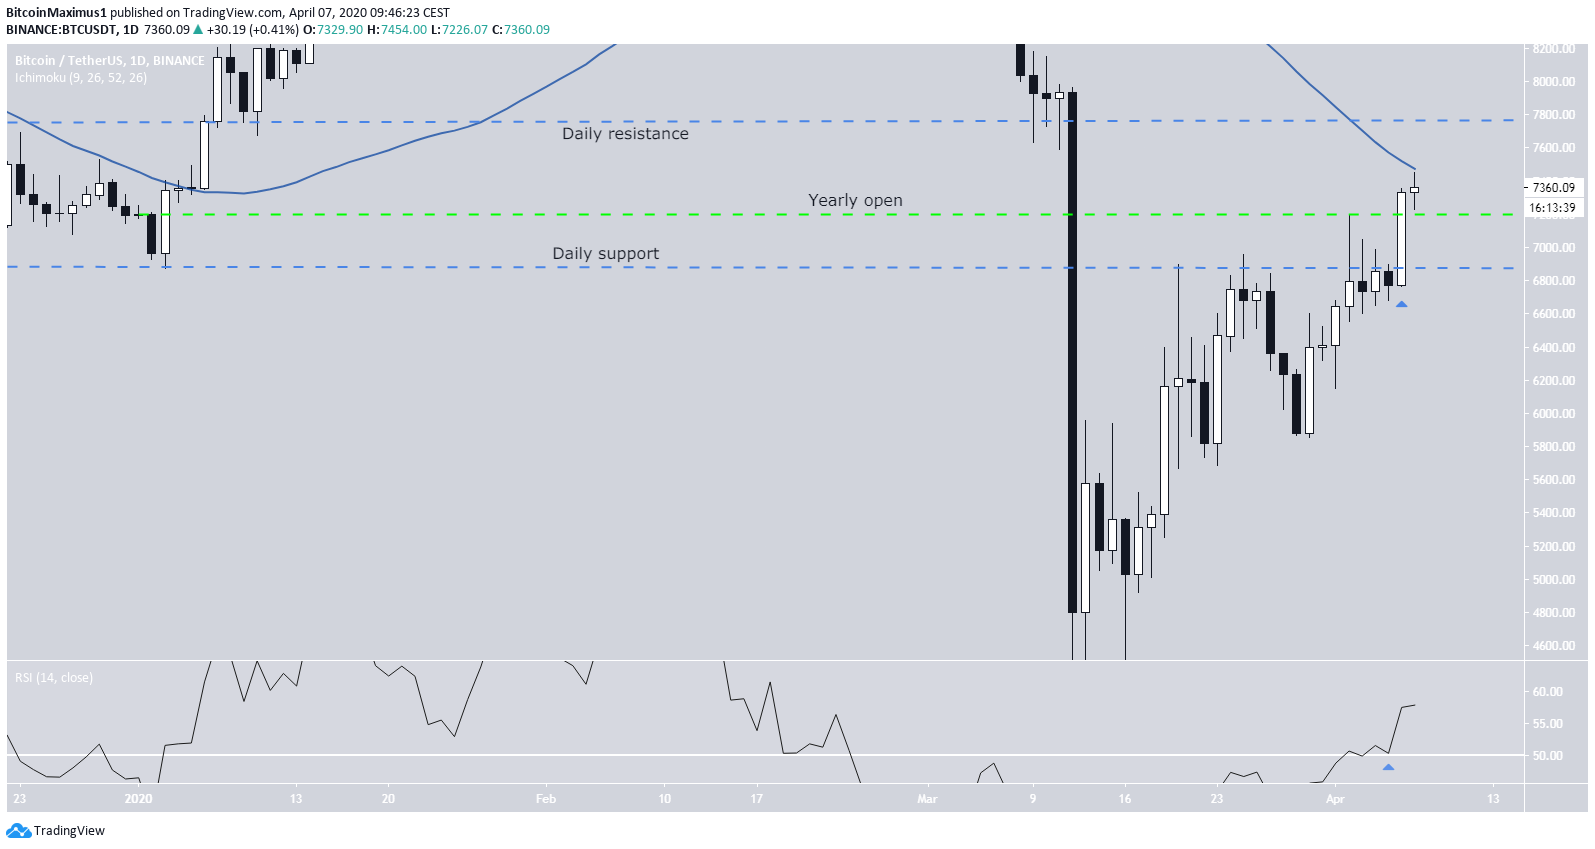
However, the price has found some resistance at the 50-day moving average (MA). If it is able to move above this MA, the next significant resistance level is found near $7,750.
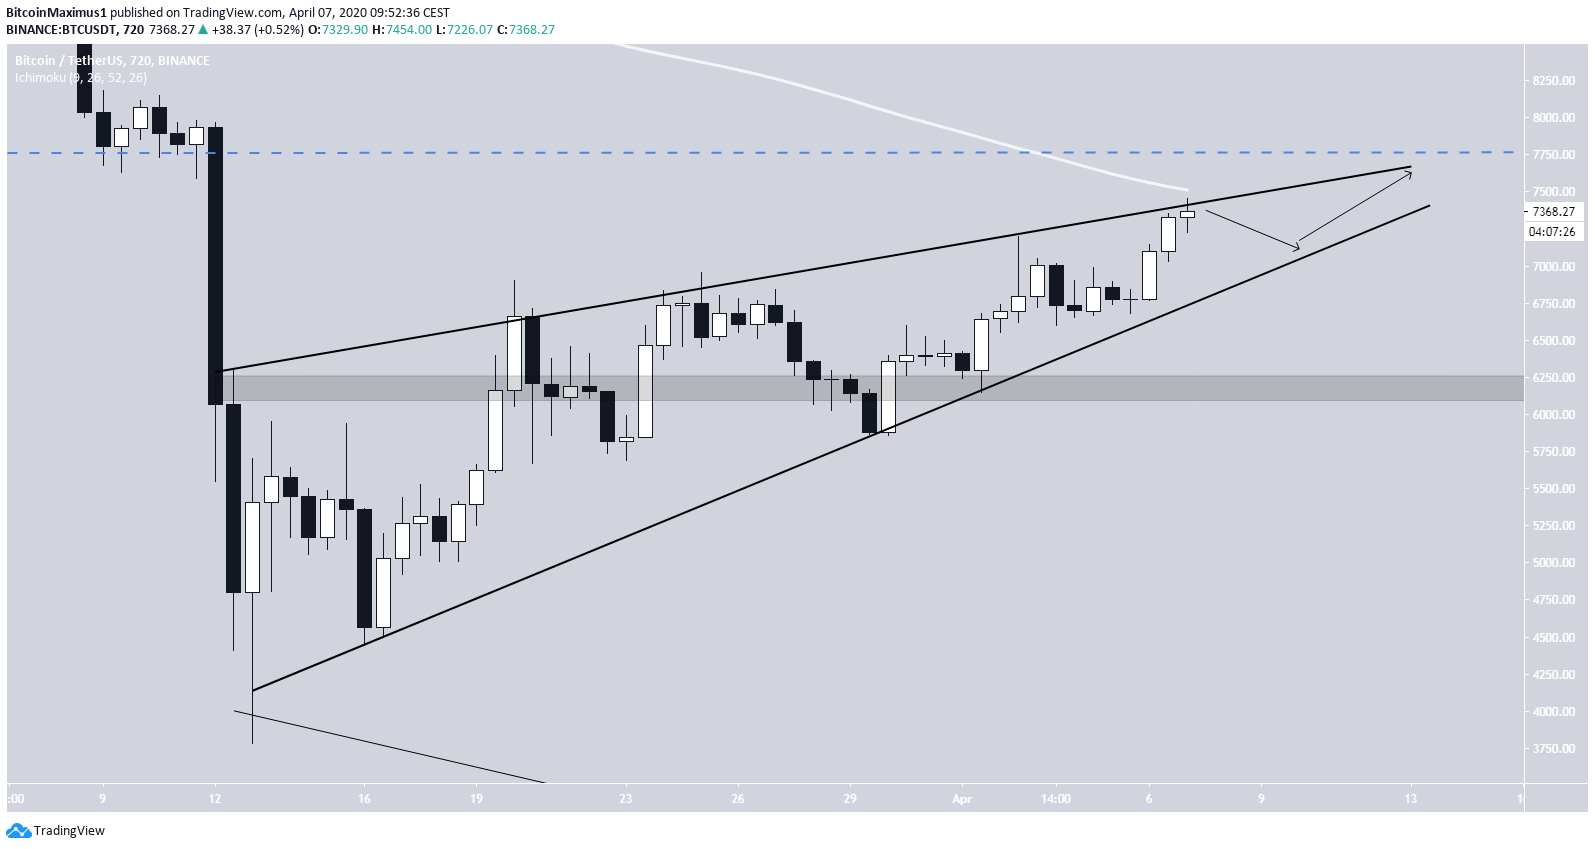
Ascending Wedge
In the medium-term, it looks as if the BTC price is trading inside an ascending wedge, and is currently very close to its resistance line. The price may continue trading inside this wedge until it reaches the next resistance level at $7,750 before eventually breaking down.
If so, the next important support area is found at $6,200.
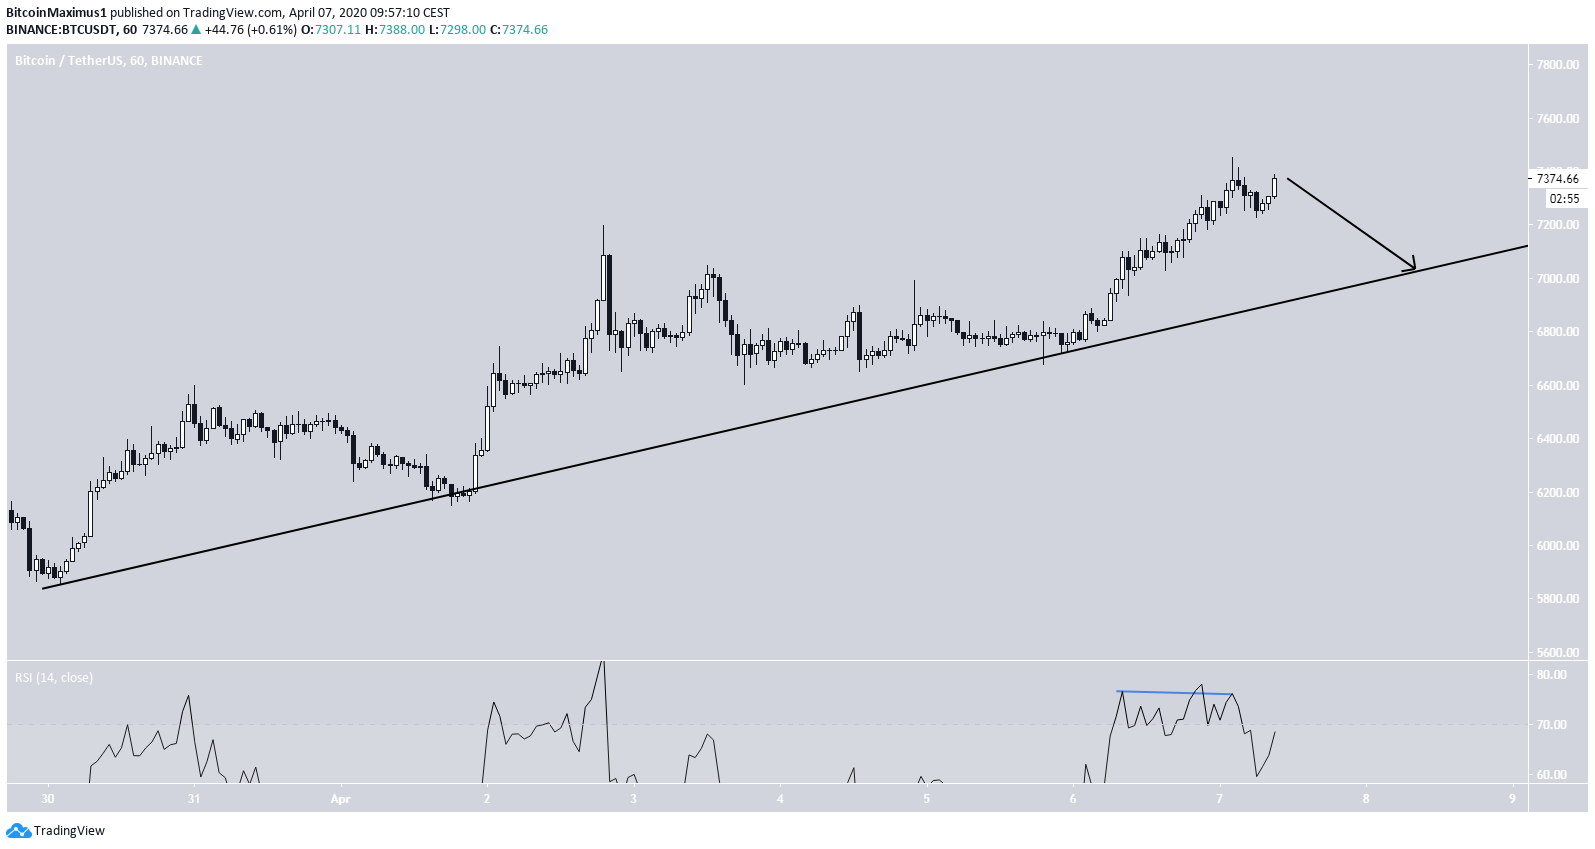
Short-Term View
In the short-term, the price is following an ascending support line and has been doing so since March 30. The price has validated this line three times up to this point. In addition, the hourly RSI has been generating a bearish divergence. This suggests that a downward move towards the support line is likely, which would also validate the longer-term ascending support line from the wedge.
In the current climate, a breakdown from the support line cannot be confidently predicted. The most plausible movement seems to be consolidation inside this wedge, with the price trading between $7,000-$7,600.
To conclude, the BTC price has broken out above an important resistance level, creating a bullish engulfing candlestick in the process. However, it is still trading inside a bearish pattern and approaching another important resistance level, making a breakout seem unlikely.
For those interested in BeInCrypto’s previous Bitcoin analysis, click here.


