
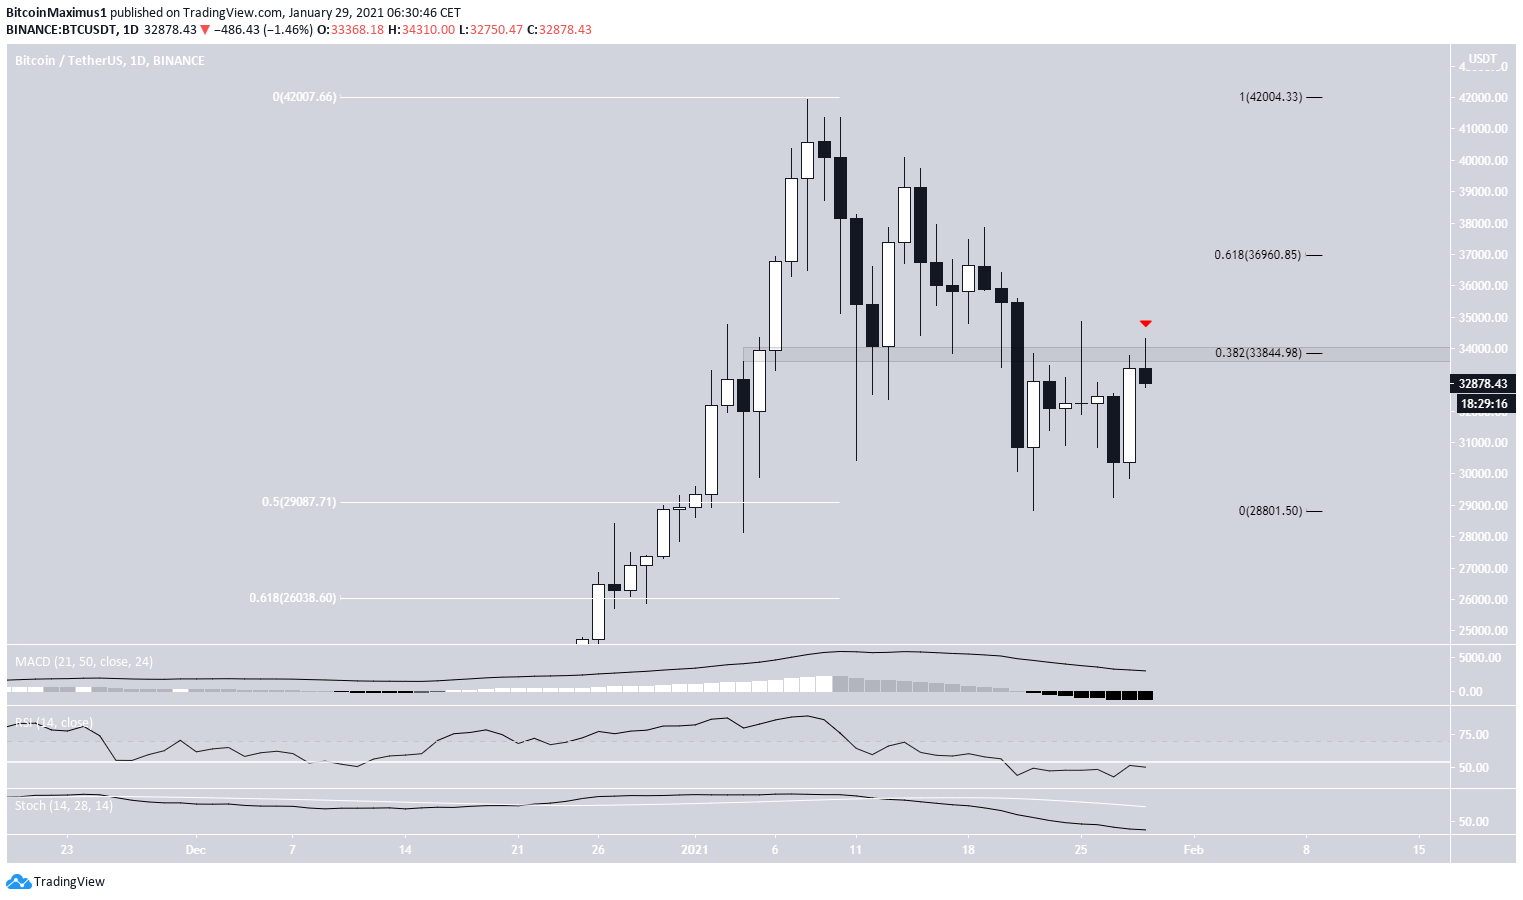
The Bitcoin (BTC) price bounced significantly on Jan. 28, creating a bullish engulfing candlestick and reaching a high of $33,783.
Bitcoin is expected to resume its upward movement until it reaches the neighborhood of $35,130.
Bitcoin Runs Into Resistance
Bitcoin initiated a considerable upward movement on Jan. 28, creating a bullish candlestick that completely engulfed the prior bearish candle. This also completed a double bottom pattern relative to the lows on Jan. 22.
However, BTC was rejected by the $33,800 resistance area (0.382 Fib retracement level). If a breakout were to occur, the next resistance area would be found at $39,960.
Daily indicators are firmly bearish, casting some doubt on the possibility of a breakout.
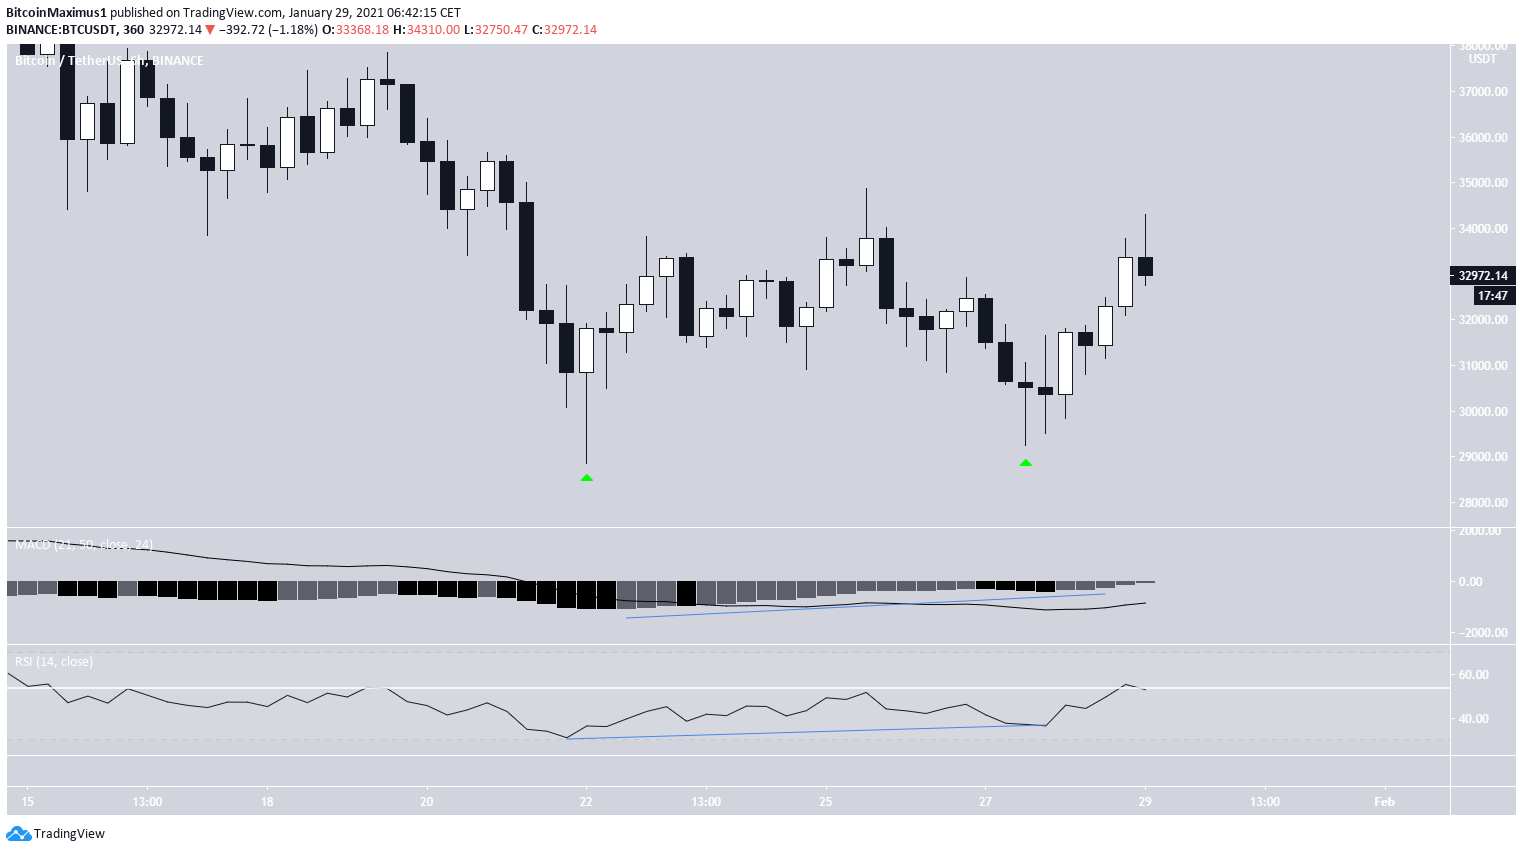
The six-hour chart shows the completed double bottom pattern, which was combined with a significant bullish divergence in the RSI and MACD.
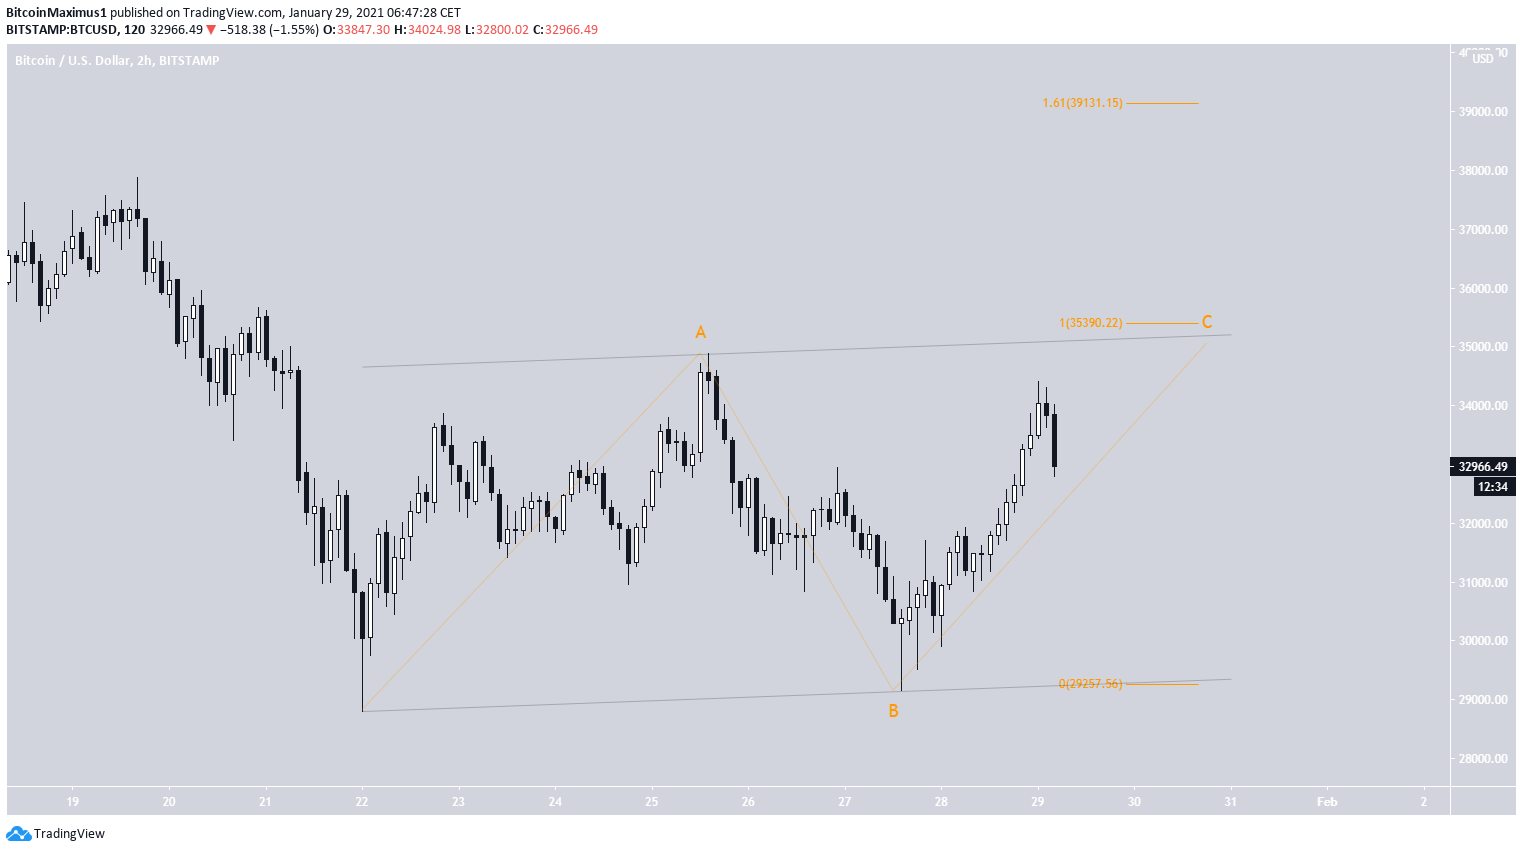
BTC Wave Count
The wave count suggests that BTC is now in the C wave (shown in orange below) of an A-B-C flat corrective structure.
The upward movement which completes this wave is expected to end at either:
- $35,390 – Giving the A:C waves a 1:1 ratio
- $39,131 – Giving the A:C waves a 1:1.61 ratio
The former target also fits with the resistance line of an ascending parallel channel, so it might be slightly more likely to be reached.
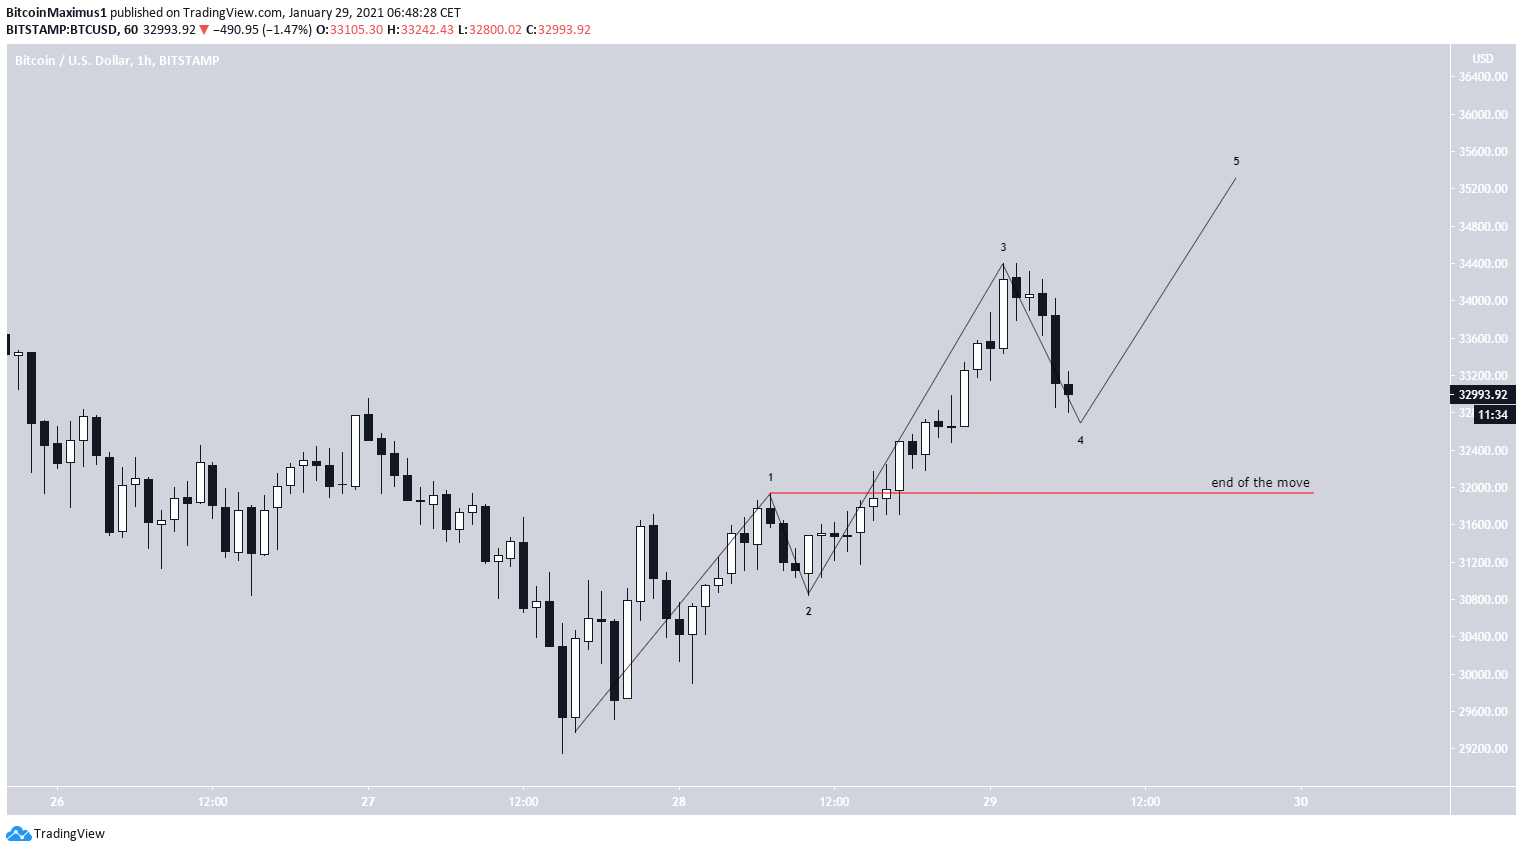
The sub-wave count (black) suggests that BTC has completed the first three waves of a bullish impulse which creates the C wave.
Once BTC decreases below the sub-wave 1 high at $31,928, the upward move will likely have ended.
After the C wave is completed, another downward move would be expected.
Conclusion
Bitcoin is expected to resume climbing until it reaches resistance at $35,390 and possibly $39,130, before beginning yet another downward move.
For BeInCrypto’s previous Bitcoin (BTC) analysis click here
