


The Bitcoin Dominance Rate (BTCD) has been on a correction course since May.
It’s now beginning to show bullish reversal signs, and could soon initiate an upward move.
Bitcoin Dominance Divergence
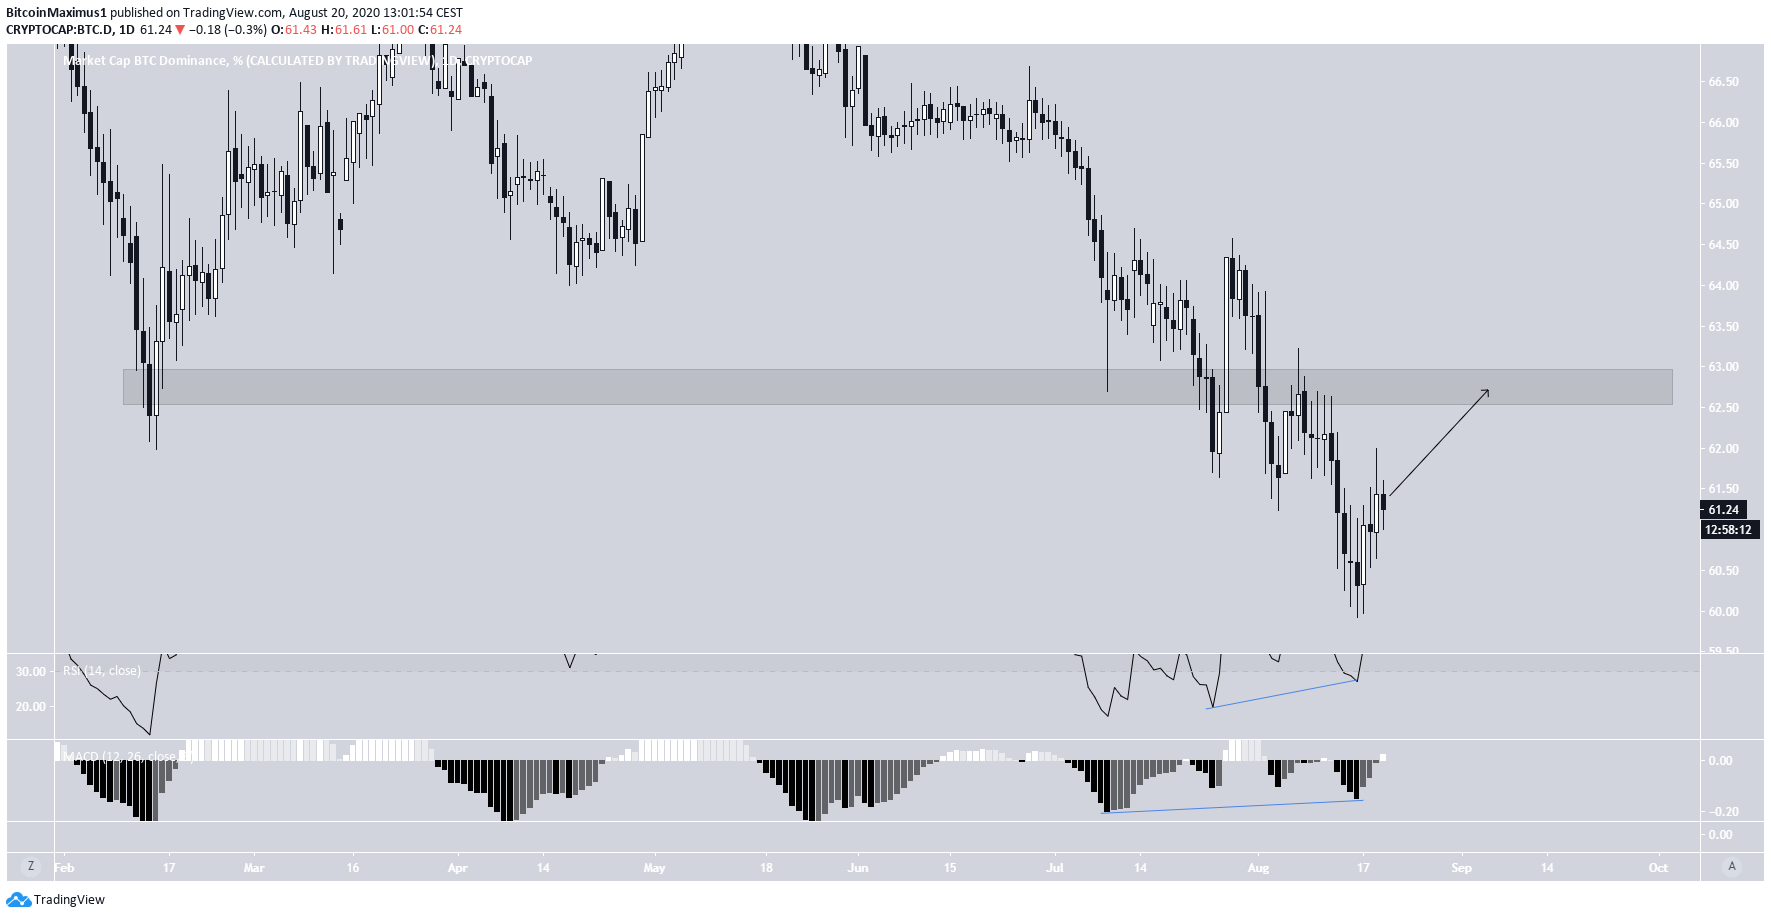
At the beginning of August, the Bitcoin dominance rate fell below the long-term 62.80% support area and validated it as resistance. After that, however, it dropped back down to reach a local low of 59.9%.
Both the RSI and MACD have been generating bullish divergences, and the latter has turned positive. This is a sign that the rate is likely to move back towards the 62.80% area once more. Whether it gets rejected or reclaims the level will likely determine the direction of the trend.
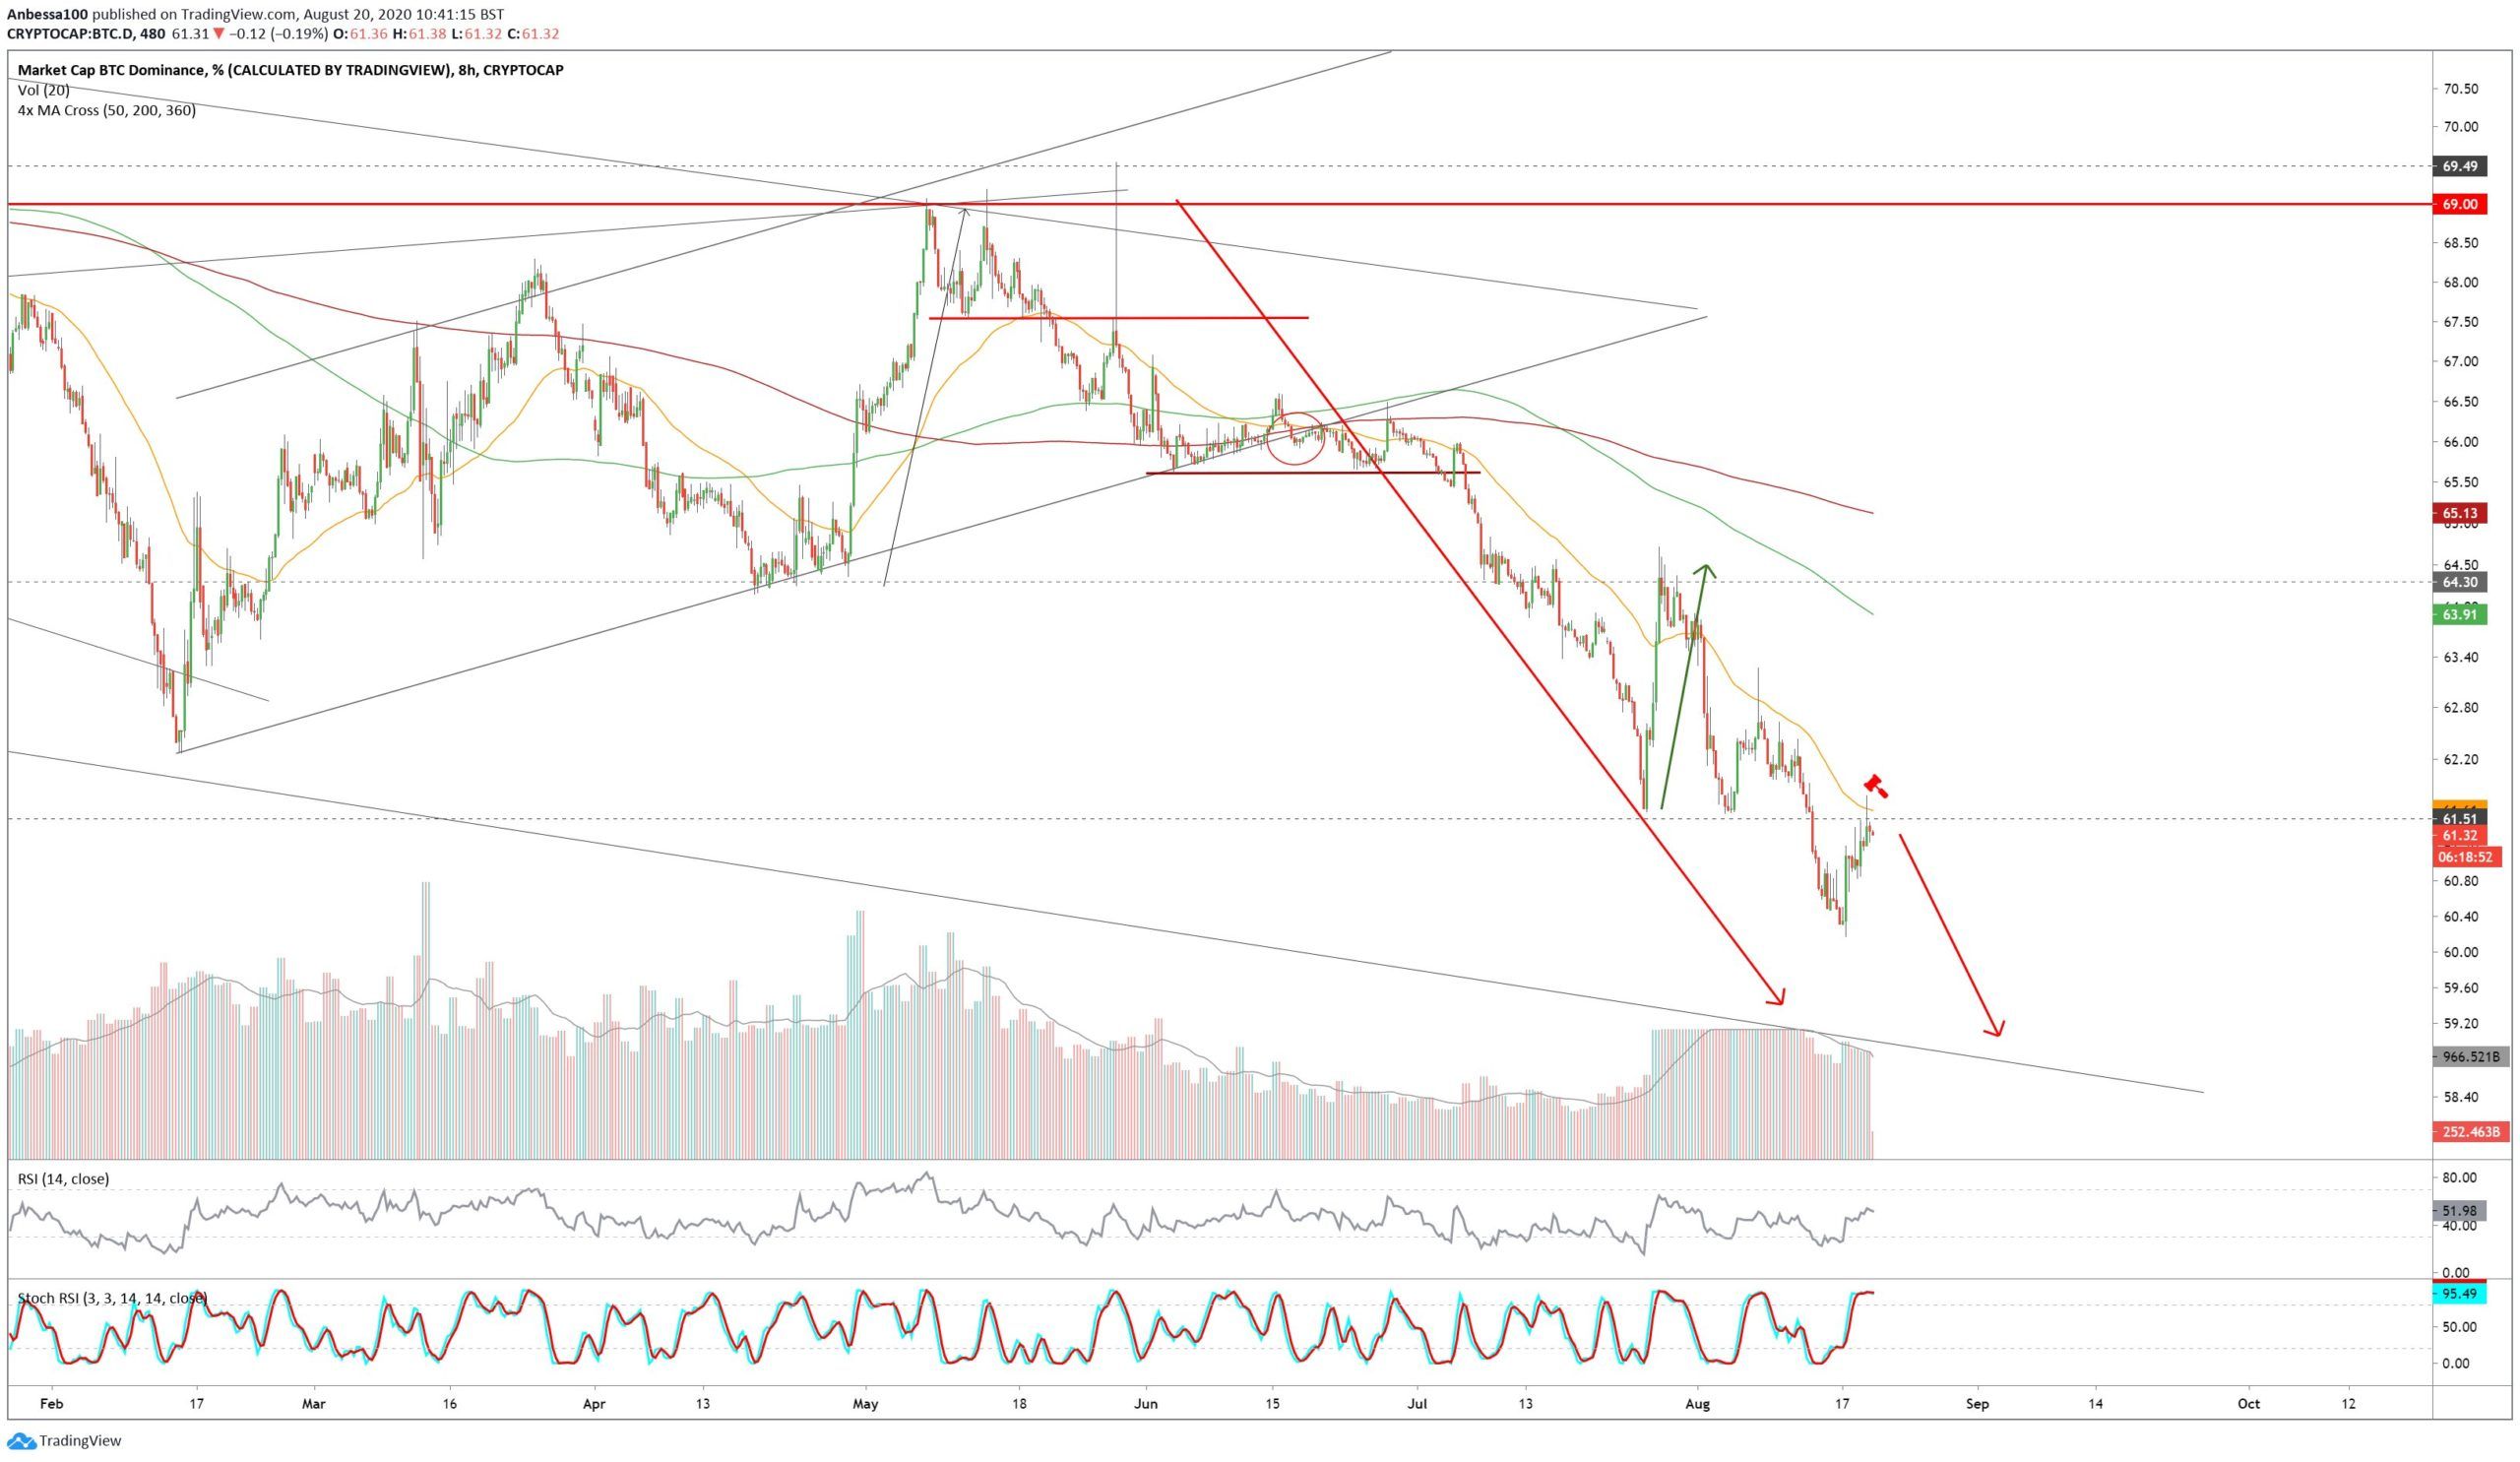
Cryptocurrency trader @anbessa100 stated that the Bitcoin dominance rate is expected to drop towards 59%, providing relief for ALT/BTC pairs.
However, due to the outlined bullish divergence, we think a continued upward move towards 62.80% is more likely to happen first. If the price gets rejected in this zone, it could then move down towards the 59% target.
Wave Count & Short-Term Movement
Beginning in September 2019, the BTCD began the process of completing a second A-B-C correction. It is likely in the A wave at the moment.
Projecting the 1.61 Fib level of the first A wave to the May 2020 top, gives a final target of 59.5%, fitting with the target given in the tweet.
Furthermore, the A wave is transpiring in a five-wave downward formation (orange). Projecting the 1.61 length of wave 1 top to the top of wave 4 gives us a target of 59%.
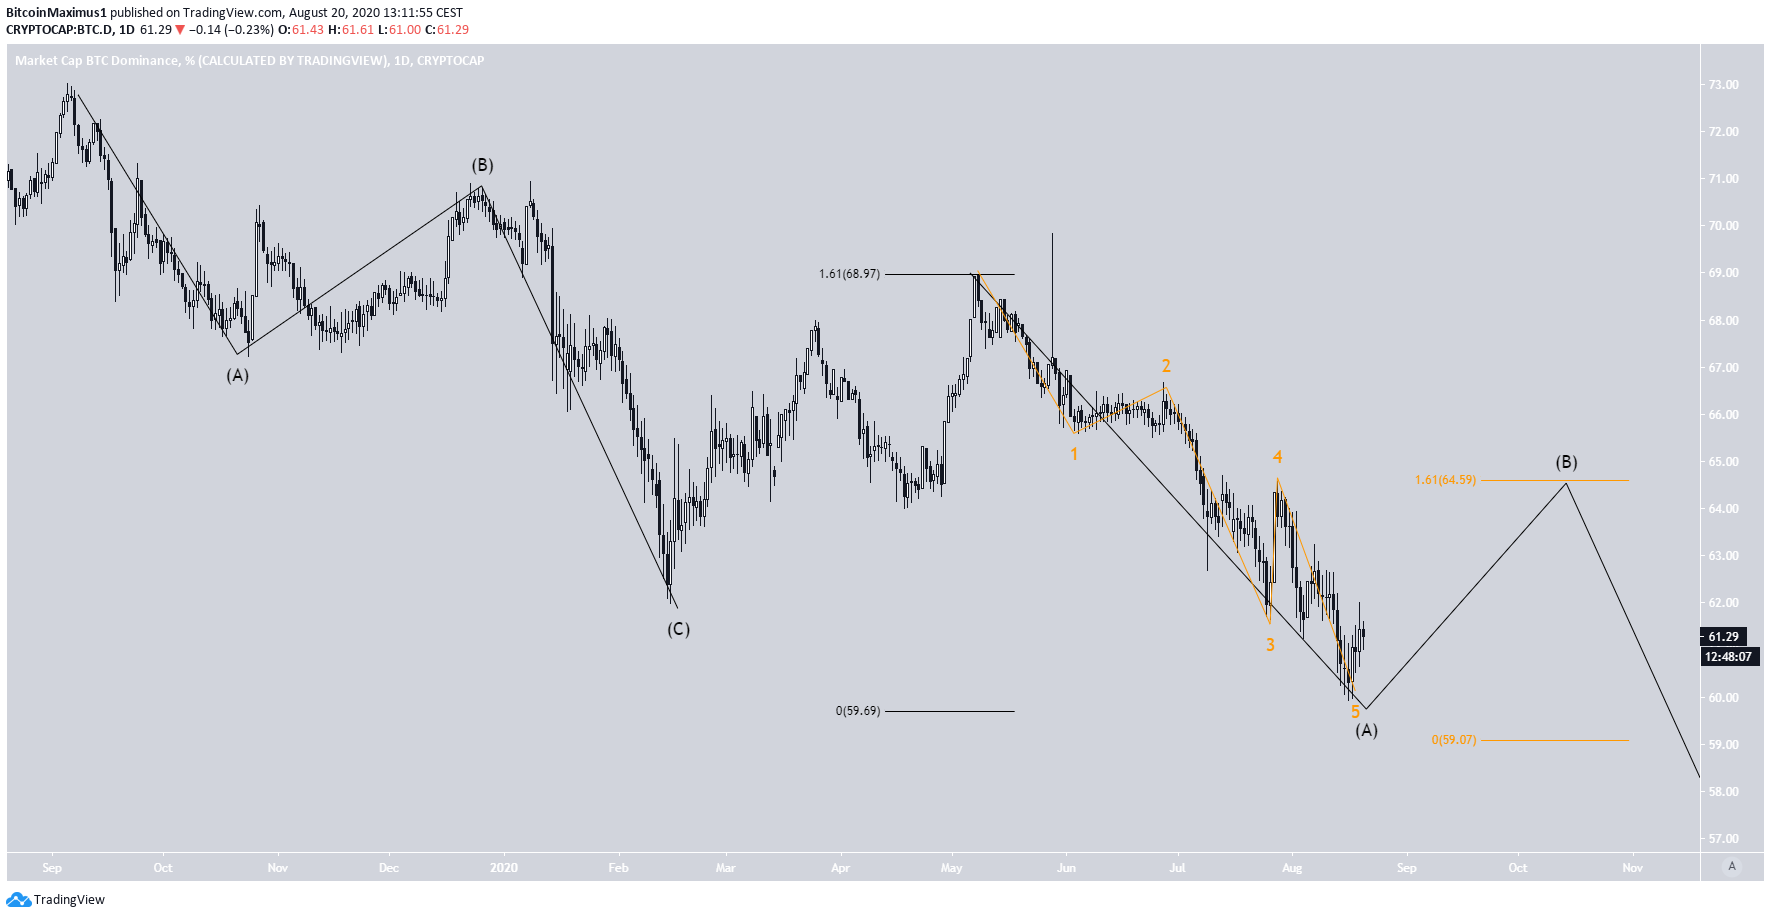
A closer look reveals that the price is trading inside a descending wedge.
There is an overlap between sub-waves 1 and 4 (blue), so this is likely an ending diagonal. The support line of the wedge is found at 59%, further adding to the possibility that the rate will drop there before it begins a move to the upside.

Relationship To BTC
Over the past week, the relationship between BTC (blue) and BTCD (green) has not been entirely clear. Historically, BTC price increases have caused a decrease in BTCD and vice versa. Therefore, a BTC increase would most likely be required for BTCD to fall all the way to 59%.

For BeInCrypto’s latest Bitcoin analysis, click here!


