
The Bitcoin dominance rate (BTCD) has been increasing rapidly since April 29. The rate has reached an important resistance level, a breakout above which would act as confirmation that the trend is truly bullish.
Well-known trader @J0hnnyw00 tweeted a BTCD price chart that shows a possible double-top forming. He has outlined and predicted a downward movement for the dominance rate.
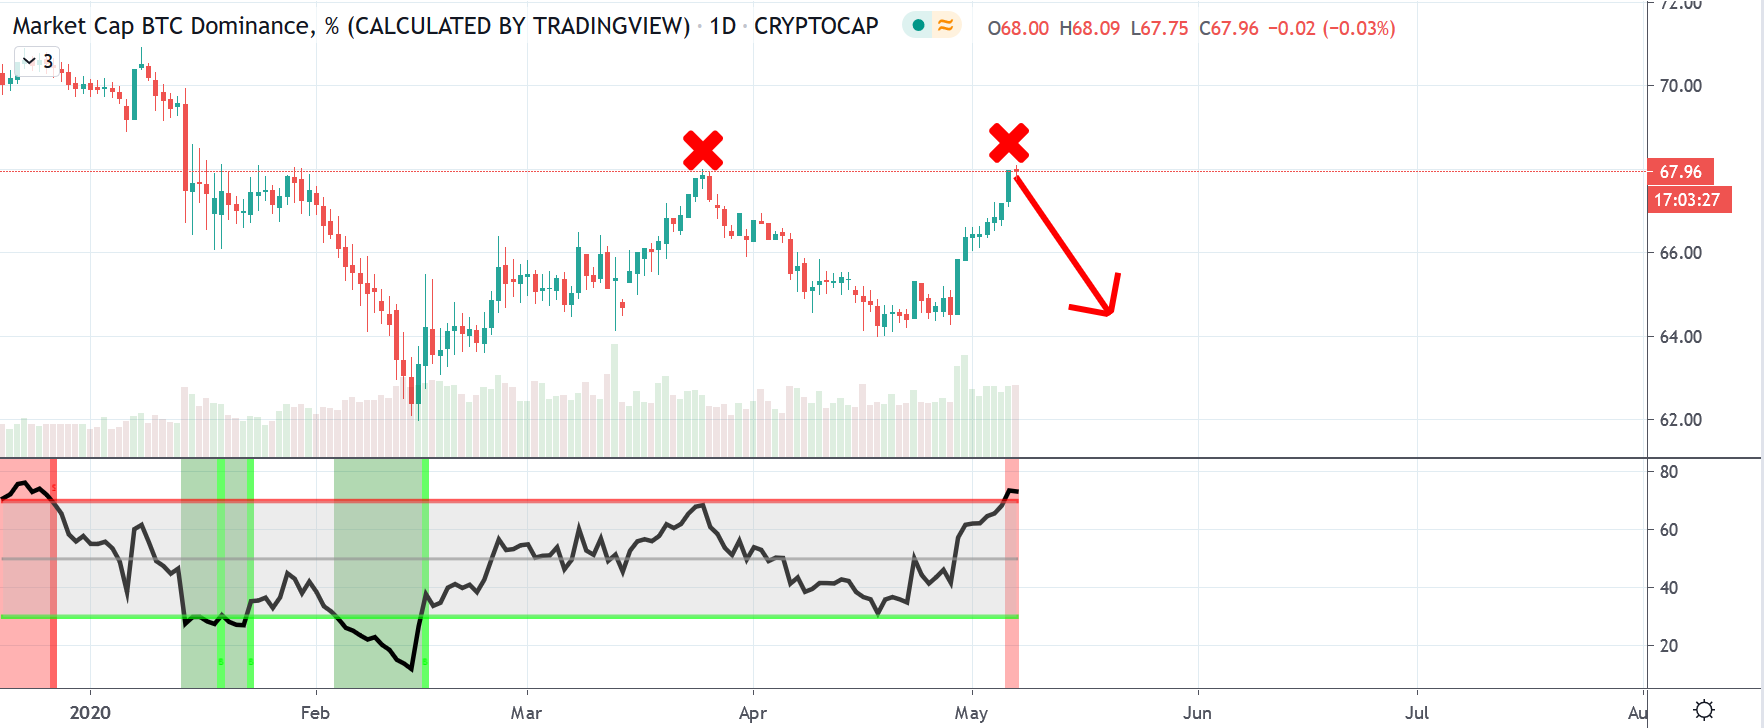
J0hnnyW00 also stated that in order for the possibility of an ‘altseason’ to remain in place, this is the scenario that has to transpire:
We need this scenario to see #altszn otherwise say goodbye to altszn 🙁
Double-Top Bitcoin Dominance
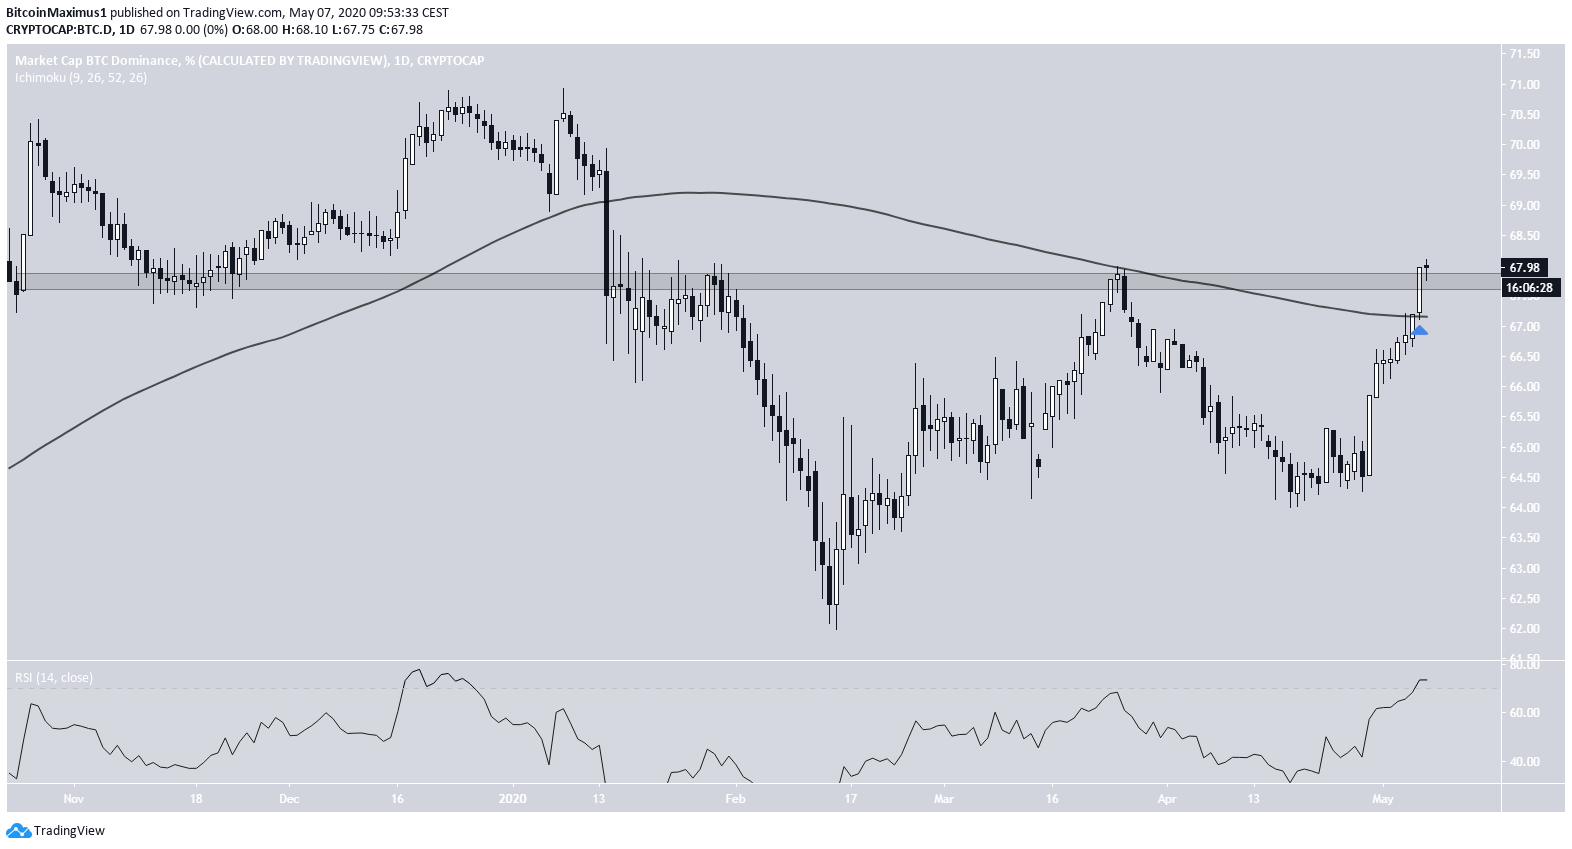
The main resistance area for the BTCD rate is found at 67.5%. At the time of press, the price was trading inside this resistance area, where it has possibly created a double-top relative to the rate on March 13.
Even though the double-top is normally considered a bearish reversal pattern, technical indicators do not show much weakness. There is no bearish divergence in the RSI, even though it is in overbought territory. In addition, the dominance rate has moved above its 200-day moving average (MA), something it had not done since Jan 5.
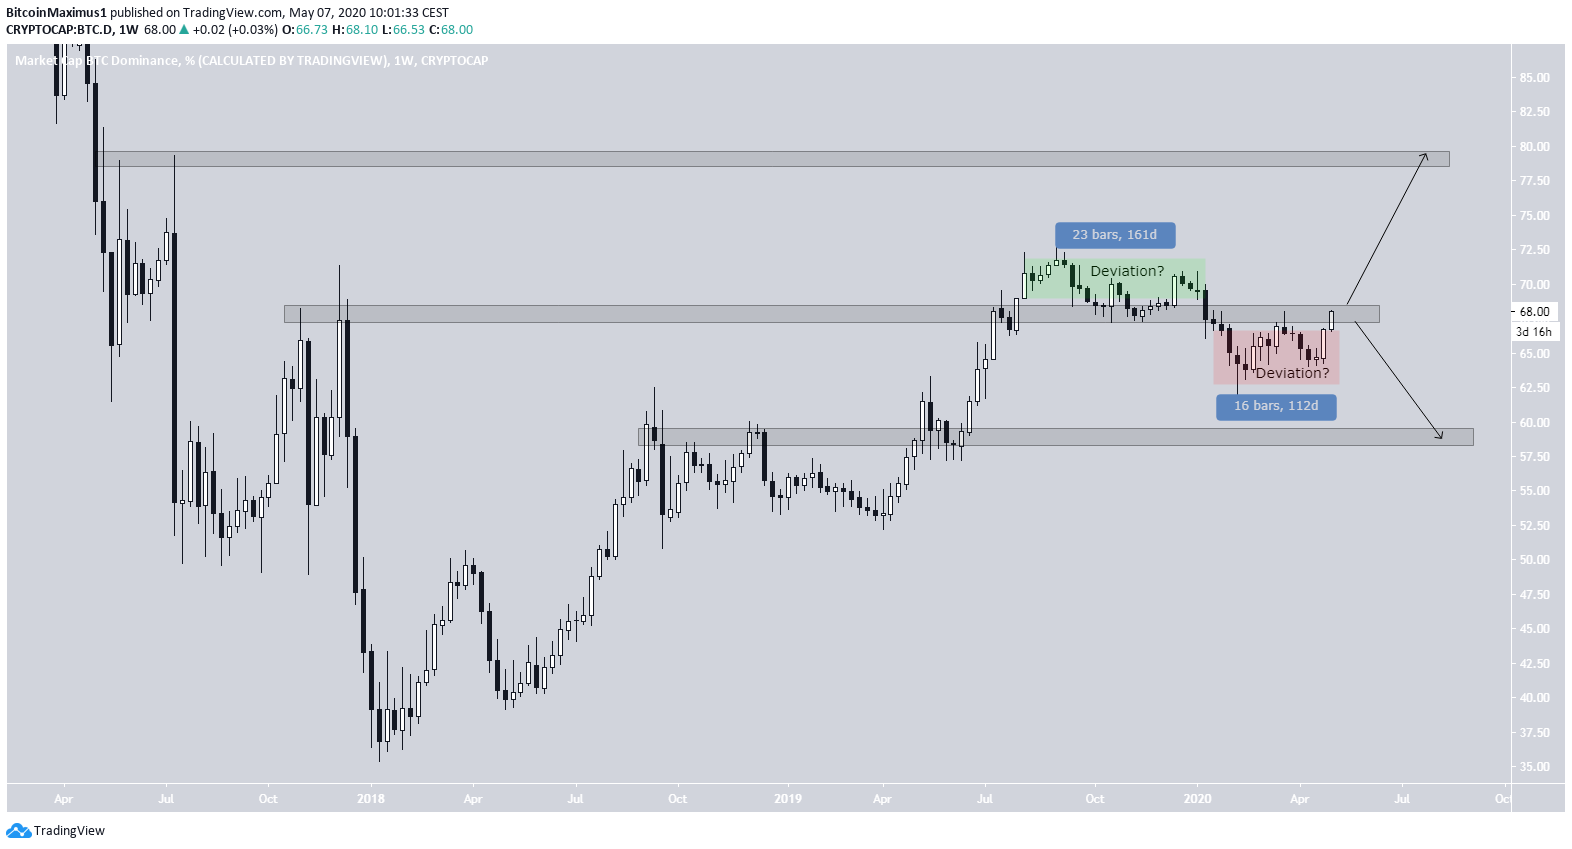
The weekly time-frame better reveals the importance of the 67.5% area. This was the main resistance area in November 2017, and the rate did not approach this level for nearly two years. Afterward, it managed to move above this zone for a period of 161 days beginning in October 2019, only to fall back right below, where it has remained for the past 112 days.
Since there are no obvious bearish signs, it is likely that the movement below was only a deviation and the price will continue moving upwards towards the next resistance area at 80%.
In case the rate does indeed break down, the closest support area is found at 60%.
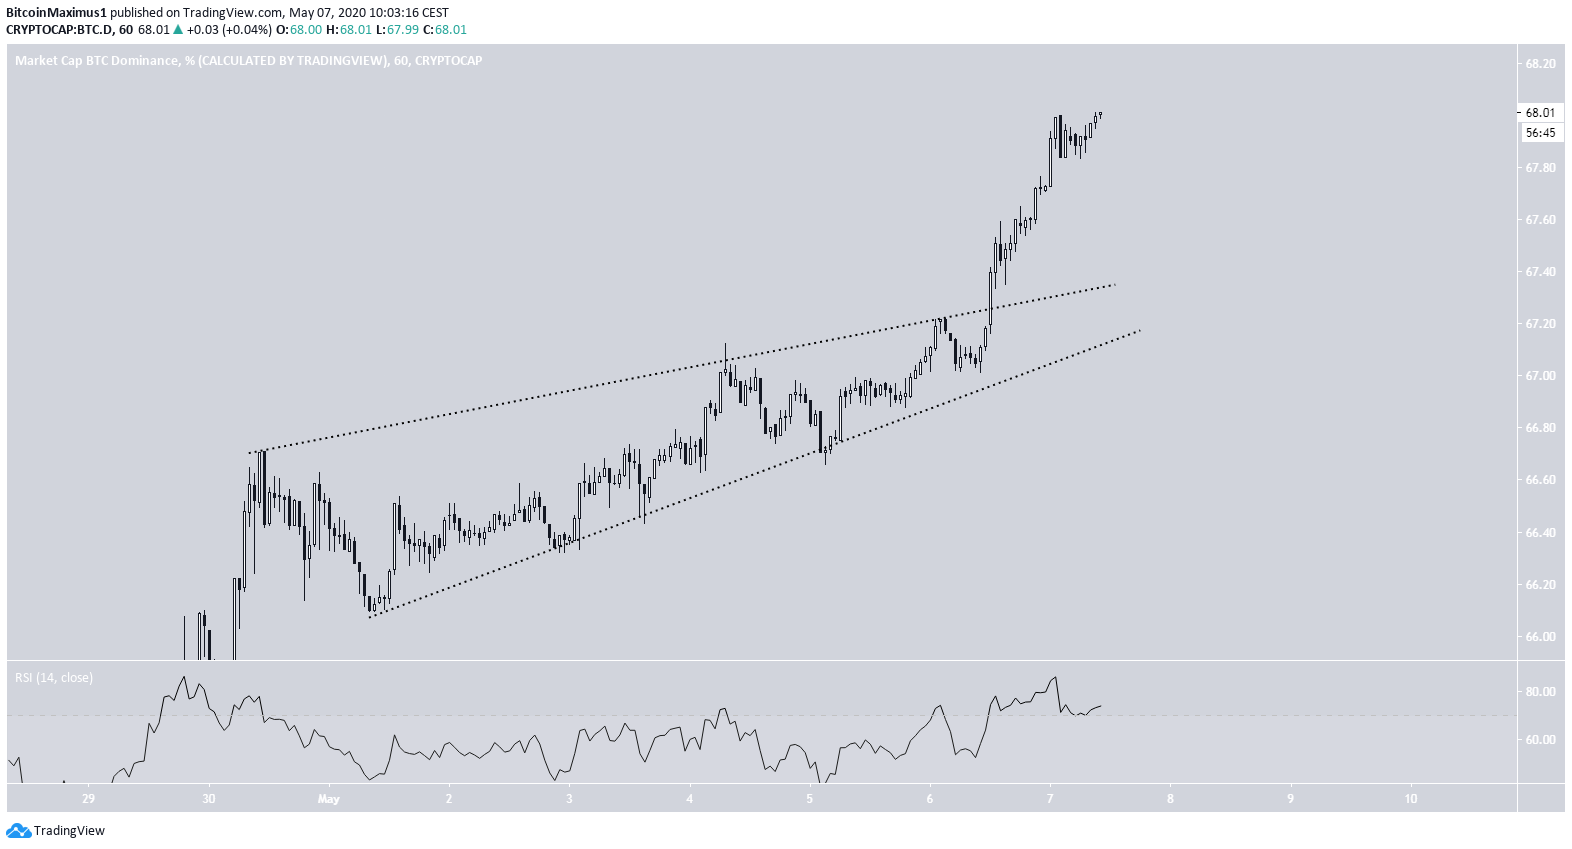
Short-Term Movement
In the short-term, the dominance rate has clearly broken out from an ascending wedge — a major show of strength. In addition, there is no bearish divergence in the RSI.
Therefore, the Bitcoin dominance rate is expected to continue moving upwards.
To conclude, the Bitcoin dominance rate has reached a crucial resistance level, a movement above which would be a major bullish development. Since technical indicators show no signs of weakness, the BTCD is likely to move above this resistance at 67.5%, and gradually increase towards 80%.
