


The Bitcoin price has broken out from a short-term descending resistance line but still has yet to move above its April 30 high.
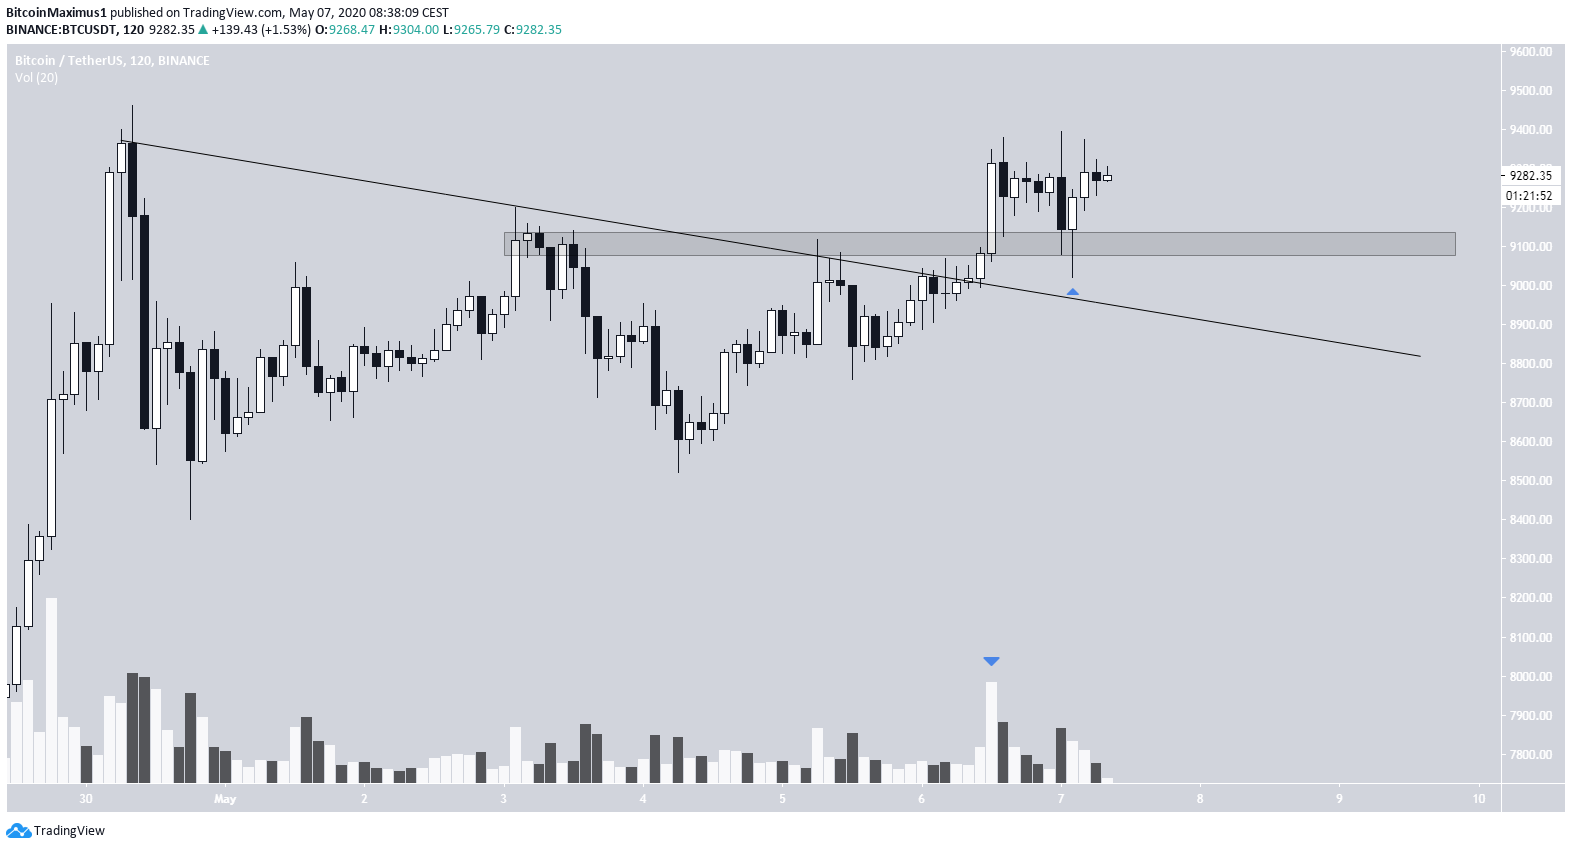
On May 6, the Bitcoin price broke out from a short-term descending resistance line. The breakout occurred with considerable volume, increasing its significance. The price reached a high of $9,380 before beginning to retrace.
During the retracement, the price validated the $9100 level as support, which is the same level BTC just broke out from. The price has been gradually increasing since, creating a long lower-wick in the process.
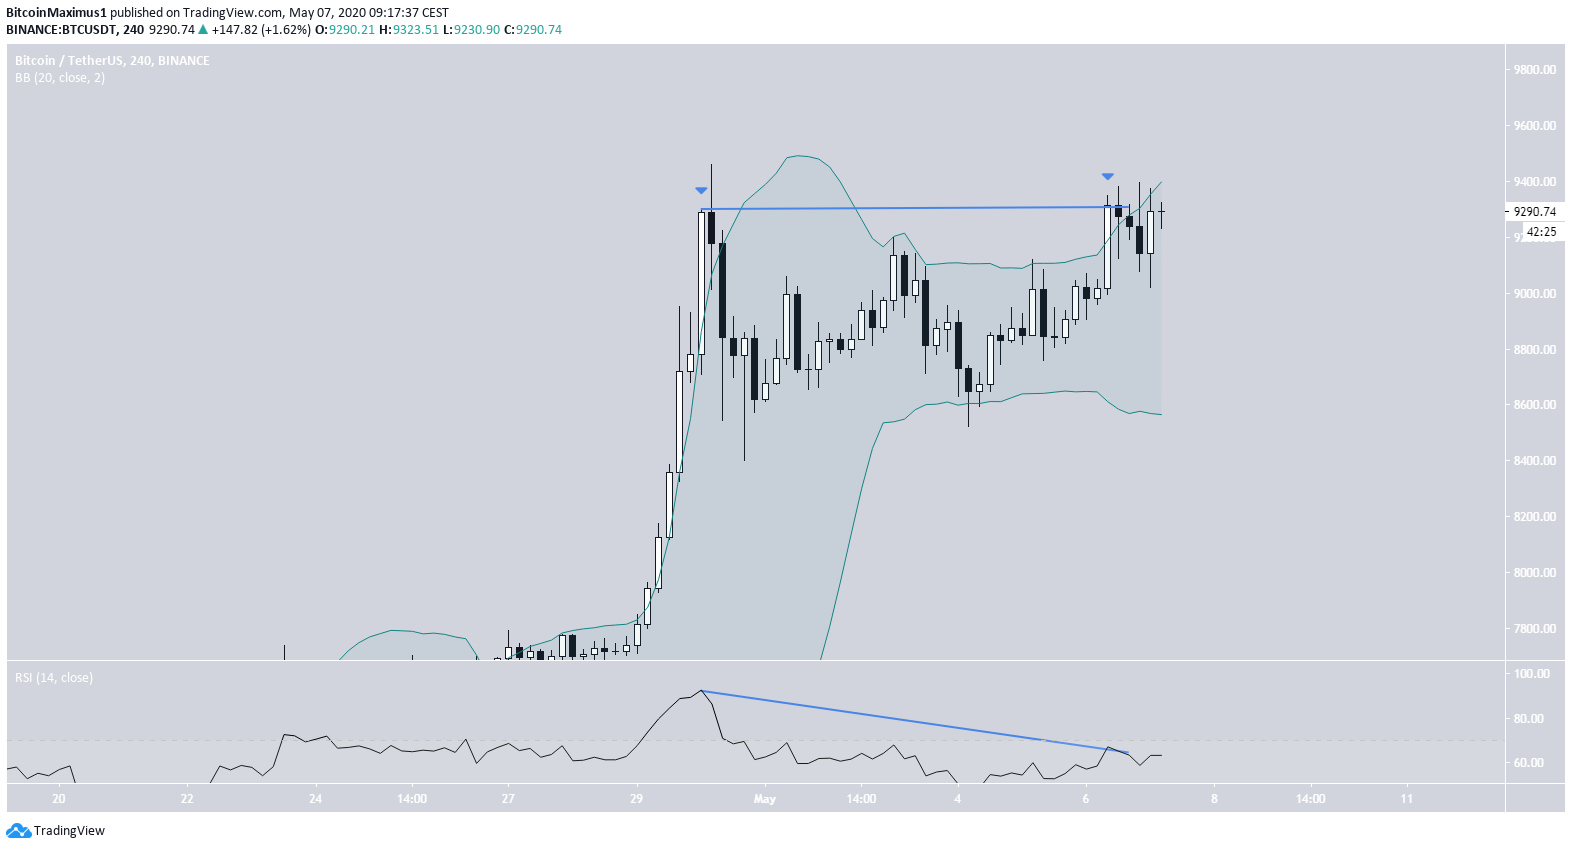
When looking at the price movement since April 30, we can see that BTC has created a double-top at $9,400, which is considered a bearish reversal pattern.
Technical indicators for this double-top are quite bearish. The pattern is combined with a strong bearish divergence in the RSI, and both highs were combined with a move above the upper Bollinger band. This occurrence caused a reversal in the April 30 high, and it is possible that the same thing will transpire this time around.
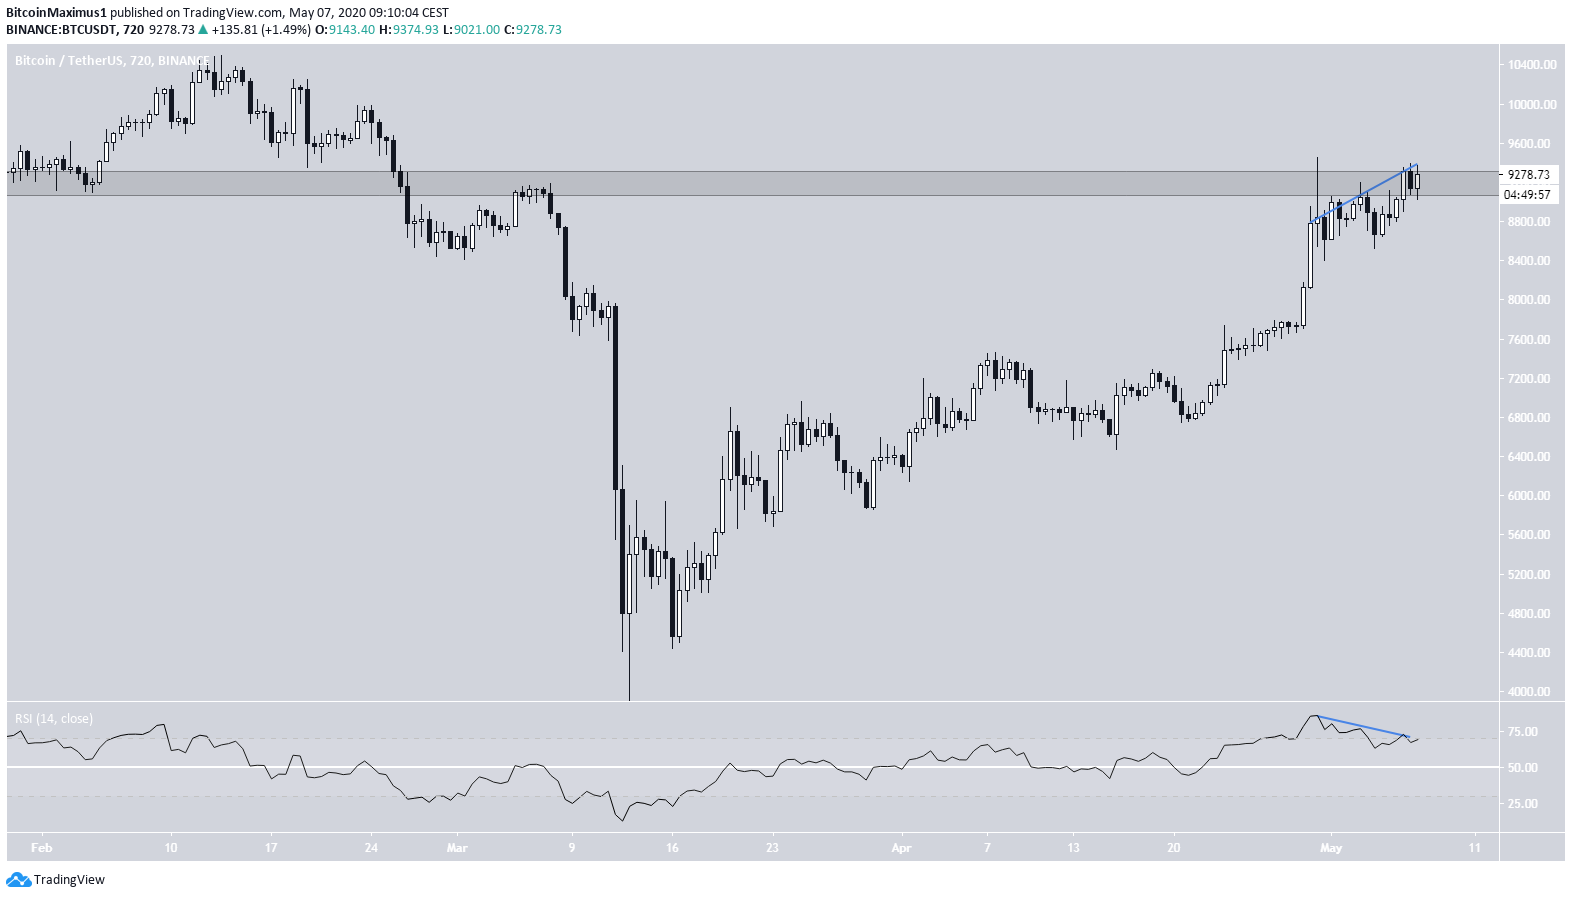
Bitcoin Resistance Zones
When looking at a higher time-frame, we can see that the price is trading inside the $9,200-$9,300 resistance area. In addition, it has been generating considerable bearish divergence since the April 30 high. All these signs complement each other and suggest that the BTC price is likely to eventually move downwards.
This view is also supported by the considerably long upper-wick created on April 30. The price has yet to reach a close above this wick high.
To conclude, the Bitcoin price has broken out above a short-term descending resistance line. However, the ensuing breakout has taken the price right to a higher time-frame resistance level, where the price has created a double-top and is showing weakness. The Bitcoin price is expected to decrease from here.
For those interested in BeInCrypto’s previous Bitcoin analysis, click here.


