


Even though the Bitcoin Dominance Rate (BTCD) has been increasing over the past week, it has yet to move above a crucial resistance level, below which the trend is still considered bearish.
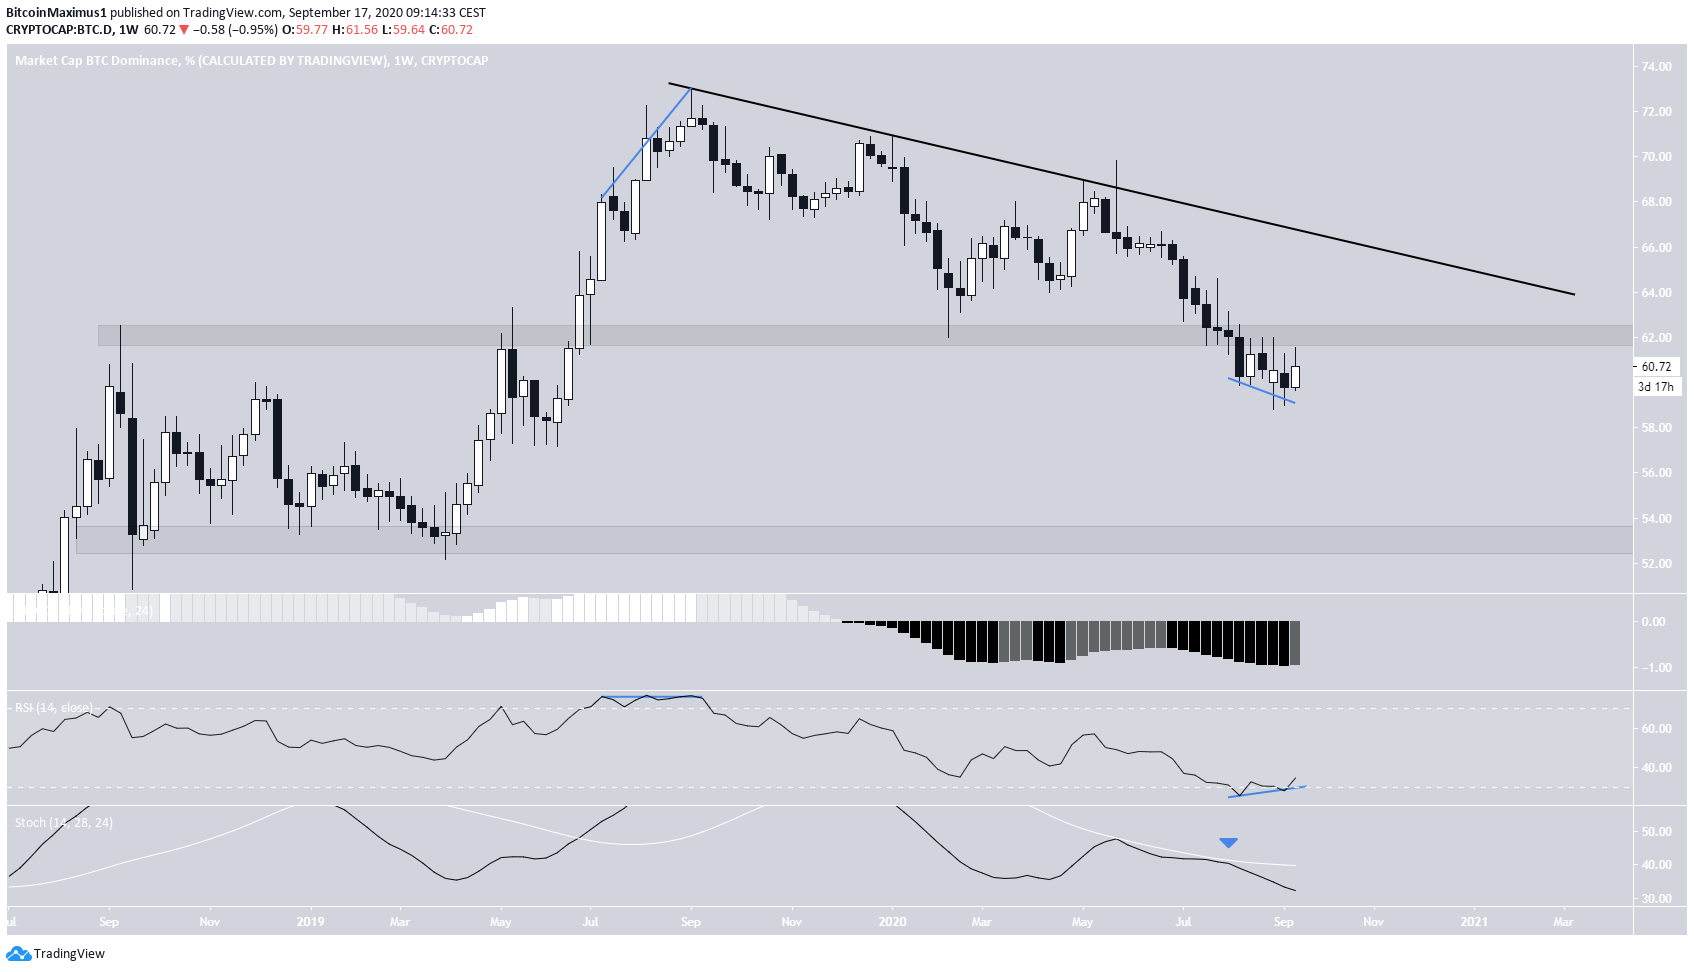
In September 2019, the BTCD reached a high of 73.02% but has been decreasing under a descending resistance line since.
The rate has now fallen below the 62% area, a zone which acted as resistance twice in 2018 and 2019 and afterward as support in January 2020.
Bitcoin Dominance in a Tough Spot
If the BTCD does not reclaim this area, it would suggest that it has fallen back within its previous range and could decrease all the way to 53%.
Technical indicators show some signs of reversal. There is a bullish divergence in the weekly RSI, which is also inside its oversold region. The last time there was divergence, albeit bearish, the rate had just reached the aforementioned top of 72% and began the current decrease. However, that was a triple divergence, while the current occurrence is a double.
Neither the MACD nor the Stochastic Oscillator is giving any signs of a reversal. On the contrary, the latter has rejected a bullish cross.
Strong Resistance Overhead
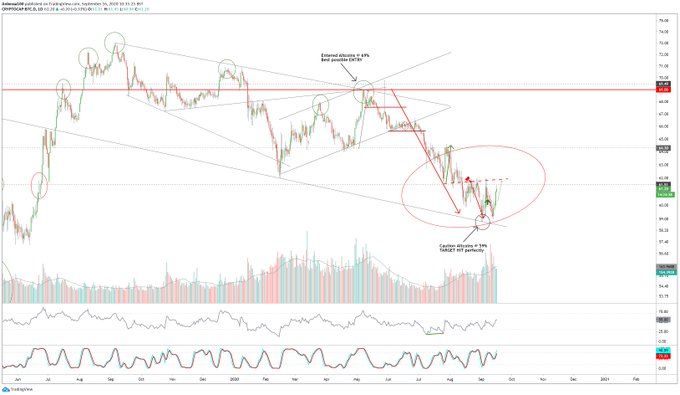
Cryptocurrency trader @anbessa100 outlined a Bitcoin dominance chart which shows that the rate has been moving upwards since it reached a low of 59% last week. However, she predicts that the rate will soon hit resistance and decrease.
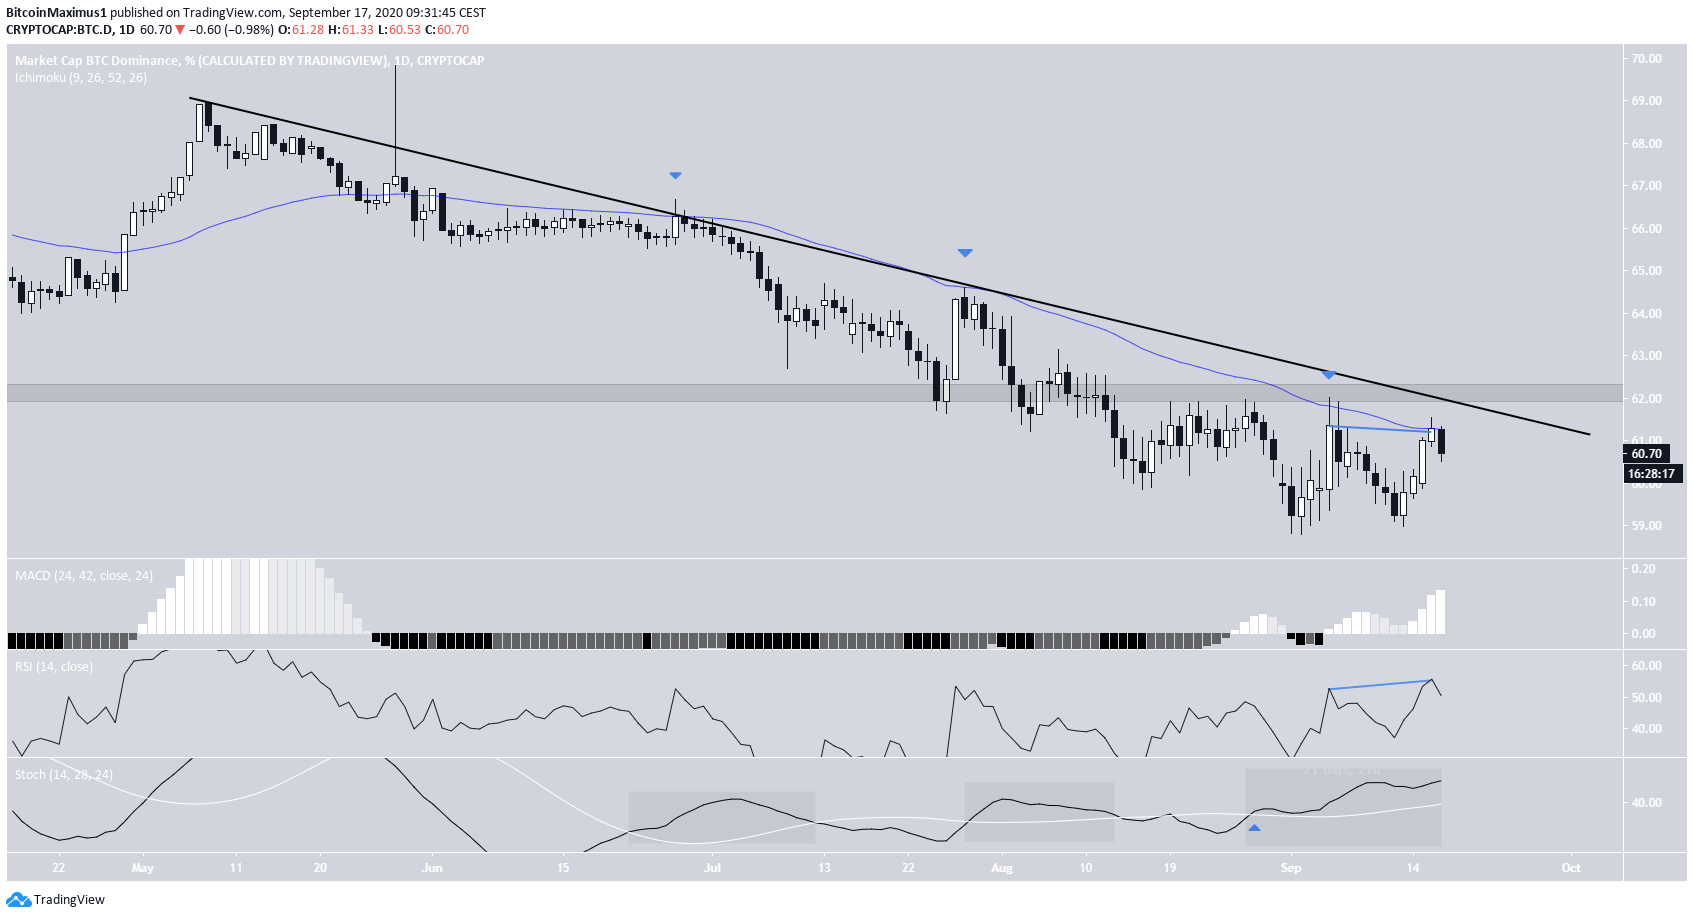
The Bitcoin dominance rate has also been following a shorter-term descending resistance line, which has been in place since May. The line is also strengthened by the 50-day moving average (MA), which has rejected the rate five times up to this point.
Technical indicators are mixed. The Stochastic Oscillator has made a bullish cross and is increasing, but similar occurrences in the past two months have not yielded any significant gains. The RSI has generated some hidden bearish divergence.
Therefore, there is no sufficient data to indicate that a reversal is likely to transpire.
Relationship To BTC
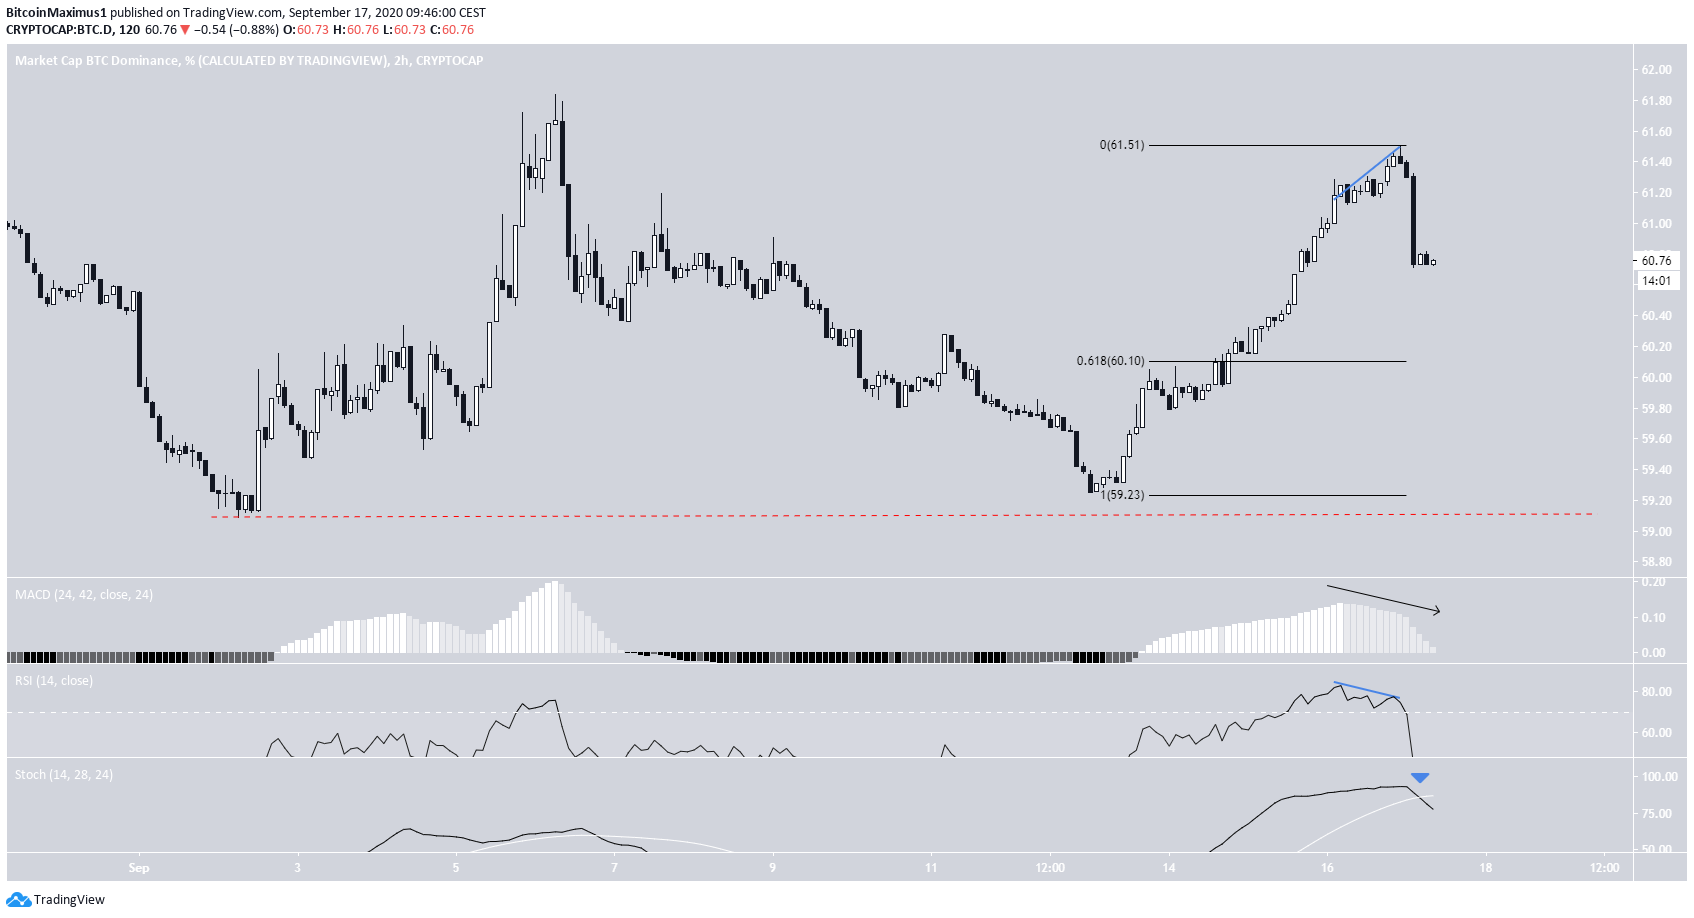
The shorter-term chart is bearish. The BTCD has begun to decrease after the RSI generated bearish divergence. The MACD is also decreasing and the Stochastic Oscillator has made a bearish cross.
If the 0.618 Fib level of the recent increase (60.10%) does not hold, it would greatly reduce the chances of the upward movement resuming, while a decrease below 59% would almost confirm that the rate is going lower.
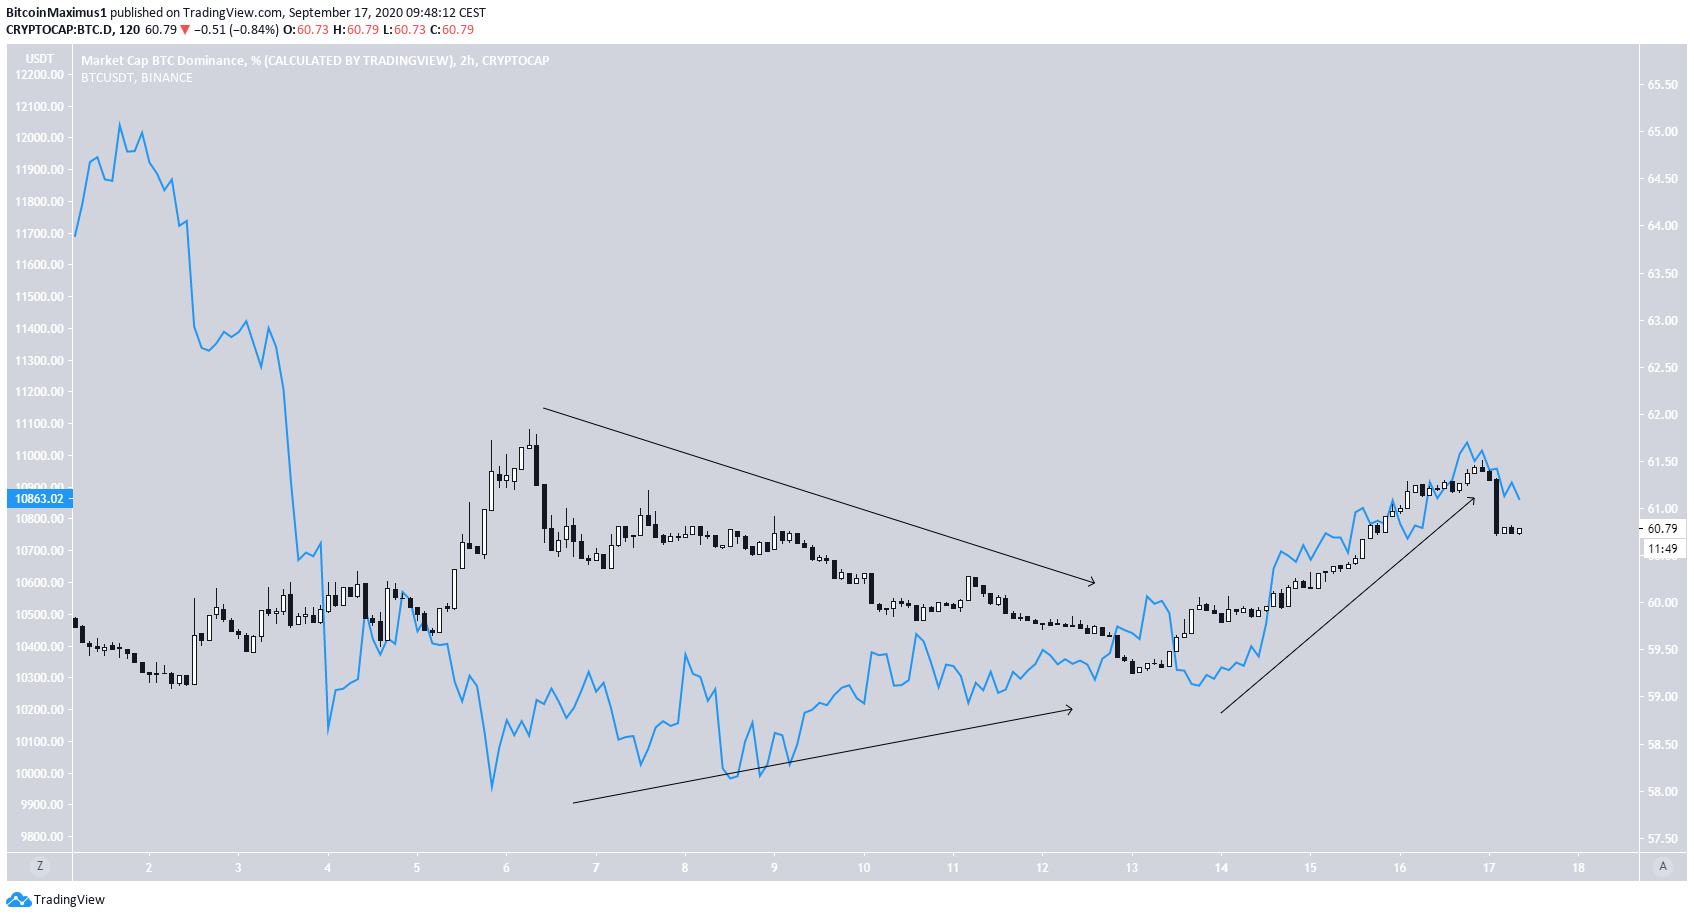
Since the rapid decrease at the beginning of September, the BTCD has been gradually decreasing while the price has moved upwards.
However, since BTC started increasing at an accelerated rate, the BTCD also began to increase.
This is a common occurrence, in which sharp movements in the BTC price cause the BTCD to increase, while price consolidation causes it to decrease.
The Bitcoin price is shown in the chart below in blue:
To conclude, the Bitcoin dominance rate is expected to hit resistance soon and reverse its bullish trend.
For BeInCrypto’s latest Bitcoin (BTC) analysis, click here!


