


The long-term chart for the Bitcoin dominance rate reveals weakness and suggests that the rate will fall. However, lower-term timeframes reveal a bullish pattern that indicates an upward move will transpire initially.
The Bitcoin dominance rate has been gradually decreasing since September 5, when it reached a high of 73.44 percent. This has caused numerous traders and influences to call for the beginning of “Altseason” — but, until now, the calls have all been premature.
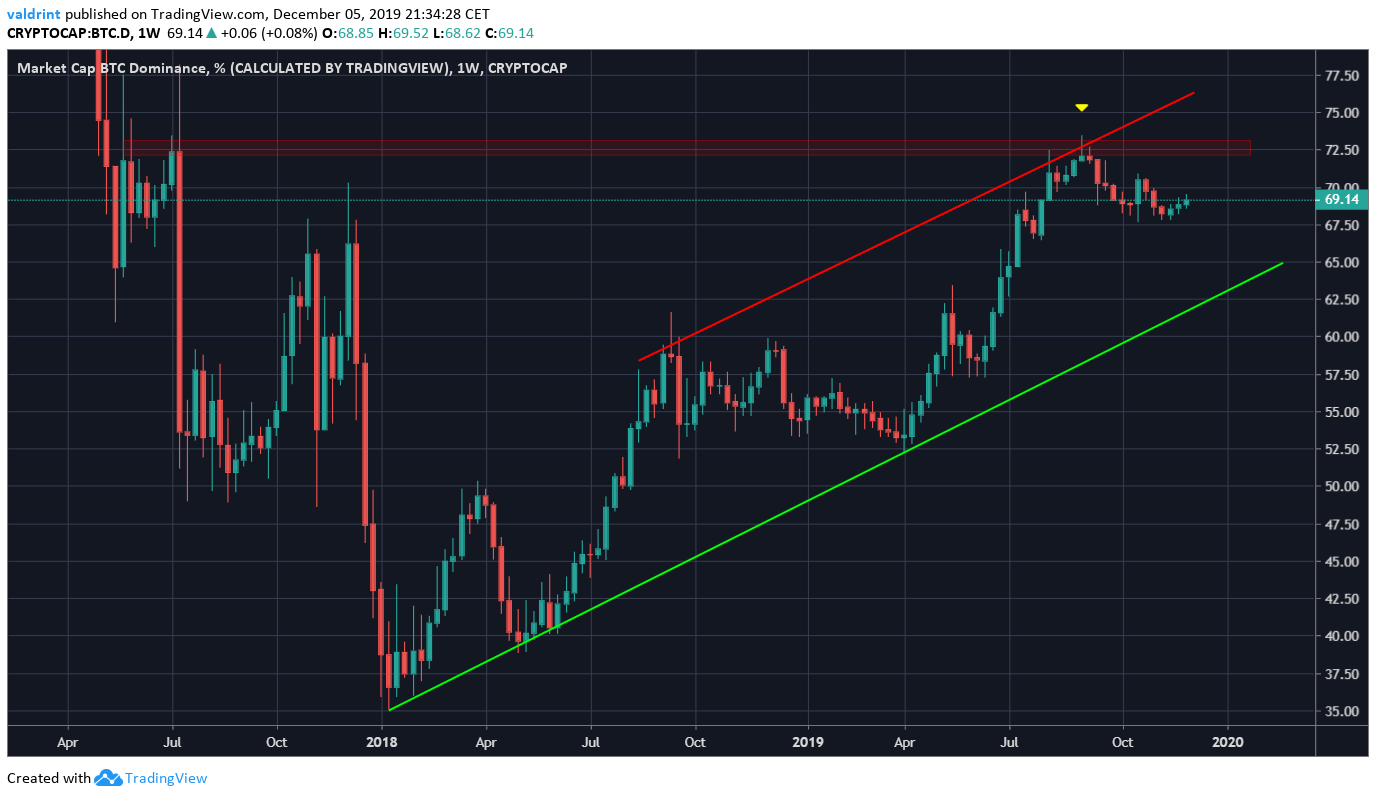
Cryptocurrency analyst @davthewave stated that the monthly Bitcoin dominance chart is mired in an ascending wedge and will likely break down soon.
Monthly MACD re-set on Bitcoin dominance, and starting to roll over. Not long now… pic.twitter.com/x6r2h6TZ2G
— dave the wave🌊🌓 (@davthewave) December 5, 2019
Additionally, the monthly MACD seems to be turning downward, suggesting that a period of decrease awaits.
Below, we will analyze the dominance rate in different time-frames alongside technical indicators.
Bitcoin Dominance in an Ascending Channel
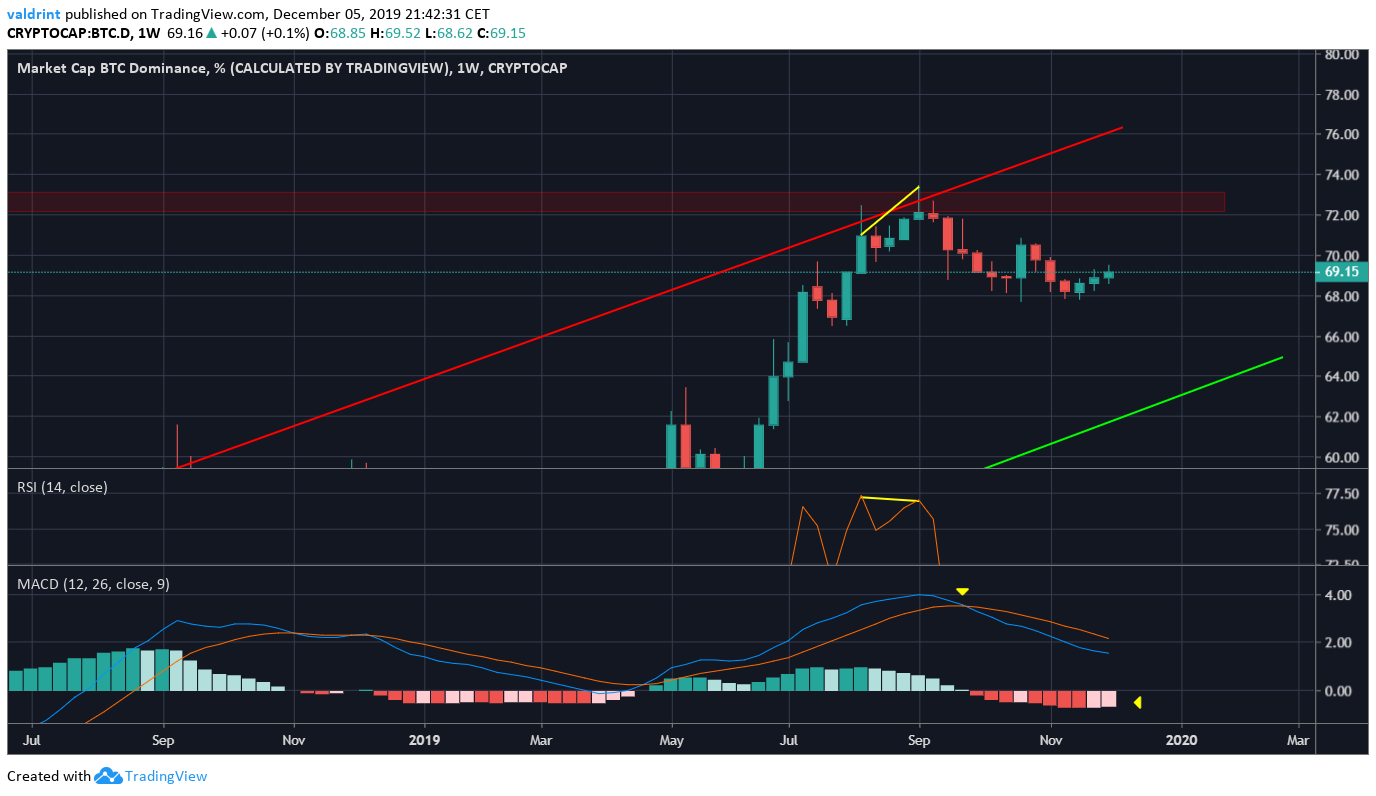
The tweet already presented the loss of strength in the monthly MACD. Therefore, we will use the weekly time-frame to try to give a more exact date on when the breakdown might occur.
Lower time-frames reveal what looks more like an ascending channel rather than a wedge. Once the rate reached the 72.5 percent resistance area, which was the high during the summer of 2017, it began its current decrease.
The high was combined with a slight bearish divergence in the RSI. A more interesting development was the bearish cross that followed in the weekly MACD.
As we recall from the tweet, the monthly MACD has begun to show some weakness. The current bearish cross from the lower time-frame was the probable catalyst. If the MACD continues falling, it will soon decrease below 0, causing the monthly MACD to also rollover as a result.
Adam and Eve
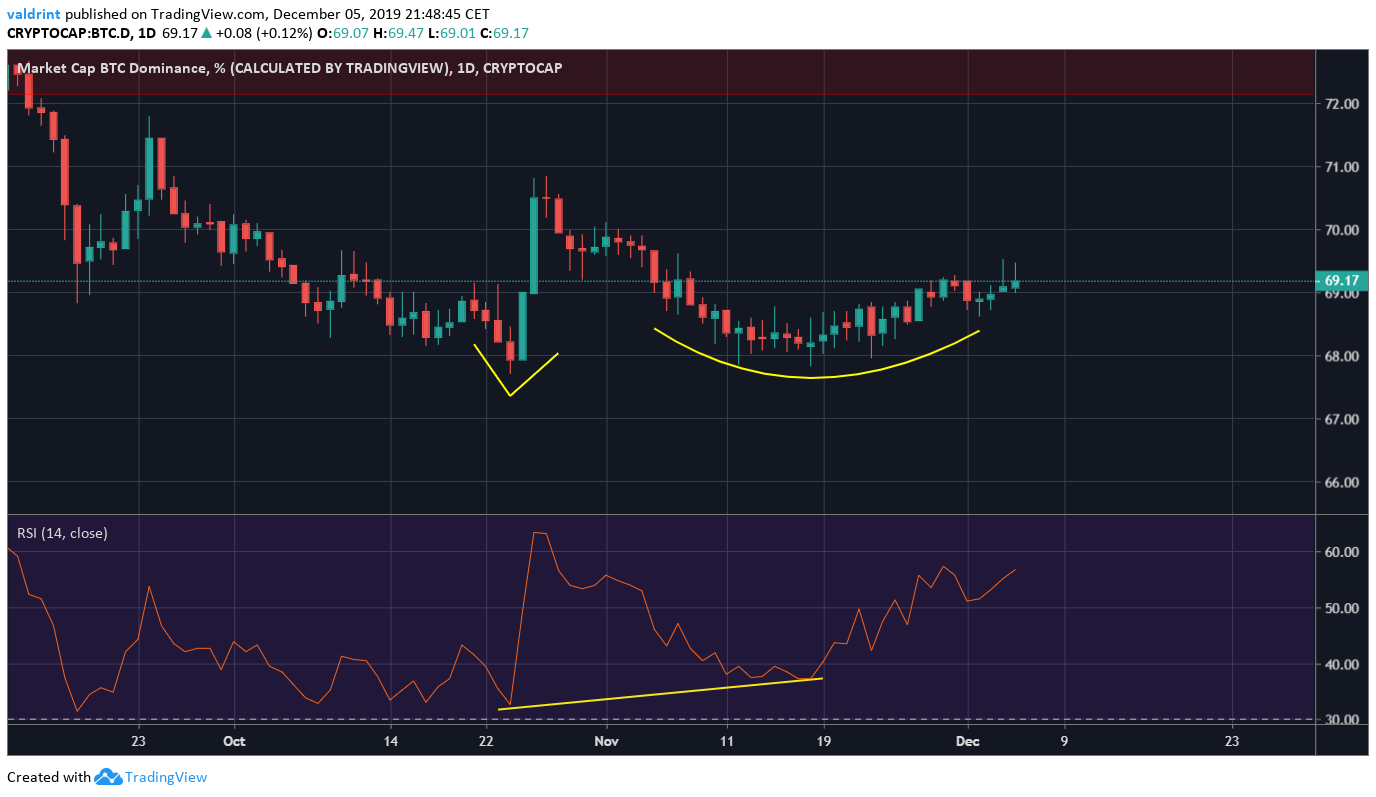
Interestingly, the daily time-frame reveals a bullish outlook, since a double bottom of the Adam and Eve variety has developed. This is considered a bullish pattern and is combined with bullish divergence in the RSI.
Therefore, this suggests that an upward move towards the resistance area of 72.5 percent is to be expected — possibly moving higher to touch the resistance line of the channel.
To conclude, while the long-term outlook for the Bitcoin dominance rate looks grim, lower time-frames reveal that an upward move is anticipated before the possible capitulation.
Disclaimer: This article is not trading advice and should not be construed as such. Always consult a trained financial professional before investing in cryptocurrencies, as the market is particularly volatile.


