


The Bitcoin Dominance Rate (BTCD) broke out from a descending resistance line on May 11 and has been moving upwards at an accelerated rate since then.
BTCD reached a low of 39.2% in Jan 2022, bouncing at the 40% long-term support area for the third time (green icons). It has not reached a low below this level since early 2018. The bounce has so far led to a high of 46.90% on May 27.
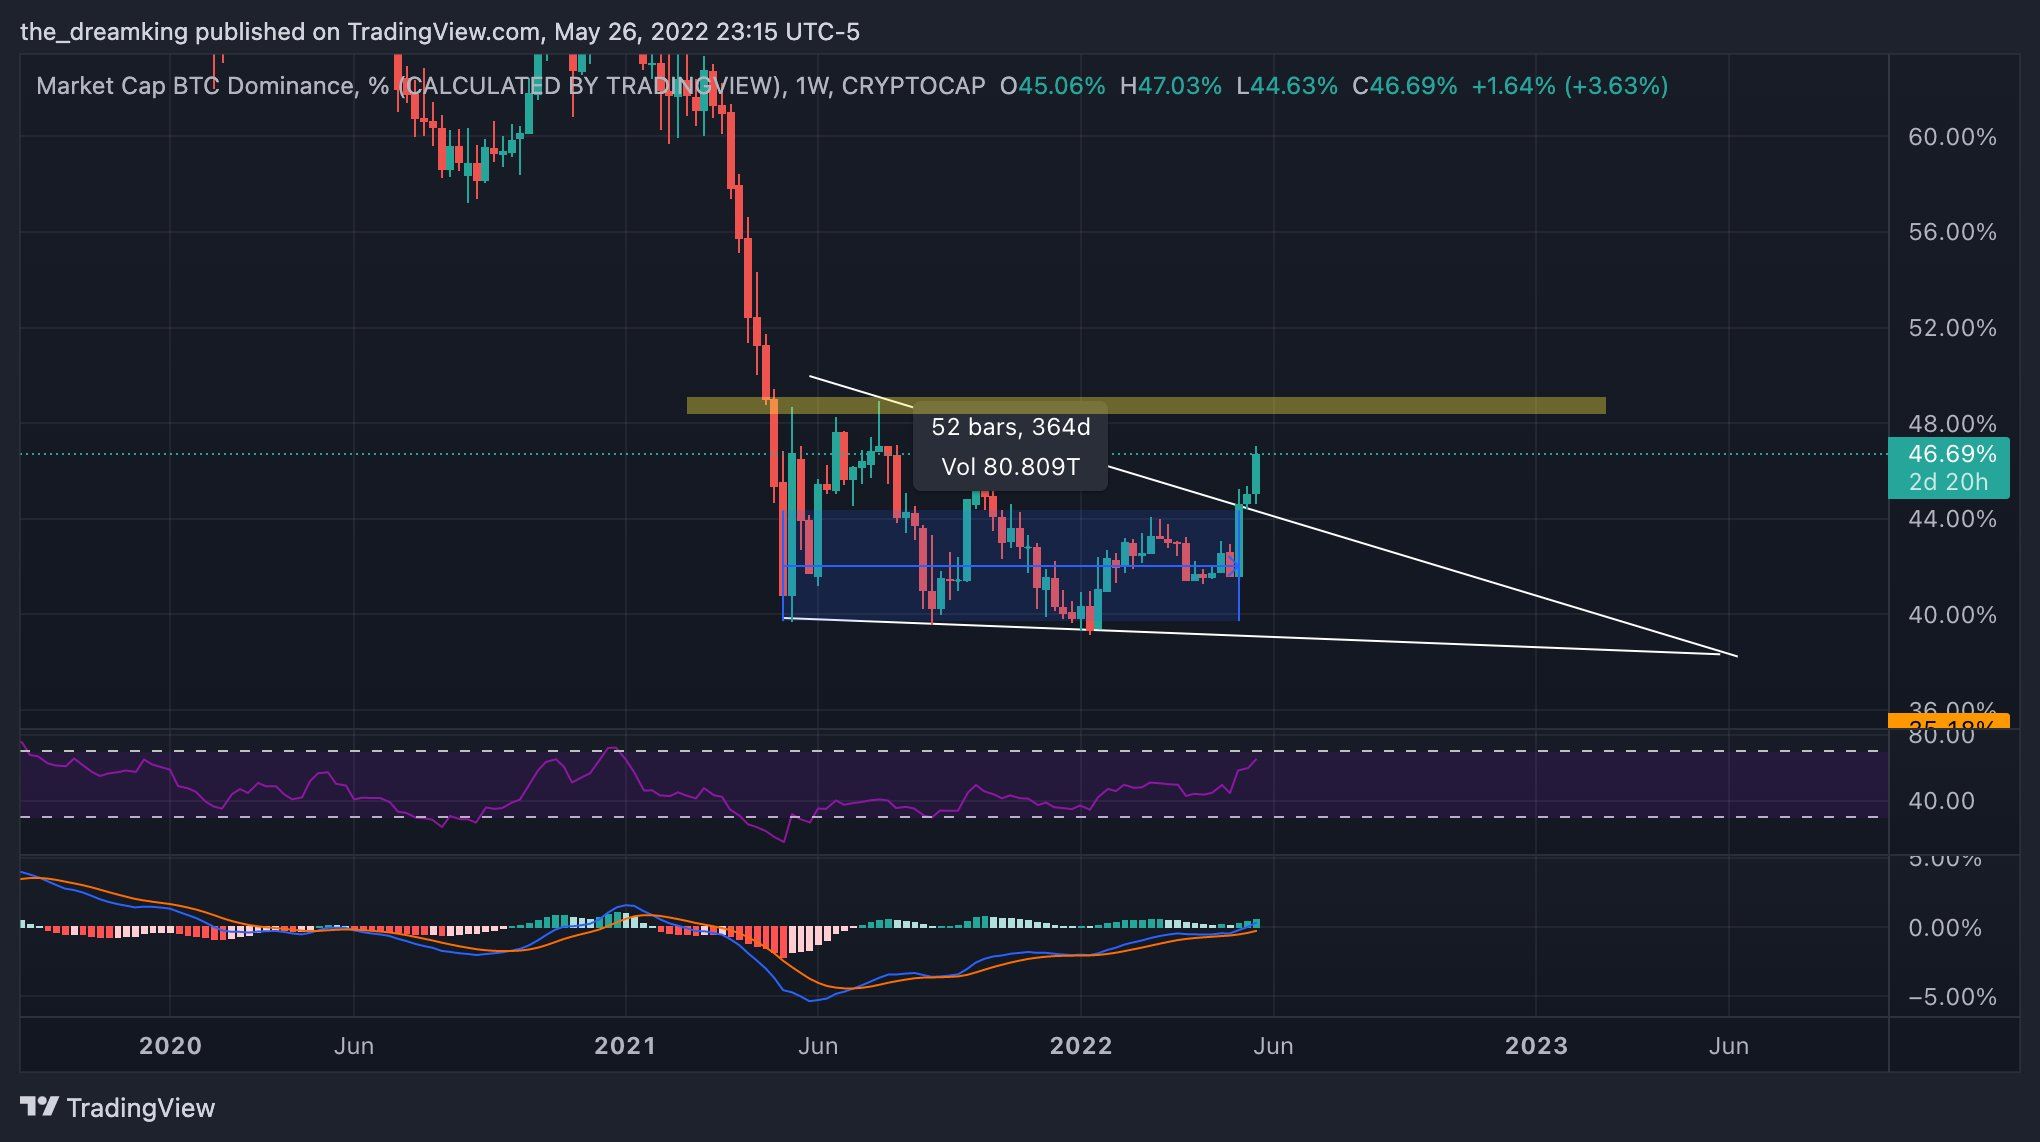
This movement created a triple bottom, which is considered a bullish pattern. The pattern gains more significance since it was created inside a long-term support area.
Additionally, the pattern was combined with a very strong bullish divergence in the weekly RSI (green line). This is a strong sign of a bullish reversal. Furthermore, the RSI has now moved above 50, after staying below it for 483 days. This is a strong sign of a bullish trend reversal.
The next closest resistance area is at 52.30%, crated by the 0.382 Fib retracement resistance level.
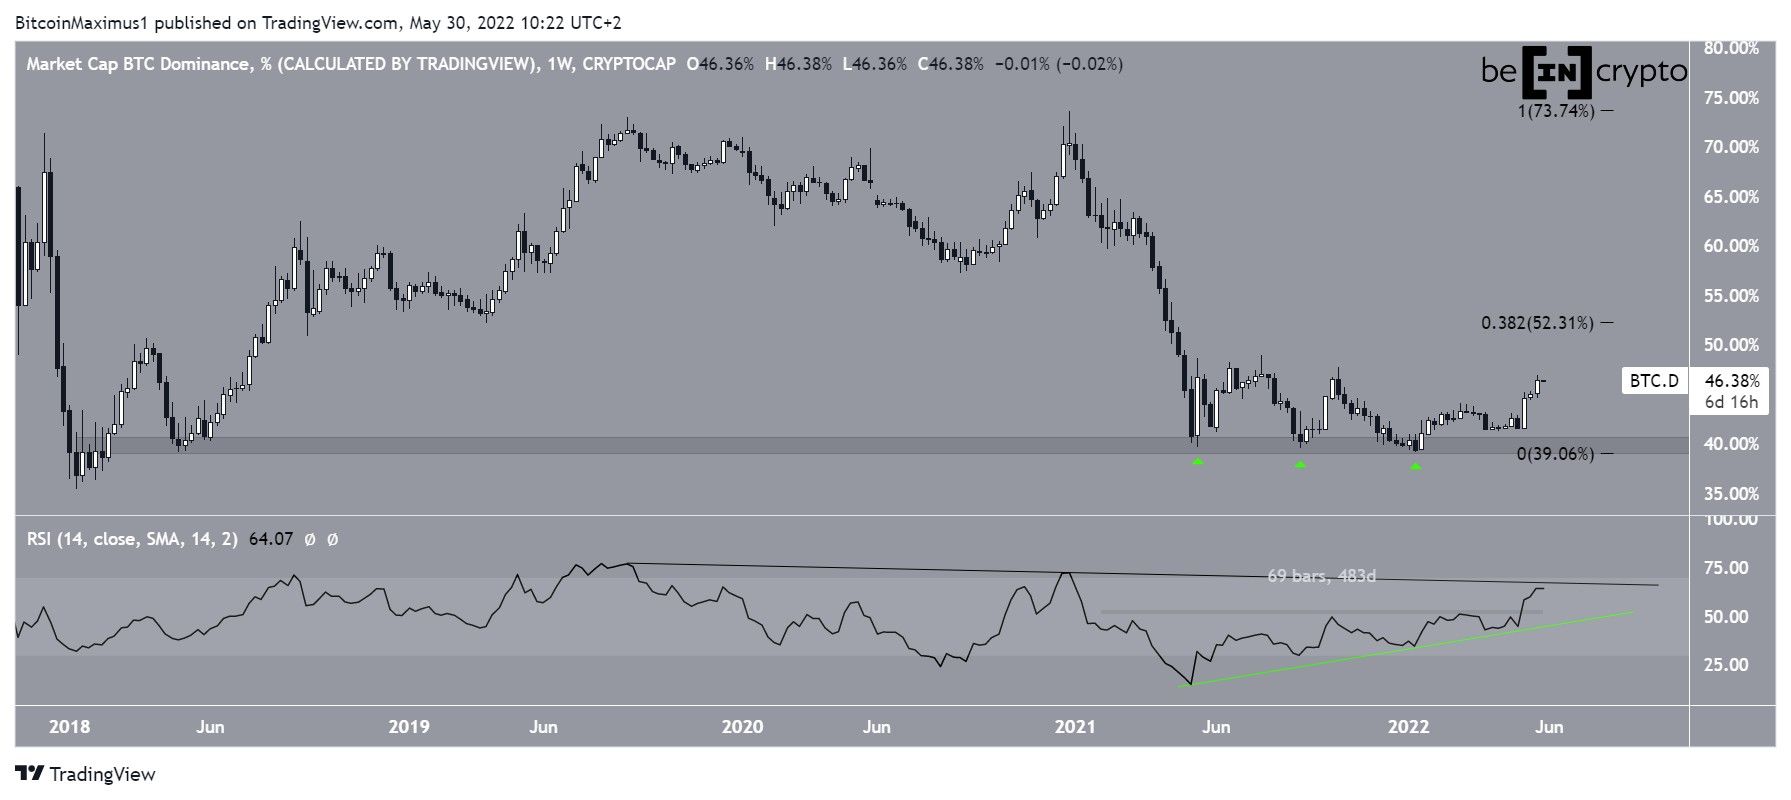
To sum up, due to the creation of a bullish pattern and the bullish reading from the RSI, the weekly chart suggests that a bullish trend reversal is underway.
Future BTCD movement
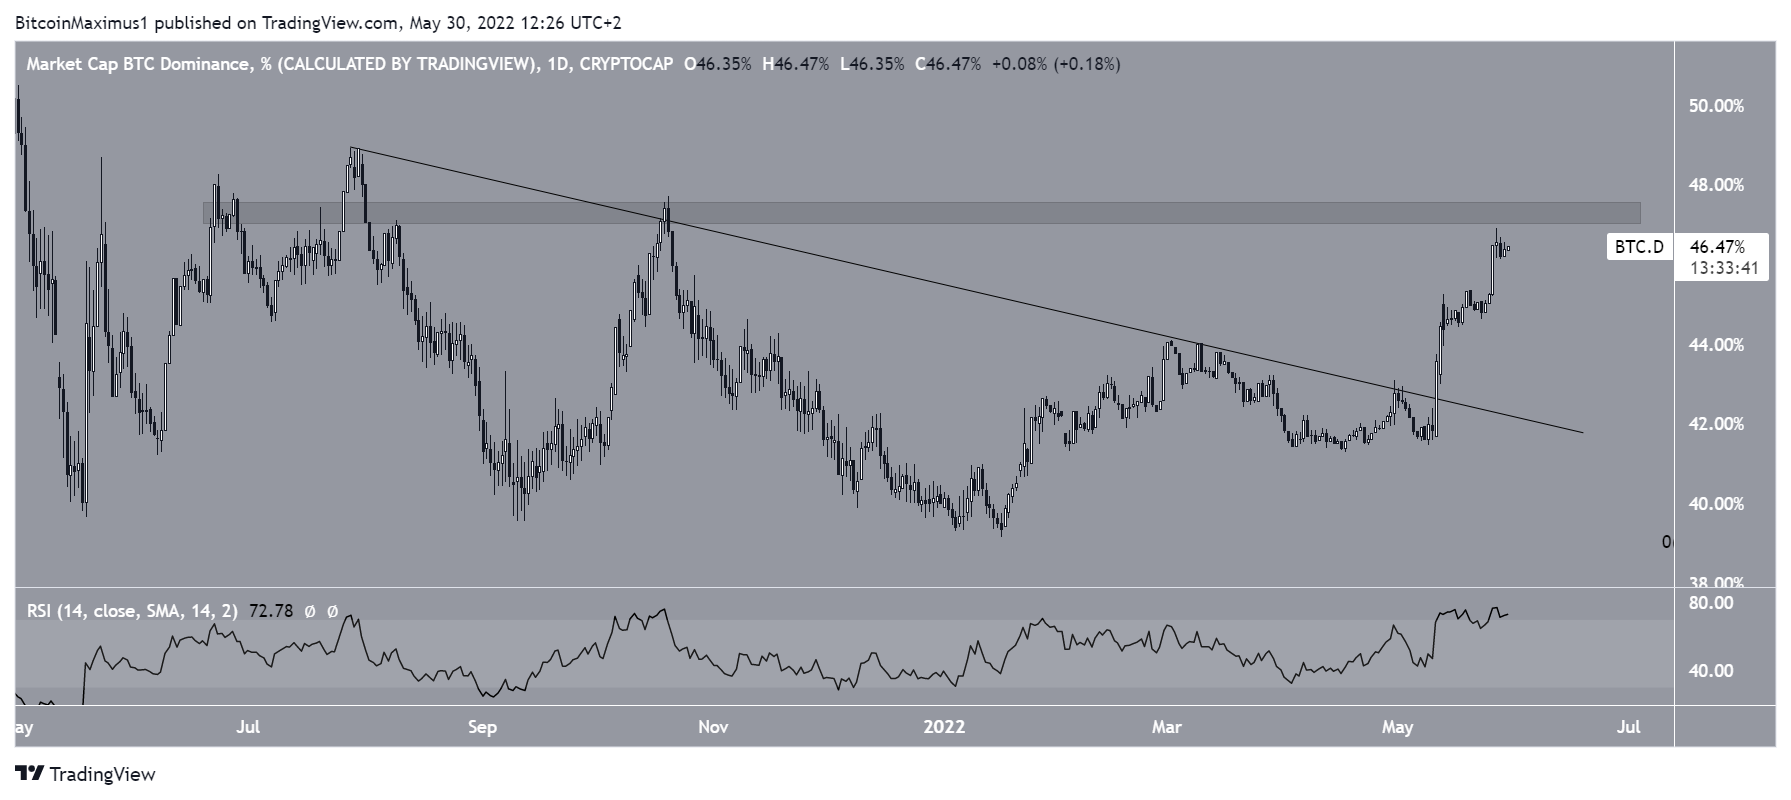
Cryptocurrency trader @Snakecase_ tweeted a chart of BTCD which shows that the rate has broken out from a descending resistance line.
The breakout is visible in the daily time frame and occurred on May 11. Currently, BTCD is approaching the main resistance area at 47%.
While the RSI is overbought, it has yet to generate any sort of bearish divergence. This suggests that the upward movement could continue.
A breakout above the 47% area would be expected to accelerate the rate of increase.
ETH/BTC
Since Ethereum (ETH) is the largest altcoin ranked by its market capitalization, its movements have a large effect on BTCD. As a result, it is worth analyzing the ETH/BTC chart in order to determine if it aligns with the dominance rate reading.
The ETH/BTC chart is bearish since the price has broken down from an ascending parallel channel. The channel had previously been in place for one year prior to the breakdown.
While ETH is currently just above the 0.382 Fib retracement support level at ₿0.06, breakdowns from such long-term structures usually lead to longer downward movements.
Additionally, the weekly RSI has now fallen below 50 (red icon). The previous time the RSI dropped below 50 was on Sept 18 and a drop of 76% followed afterward.
So, if the downward movement continues, the closest support area would be at ₿0.043. This is the 0.618 Fib retracement support level.
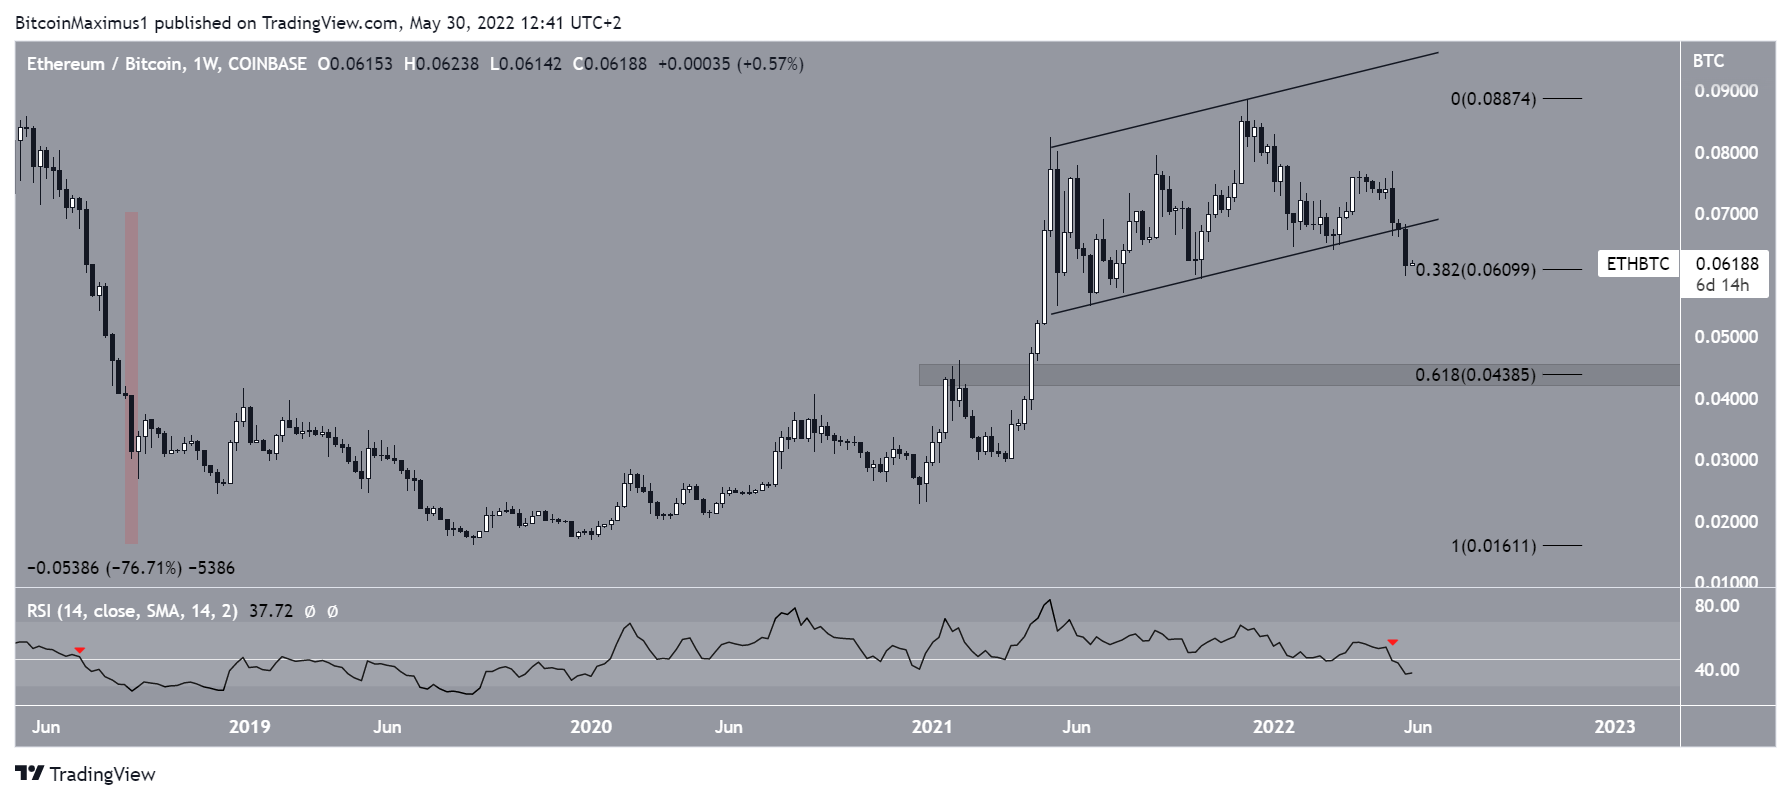
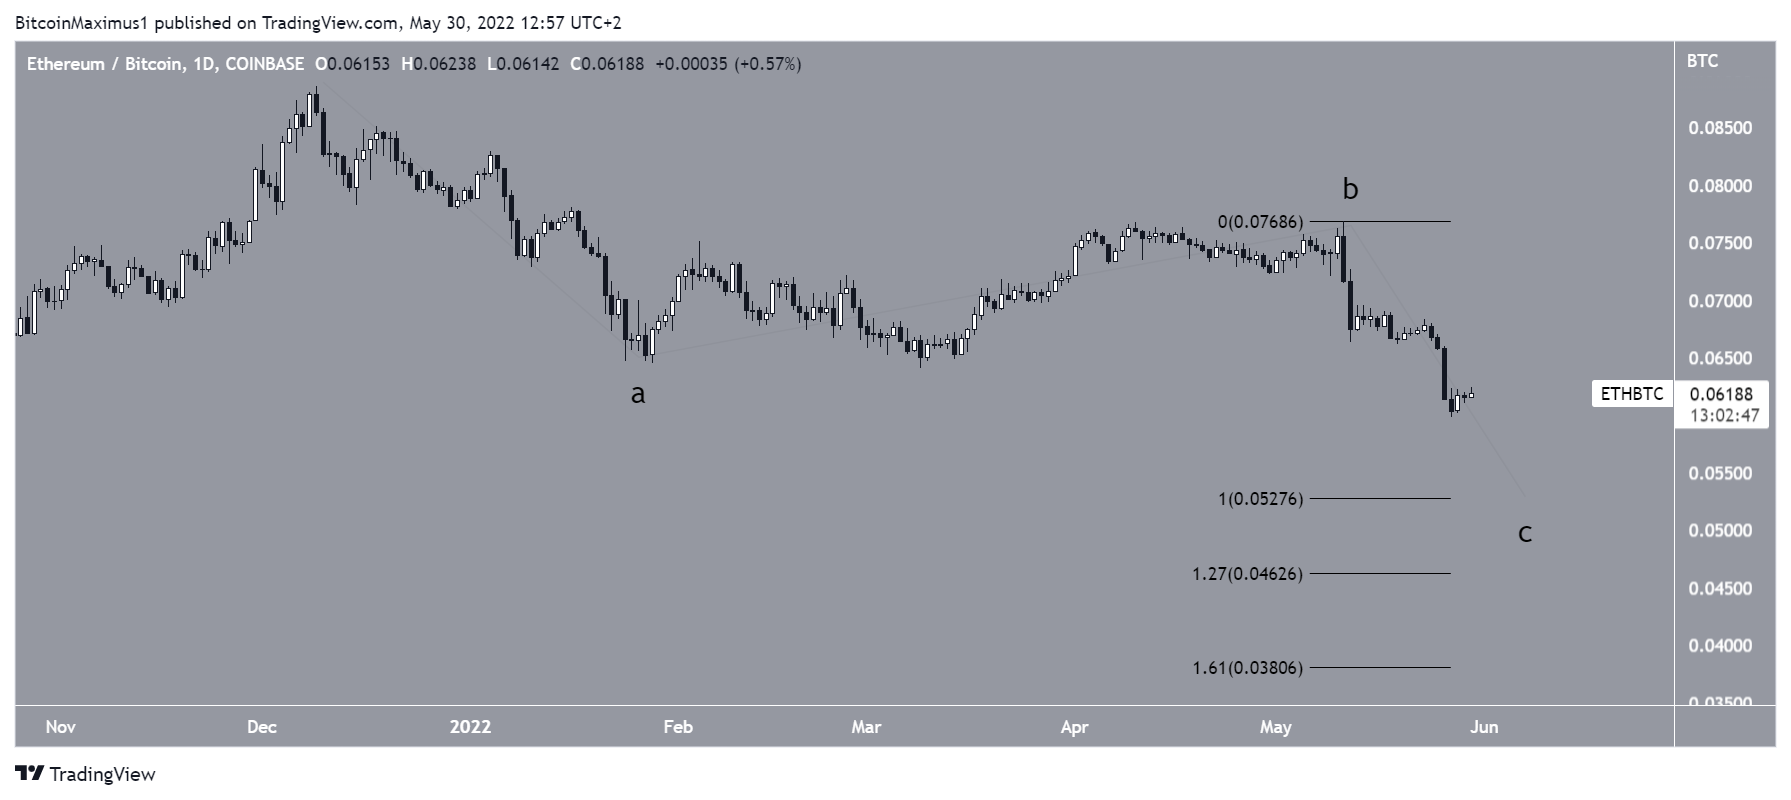
The wave count supports this interpretation. If the downward movement since the Dec 2021 high is an A-B-C corrective structure (black), then ETH is currently in the C wave of this correction.
Giving waves A:C a 1:1 ratio would lead to a low of ₿0.0526. The 1:1.27 ratio would lead to a low of ₿0.046, right at the previously outlined support area.
For Be[in]Crypto’s latest bitcoin (BTC) analysis, click here


