


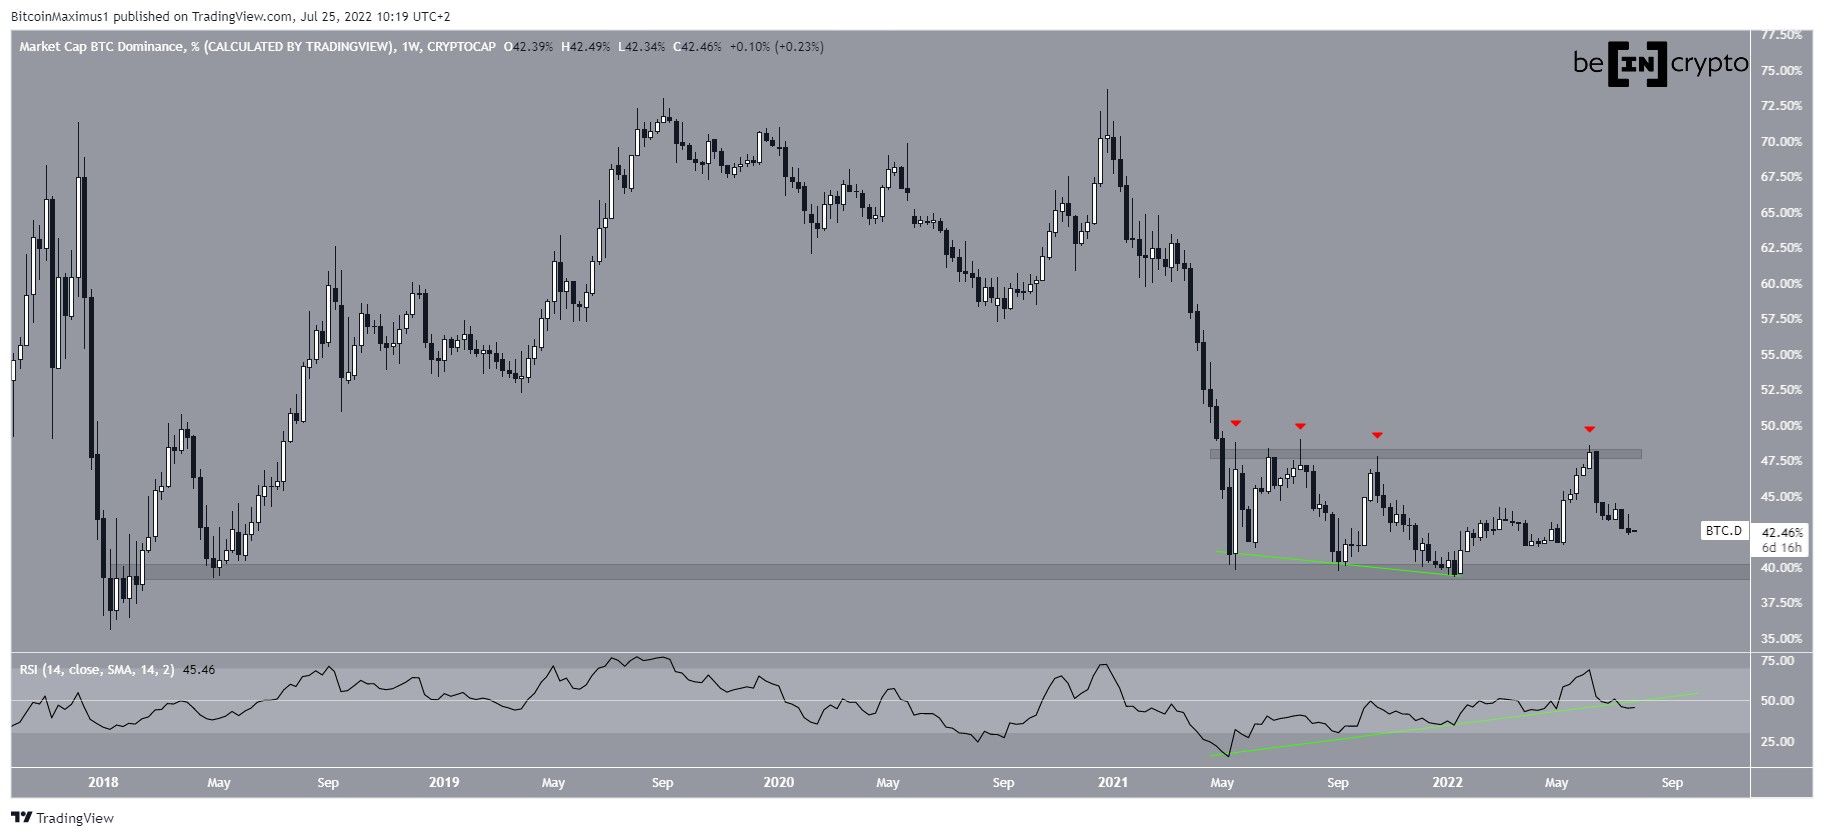
The Bitcoin dominance rate (BTCD) has been falling since being rejected by the 48% resistance area and is showing bearish signs in the weekly and daily time frames.
In the period between May and Dec 2021, BTCD created a triple bottom pattern inside the 40% long-term support area. The triple bottom is considered a bullish pattern, meaning that it leads to breakouts the majority of the time.
Furthermore, the pattern was combined with bullish divergence in the weekly RSI (green line).
This initially led to an upward movement that took BTCD to a high of 48.45%. However, the 48% area initiated a rejection (red icon) and the Bitcoin dominance rate has been falling since.
An interesting development is that the trend line of the divergence (green line) has now broken, and the RSI has fallen below 50.
Both of these are considered signs of bearish trends, meaning that they could lead to lower prices. So, this could mean that BTCD will fall towards the 40% support area and potentially break down.
Future movement
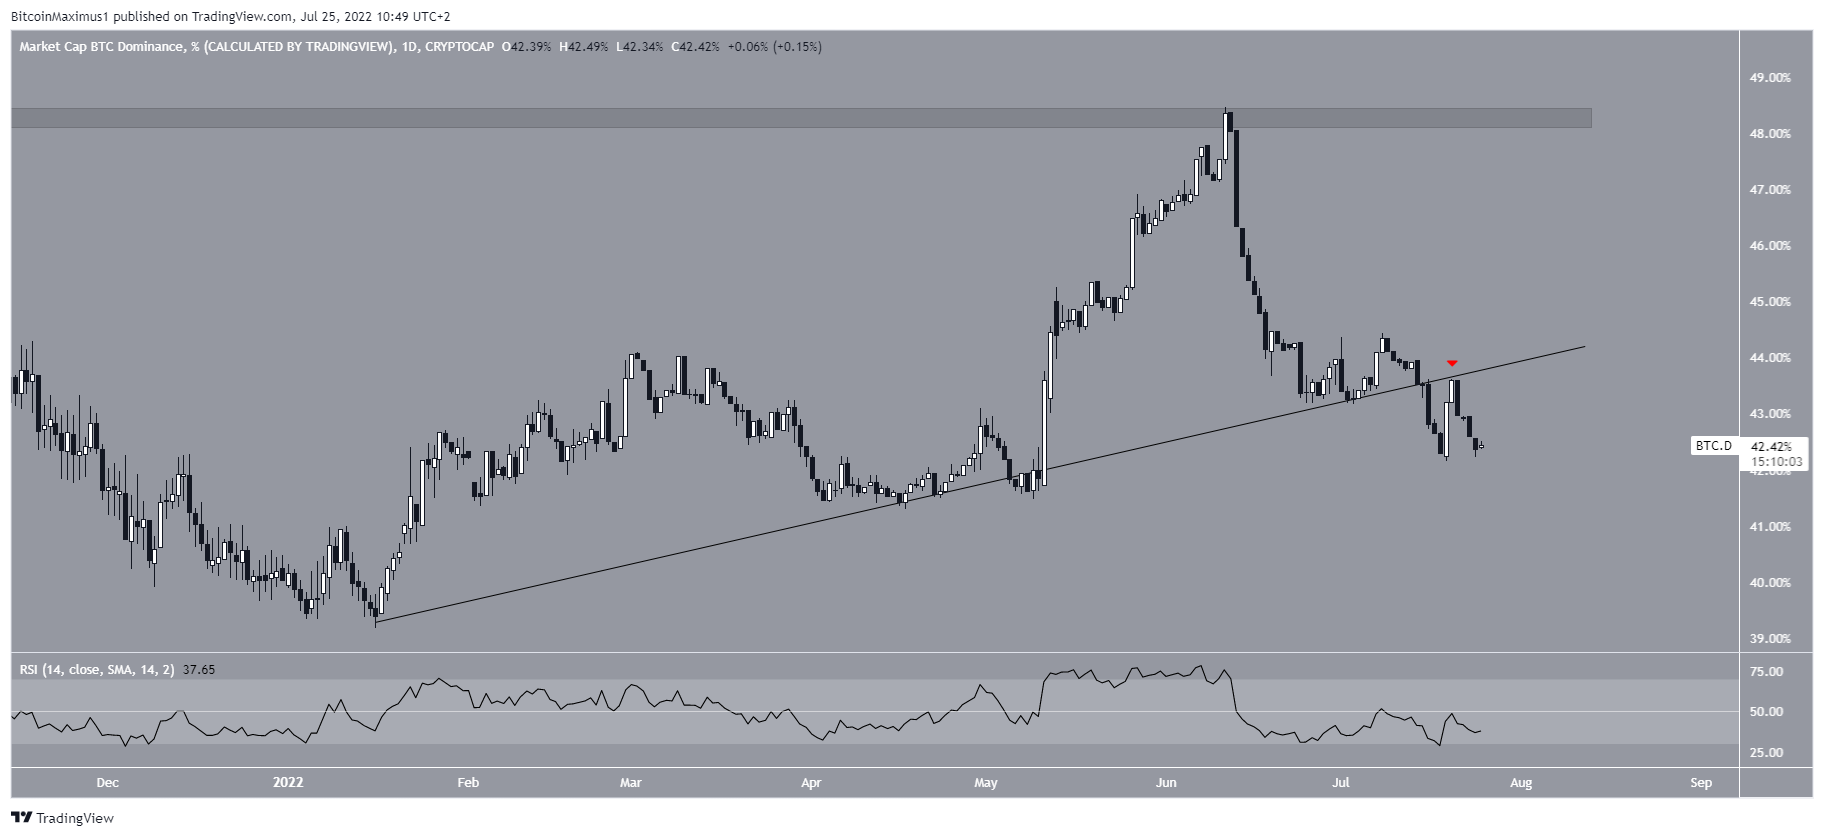
Cryptocurrency trader @Eliz883 tweeted a chart of BTCD, stating that it is trading just below resistance at 43%.
Since then, BTCD has broken down from an ascending support line and validated it as resistance (red icon) afterwards. This is a bearish sign that supports the bearish readings from the daily time frame.
Additionally, the daily RSI is below 50, in what is another sign of a bearish trend.
As a result of these readings, a decrease towards at least 40% is expected.
ETH/BTC
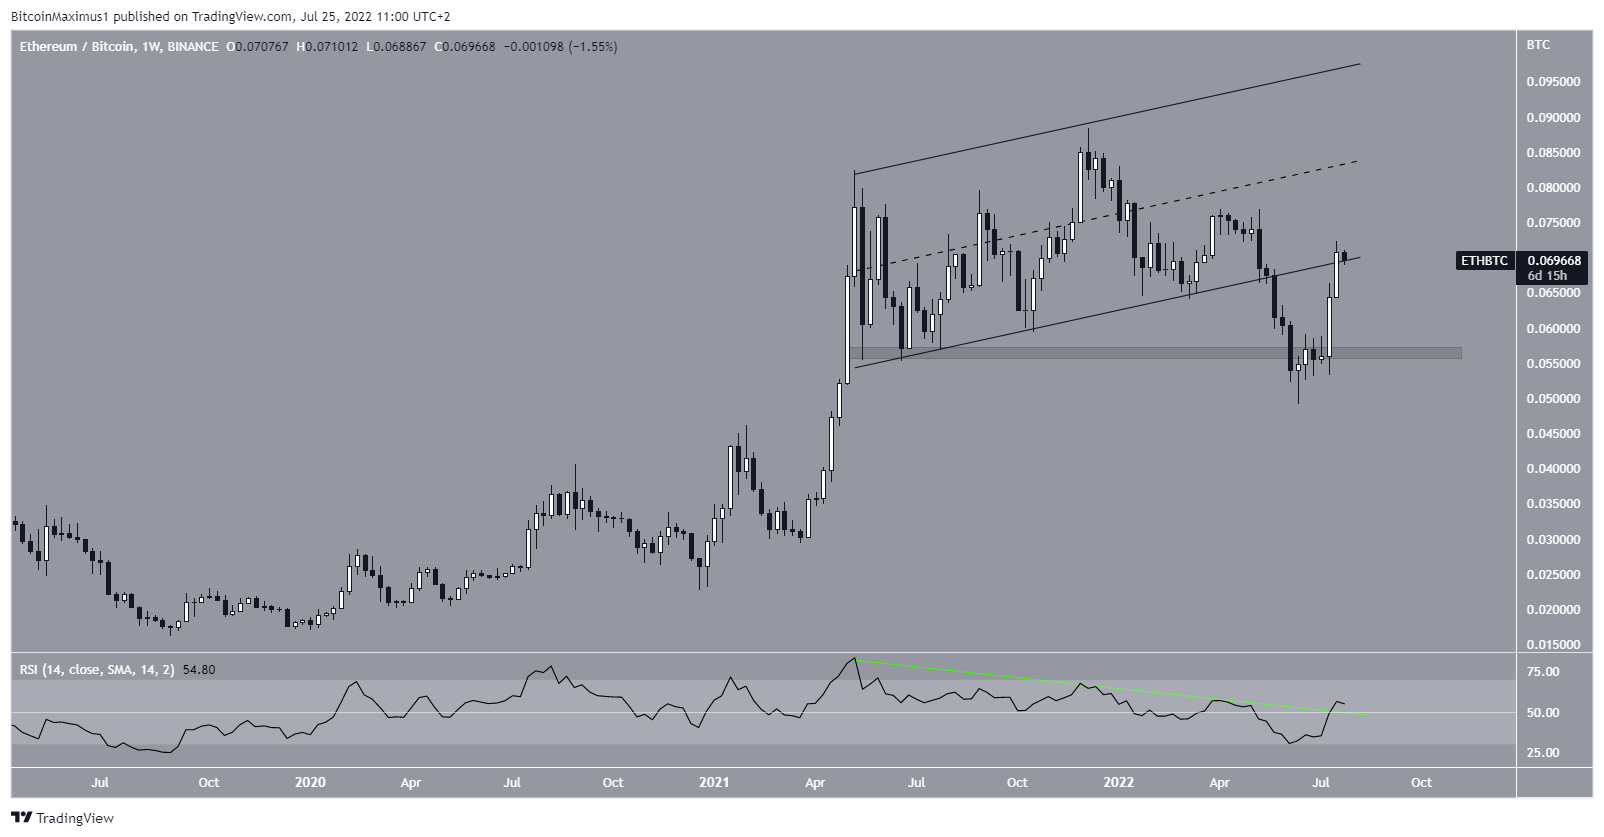
Since Ethereum (ETH) is the largest altcoin by market cap, its movement is a big factor in changes in BTCD.
ETH broke down from an ascending parallel channel in the beginning of May and proceeded to reach a low of ₿0.049 in June. However, it reclaimed the 0.056 support area afterwards and is in the process of reclaiming the support line of the channel.
Furthermore, the weekly RSI is in the process of moving above 50 and has broken out from its bearish divergence trend line (green line).
If ETH were to reclaim the support line of the channel, the trend would be considered bullish.
For Be[in]Crypto’s latest Bitcoin (BTC) analysis, click here


