
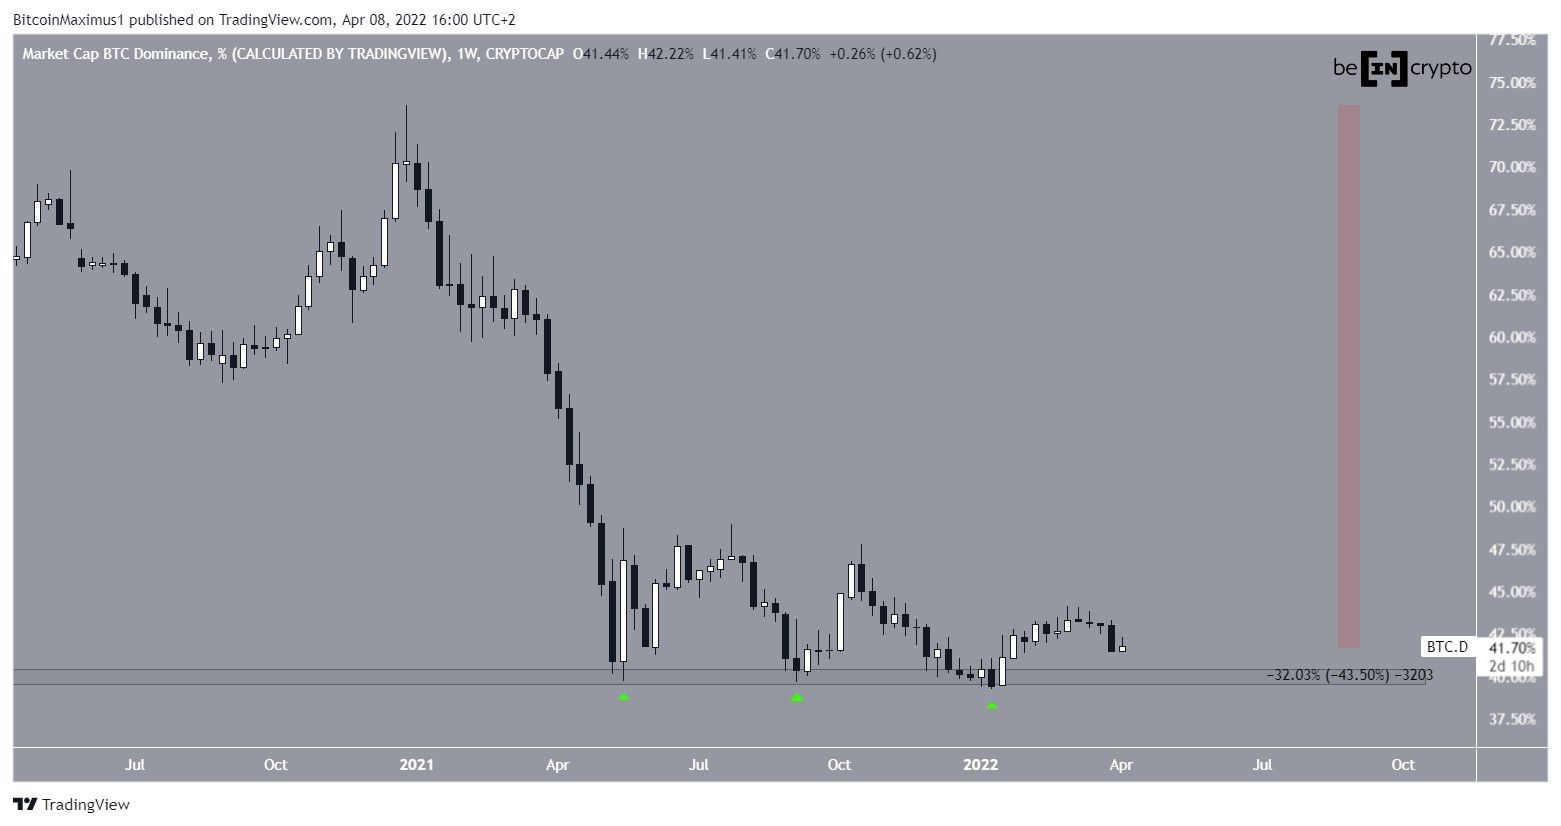
During the week of March 28 to April 4, the Bitcoin Dominance Rate (BTCD) decreased sharply, and is heading towards its yearly lows.
Since May 2021, May 2021, BTCD has hovered above the 40% horizontal support area, bouncing above it thrice (green icons). The most recent bounce occurred in the beginning of January 2022, and led to a high of 44.09% on March 2.
However, the upward movement could not be sustained and BTCD fell sharply during this past week, creating a large bearish candlestick. Since December 2021’s high, BTCD has decreased by 43.50 percent.
Technical indicator readings
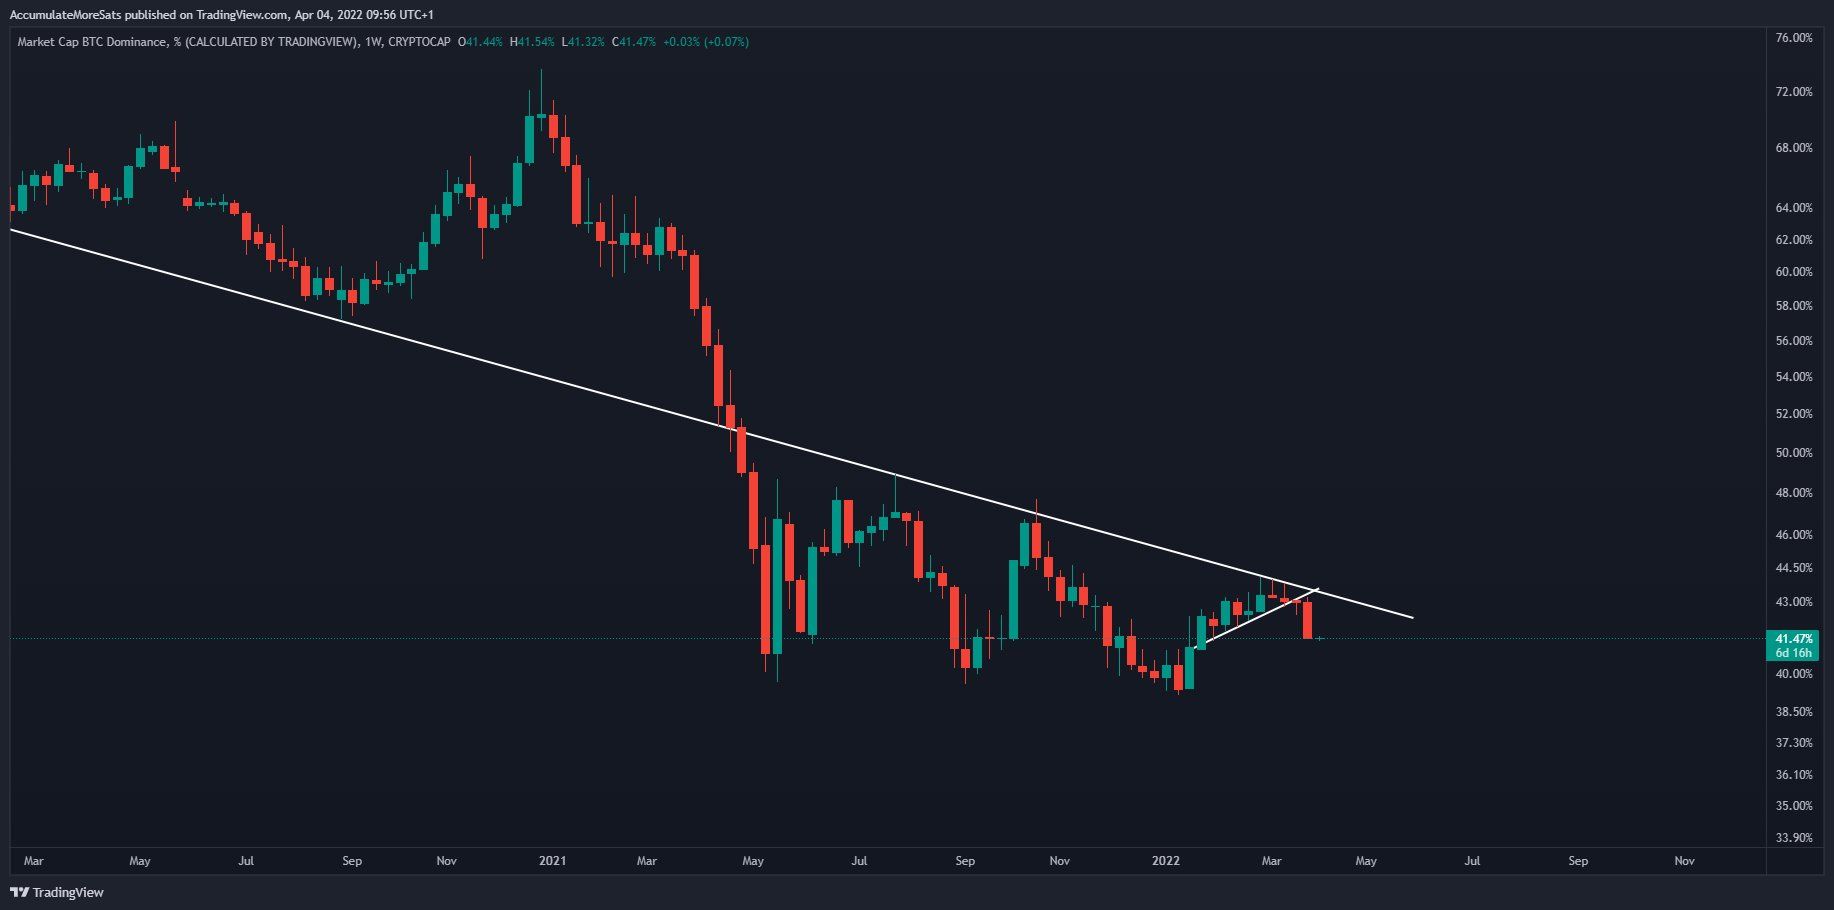
Technical analyst @DoktorSatoshi tweeted a chart of BTCD, stating that new lows might follow due to the bearish close.
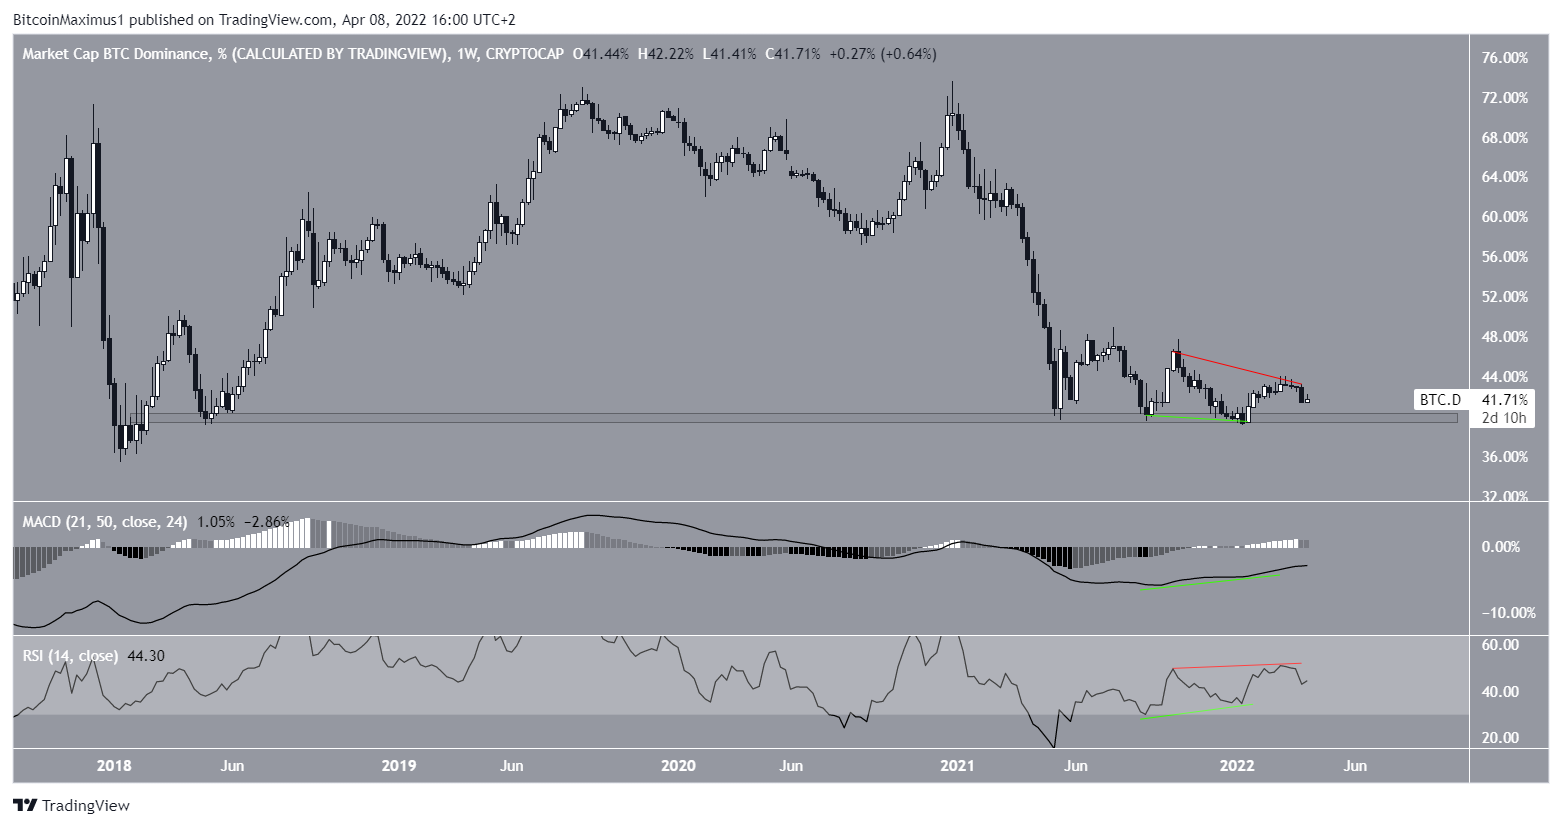
Despite the bearish weekly close, technical indicators are somewhat bearish.
While the initial bounce was preceded by bullish divergence in both the RSI and MACD (green lines), the RSI has now developed a hidden bearish divergence (red line). This is a sign of bearish trend continuation, and could mean that an eventual breakdown from the 40% area will occur.
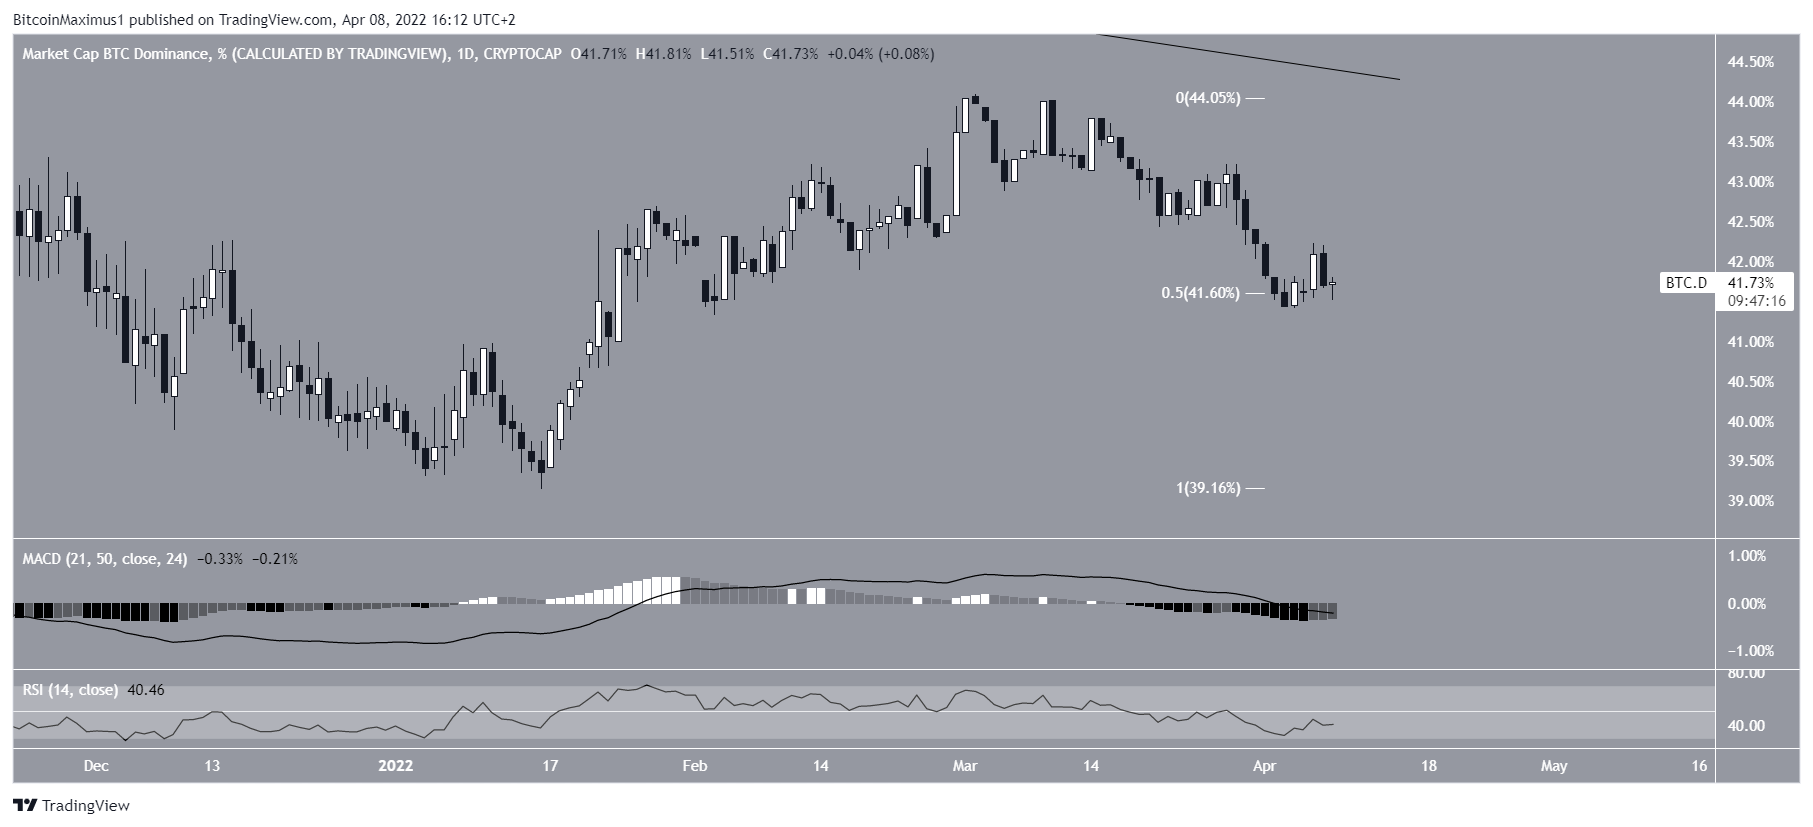
Daily time-frame readings provide a more decisively bearish outlook.
While BTCD has bounced at the 0.5 Fib retracement support level at 41.60%, both the RSI and MACD are falling. Furthermore, the former is below 50 while the latter is negative. Both of these are considered signs of a bearish trend.
Therefore, they support the scenario in which a drop below the 40% area will occur.
ETH/BTC
An increase in the ETH/BTC pair usually causes a decrease in BTCD, as Ethereum maintains its position as the largest altcoin by market cap.
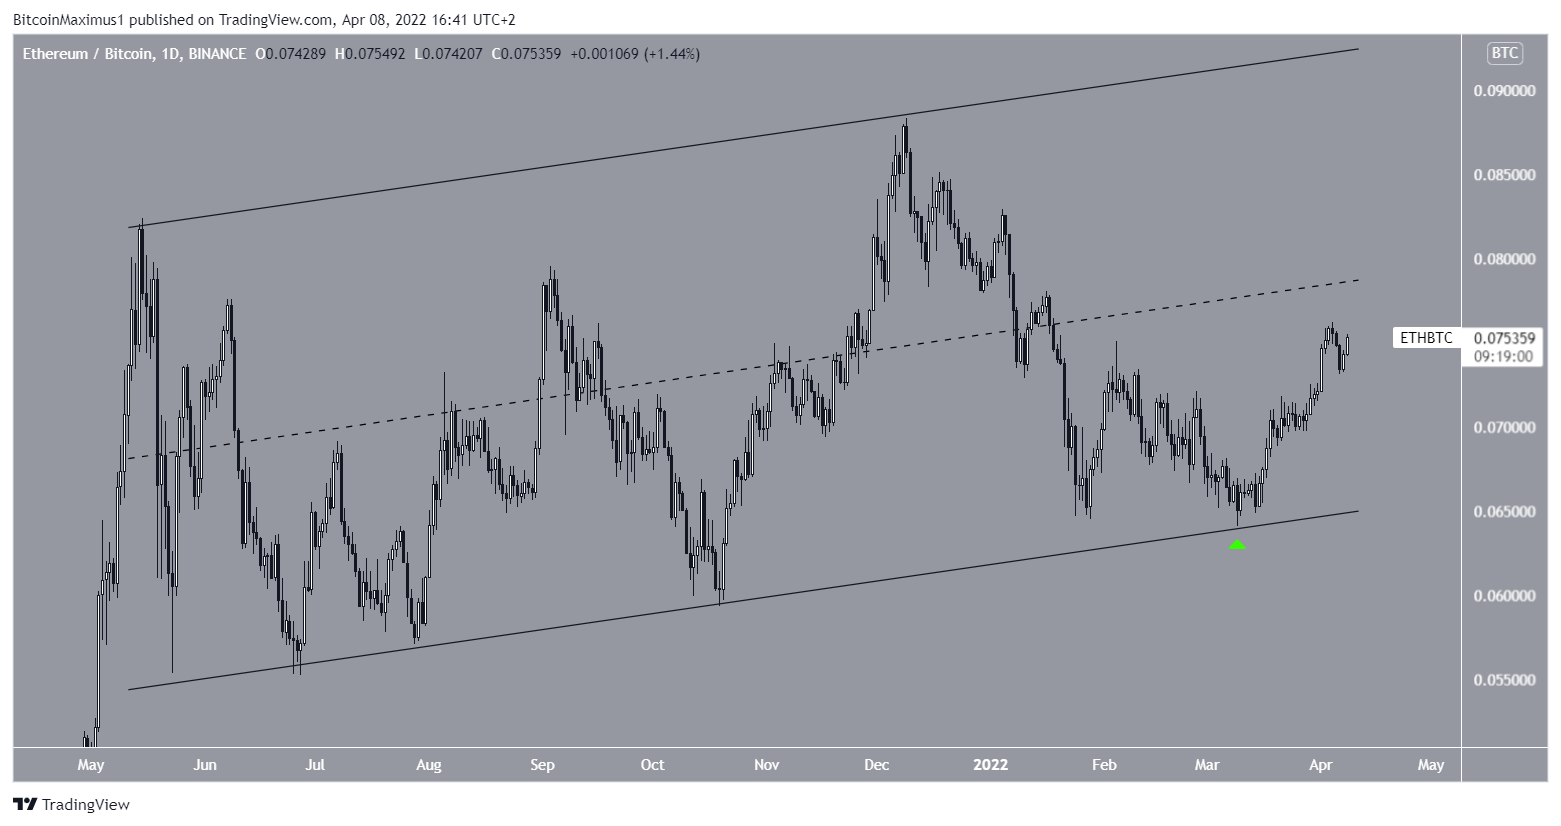
Since May 2021, ETH has been trading inside an ascending parallel channel, and increasing since bouncing on its support line on March 9, 2022.
Currently, the price is approaching the middle of the channel at ₿0.08. If it manages to reclaim it, it would be a very bullish development that would indicate that future highs are on the horizon.
This would fit with the possibility of a BTCD drop towards new lows.
For Be[In]Crypto’s latest Bitcoin (BTC) analysis, click here.
What do you think about this subject? Write to us and tell us!
