


The Bitcoin dominance rate (BTCD) is very close to its yearly lows, and could potentially break down further, leading to a new all-time low.
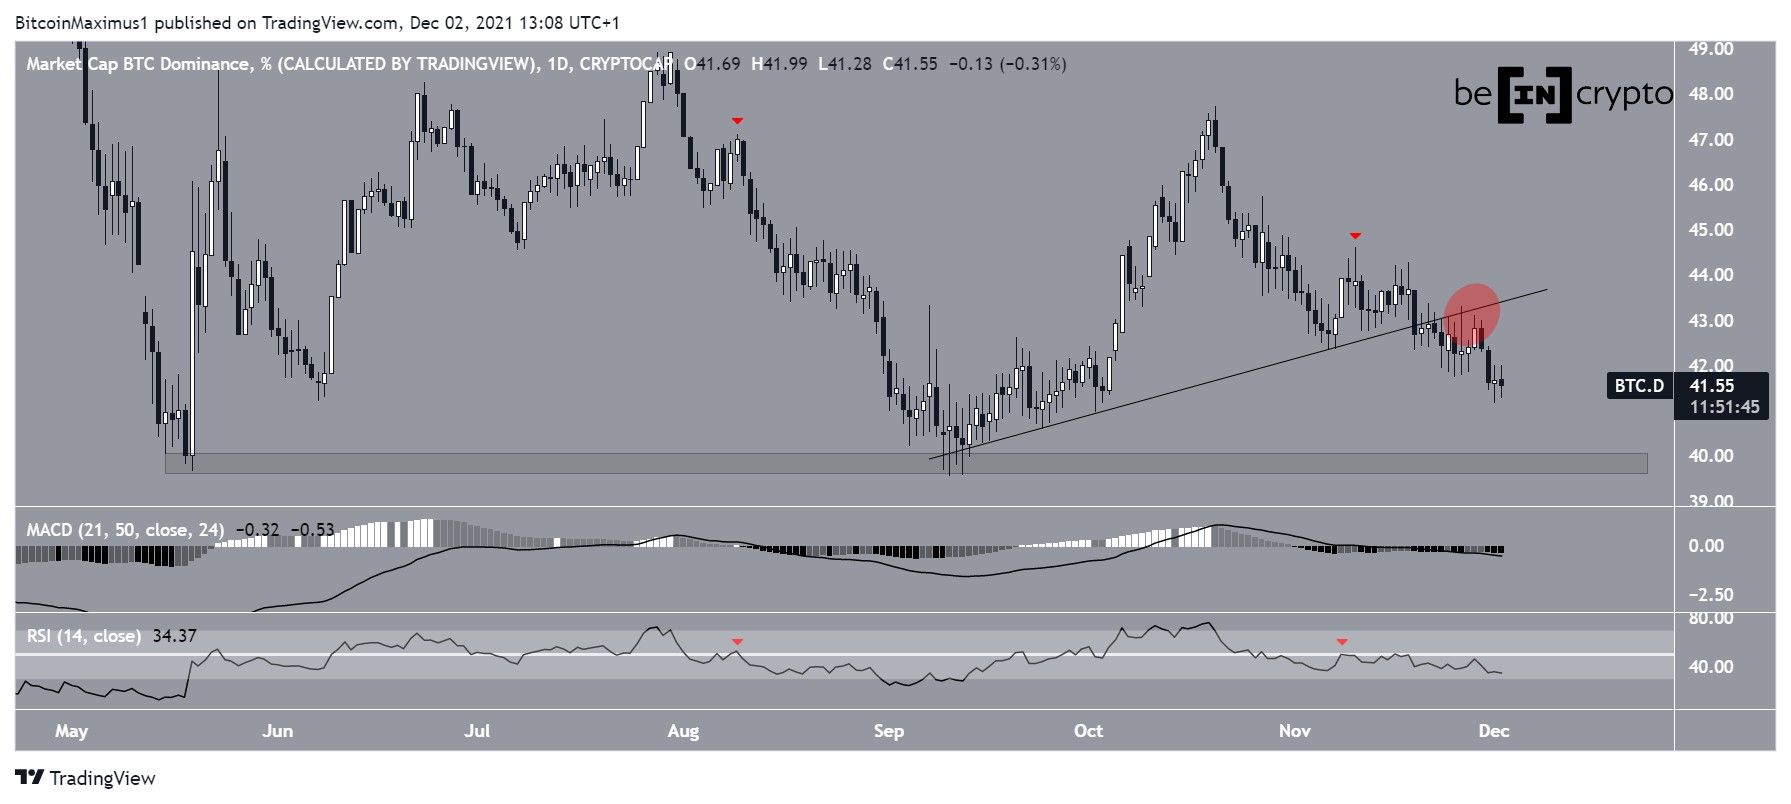
BTCD has been decreasing since it reached a high of 47.72% on Oct 20. Initially, it bounced at an ascending support line that had been in place since Sept 8. However, it broke down and validated the line as resistance on Nov 26 (red circle).
BTCD is now approaching the closest support area at 39.80%.
Technical indicators support the continuation of the downward movement.
The MACD, which is created by a short- and a long-term moving average (MA), is moving downwards. It is also negative, which means that the short-term MA is slower than the long-term one.
The bearishness is more clearly visible in the RSI, which is a momentum indicator. The RSI has fallen below 50 and validated the line as resistance. The previous time this occurred (red icon) was on Aug 5 and preceded a significant downward movement that continued for two months.
Therefore, the daily time-frame readings suggest that BTCD will fall to the 39.80% horizontal support area.
BTCD future movement
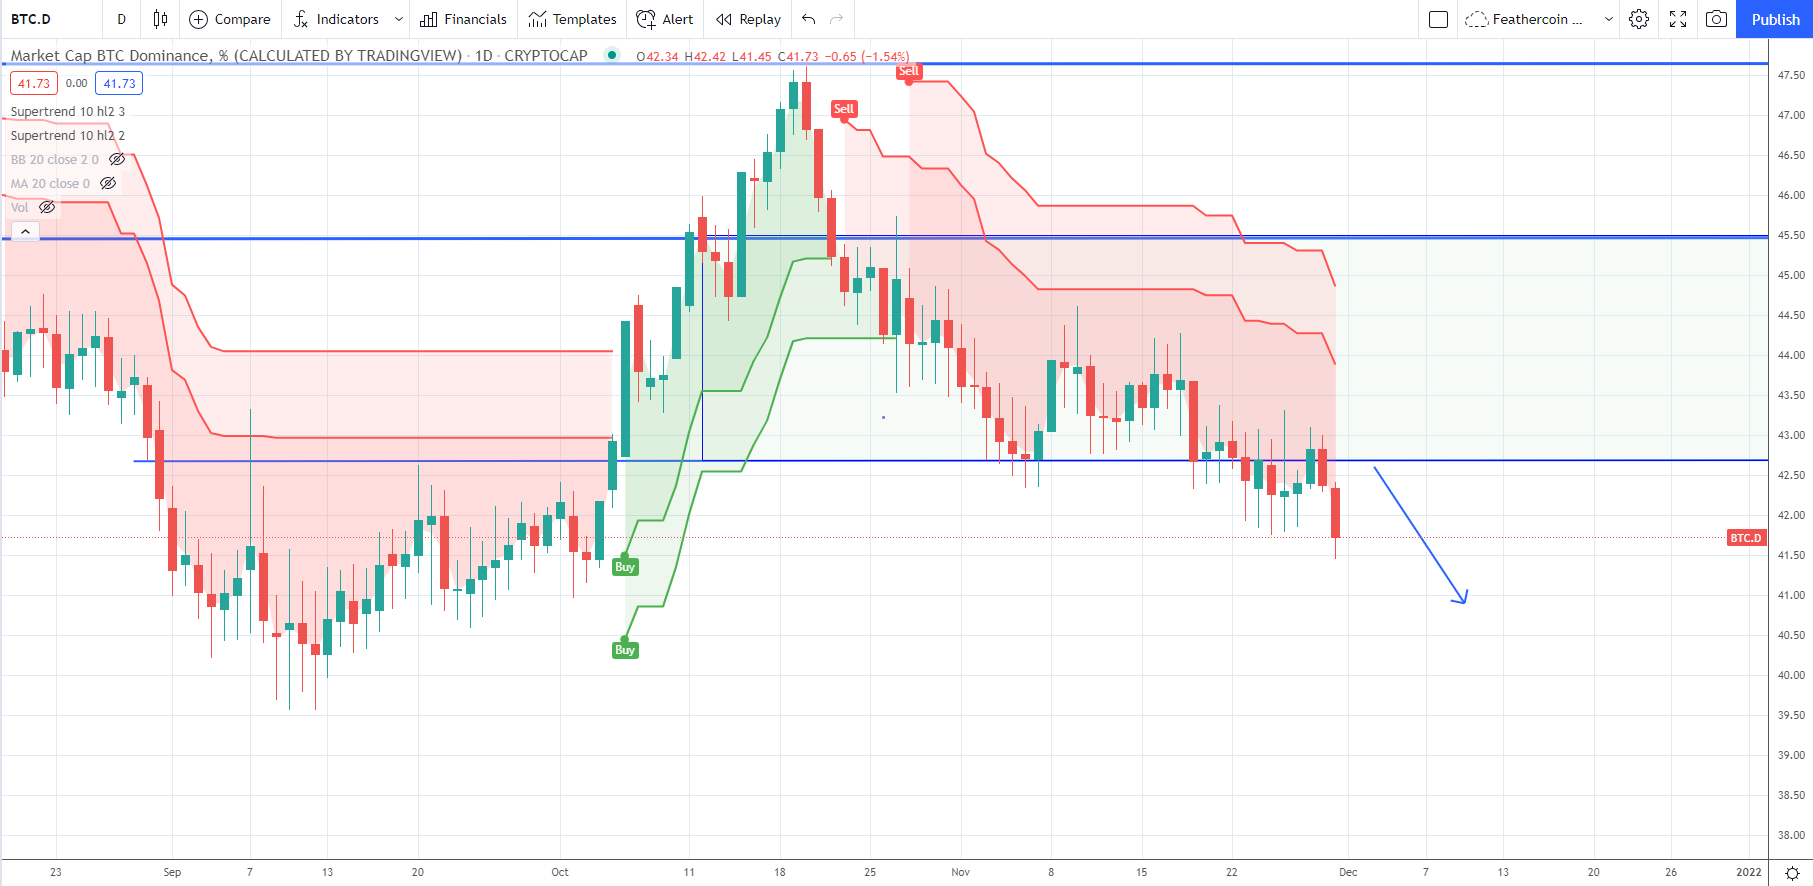
Market analyst @IncomeSharks tweeted a BTCD chart, suggesting that the rate is likely to continue decreasing in the future.
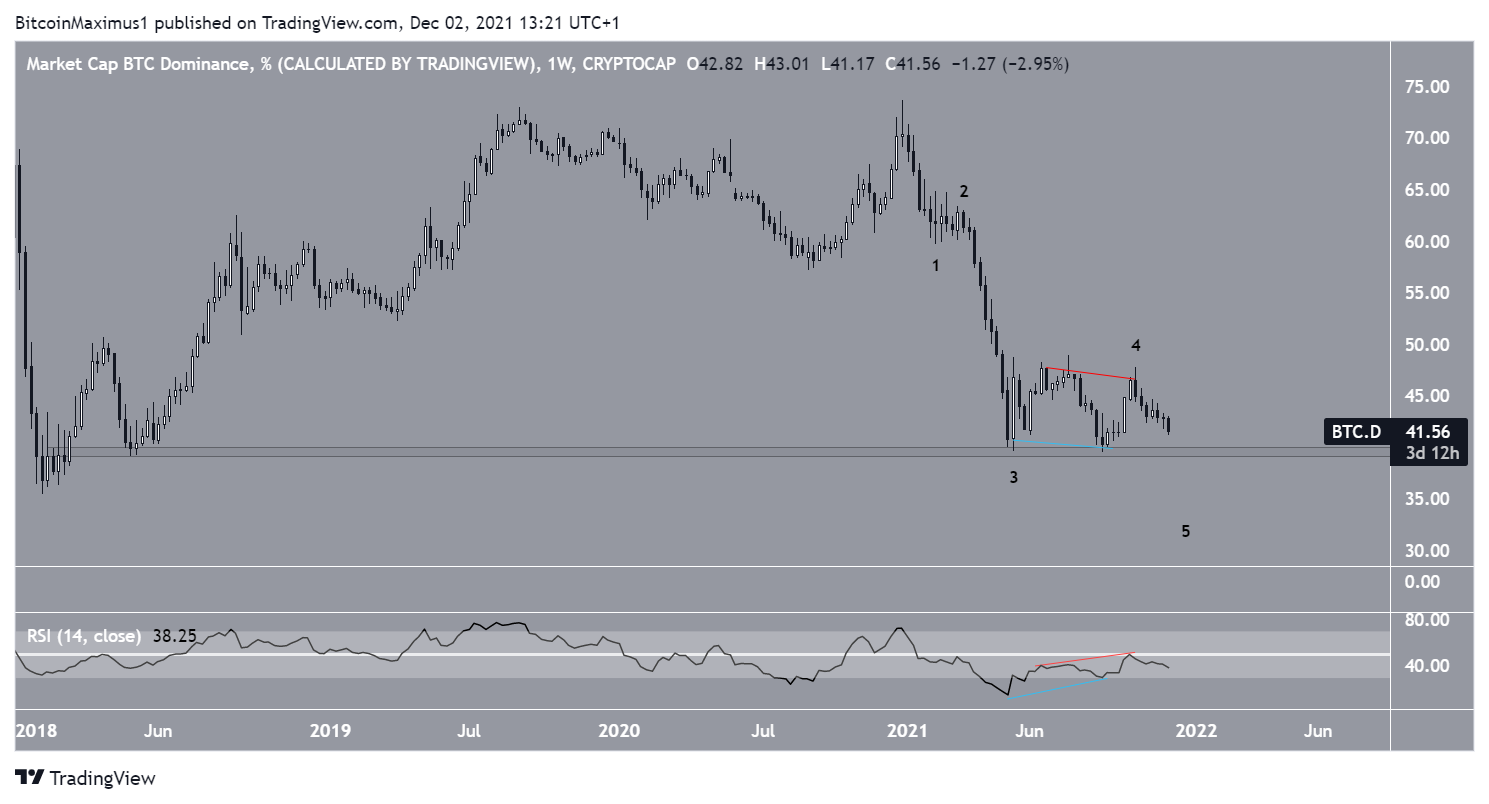
The longer-term weekly chart also suggests that BTCD will eventually fall to a new all-time low.
The weekly RSI has generated hidden bearish divergence (red icon), which is a bearish sign that often leads to continuation of the bearish trend. Furthermore, this divergence occurred right at the 50 line, below which the RSI has now fallen.
In addition to this, the decrease since the Dec 2020 highs looks like it still have four waves. Therefore, another final downward movement would be expected, which would complete the entire bearish formation.
A breakdown from the 39.80% support area would confirm that BTCD is heading to new lows.
For BeInCrypto’s latest Bitcoin (BTC) analysis, click here.



