


Bitcoin (BTC) is gearing up for another attempt at moving above the $59,300 resistance area, which has so far rejected it twice.
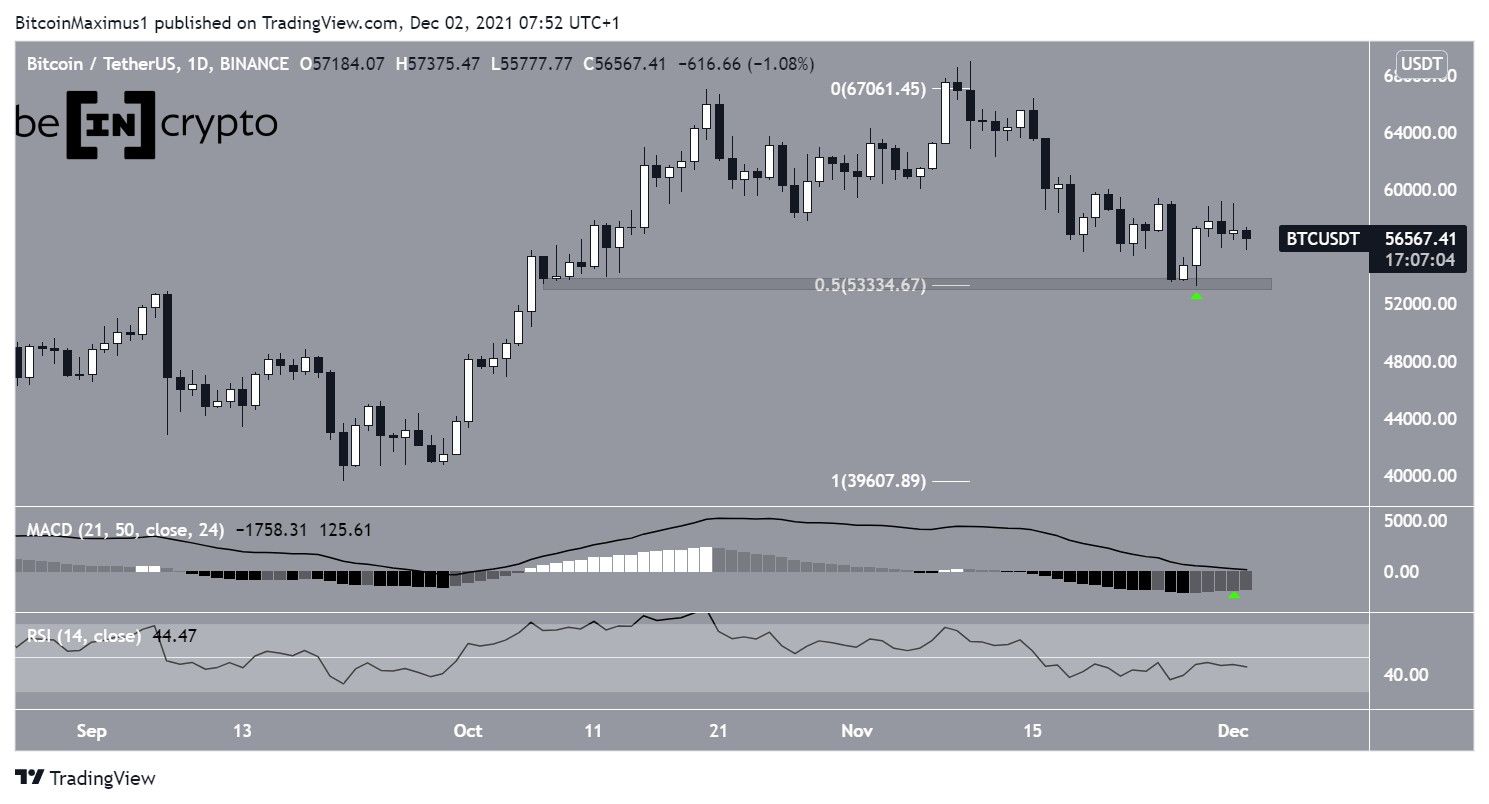
The daily time frame shows that BTC has been increasing since rebounding on Nov 28 (green icon). The bounce in price occurred just above the $53,350 area, which is both a horizontal and Fib support level. As long as the price is trading above this level, the trend can be considered bullish.
Technical indicators have also started to show bullish signs.
The MACD, which is created by a short and long-term moving average (MA), has created four successive higher momentum bars. This means that the short-term MA is accelerating relative to the long-term average.
The RSI, which is a momentum indicator, is also increasing. This is also a bullish sign that shows that momentum is picking up. However, the RSI is still below the 50-line, which is often considered a threshold for a bullish/bearish trend. It has to move above this line in order to confirm that the correction is complete.
Short-term BTC resistance
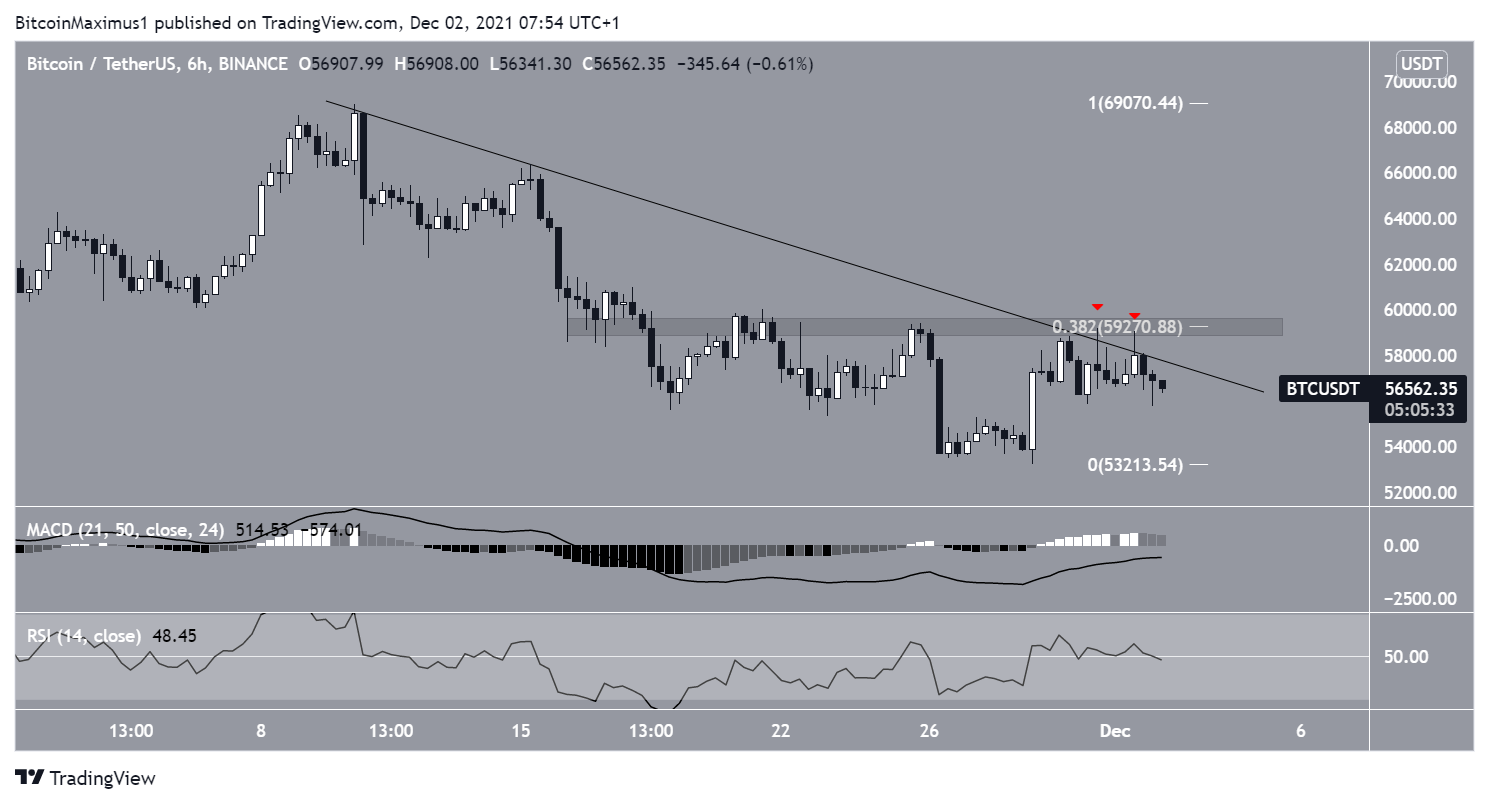
The six-hour chart shows that BTC is still following the descending resistance lines that it’s been mostly trading under since the Nov 10 all-time high.
This resistance rejected the price twice already (red icons), on Nov 30 and Dec 1.
The line also coincides with the $59,300 resistance area, which is the 0.382 Fib retracement resistance level.
BTC has to reclaim this line in order for the short-term correction to be complete.
Similar to the daily time frame, technical indicators are showing bullish signs, but have not confirmed a bullish trend yet.
While the RSI is staying above 50, the MACD is not yet positive.
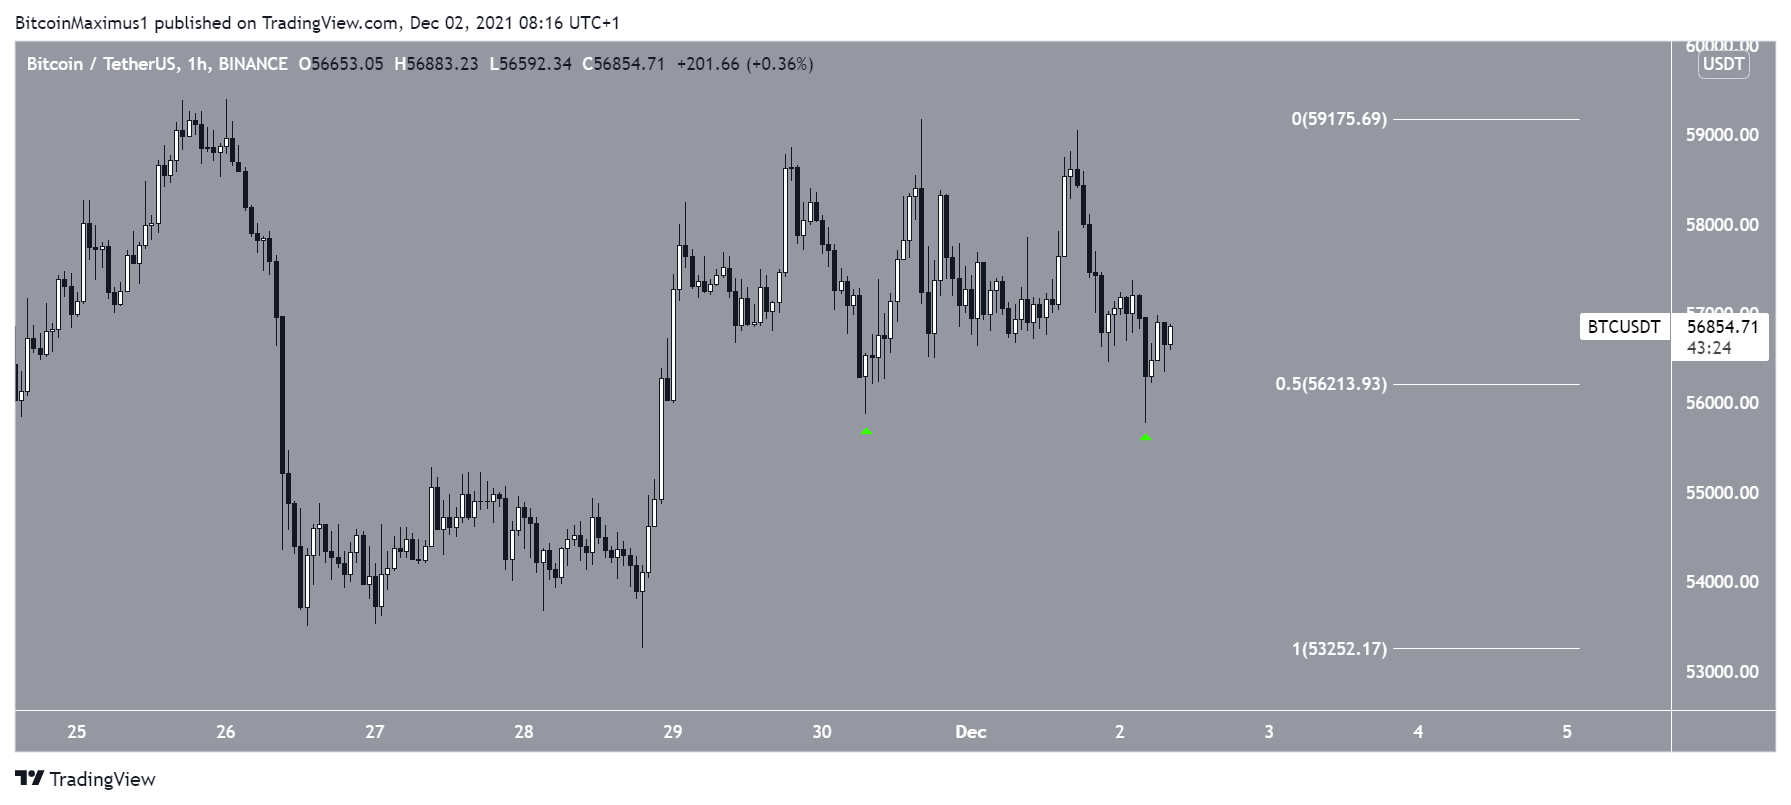
The hourly chart shows that BTC has bounced twice at the 0.5 Fib retracement support level at $56,215 (green icons).
On Dec 1, it created a slightly lower low relative to the price on Nov 30. This supports the possibility that the short-term correction is complete and BTC could make another attempt at breaking out above the descending resistance line.
For BeInCrypto’s previous Bitcoin (BTC) analysis, click here.


