


The Bitcoin dominance rate (BTCD) has broken down from a long-term support level.
A bounce near 59% is expected before the downward trend resumes.
Bitcoin Dominance Rate Woes
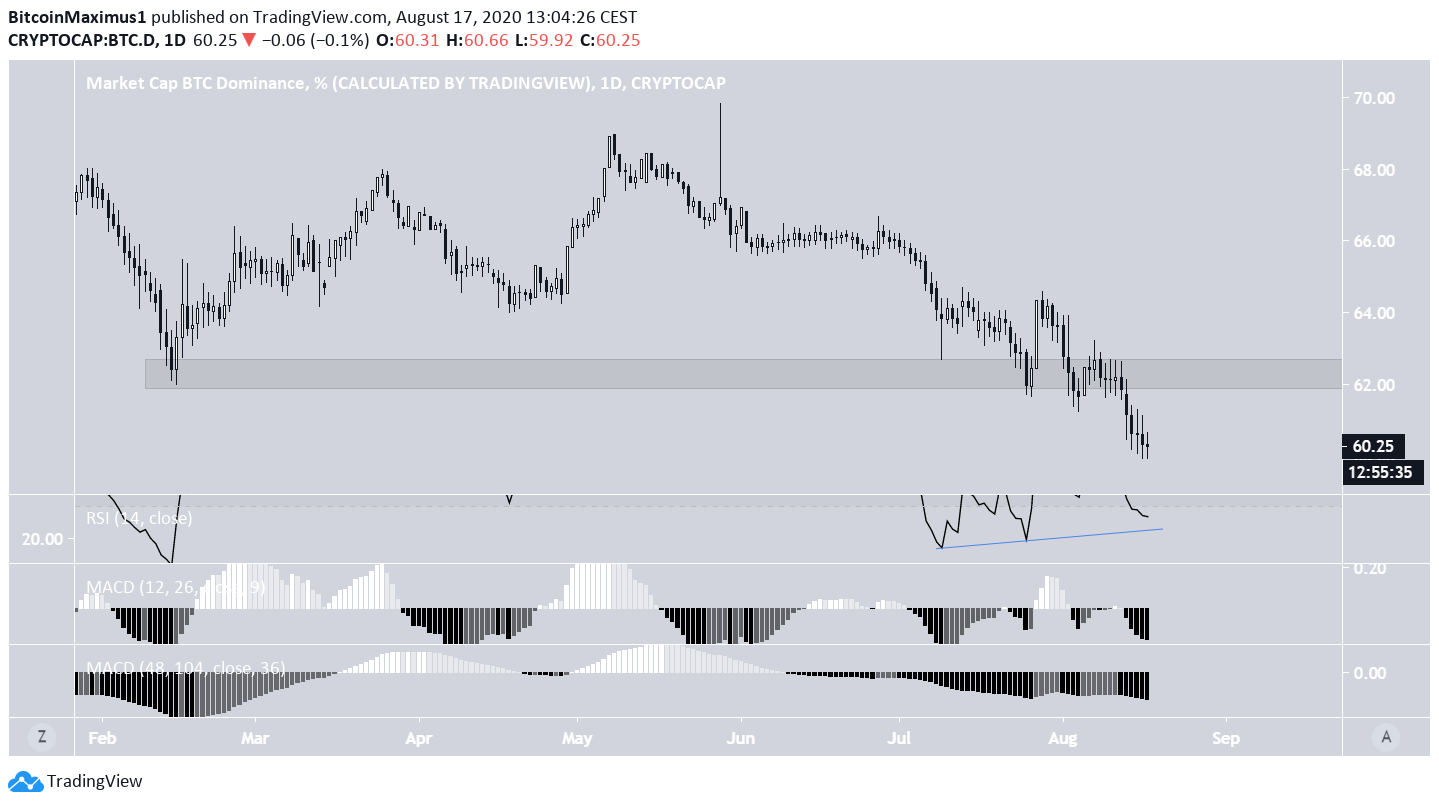
The Bitcoin dominance rate has been decreasing since May 8 when it reached a high just below 70%. On July 25, the BTCD reached the long-term 62% support area and bounced back to the upside.
The higher rate could not be sustained though, and on Aug 13 the rate plunged back to where it started and went even lower in the days that followed. At the time of press, the BTCD was just above 60%.
While both the short and the long-term MACD show that the downward momentum is getting stronger, the daily RSI has generated bullish divergence and is approaching the trend-line of the divergence. This could make it possible for the BTCD to make another bounce back.
Cryptocurrency trader @Anbessa100 stated that the Bitcoin dominance rate is likely to continue moving downwards towards 59% but is expecting a bounce afterward.
A decrease to 59% would cause the RSI to drop to the aforementioned trend-line, allowing for the bounce to transpire.

Potential Bounce
The Bitcoin dominance rate has possibly been completing a W-X-Y correction (white) since September 2019. If so, it currently looks to be in the Y wave, which is transpiring with an A-B-C formation (black).
The current A wave has almost reached the 1.61 Fib level of the first A wave, which falls at 59.6%. This further increases the chances of a possible bounce, which could take the rate towards 64% before a final drop.

The hourly chart suggests a bounce near 59.5% since there is a growing bullish divergence in both the RSI and MACD.
Relationship to Bitcoin
Since the beginning of August, the relationship between BTC (blue) and BTCD (green) has been mostly negative, meaning an increase in the BTC price has caused a decrease in BTCD. This has been especially pronounced during rapid movements.
If this relationship holds, a decrease in the BTC price would be required for an increase in BTCD.


