


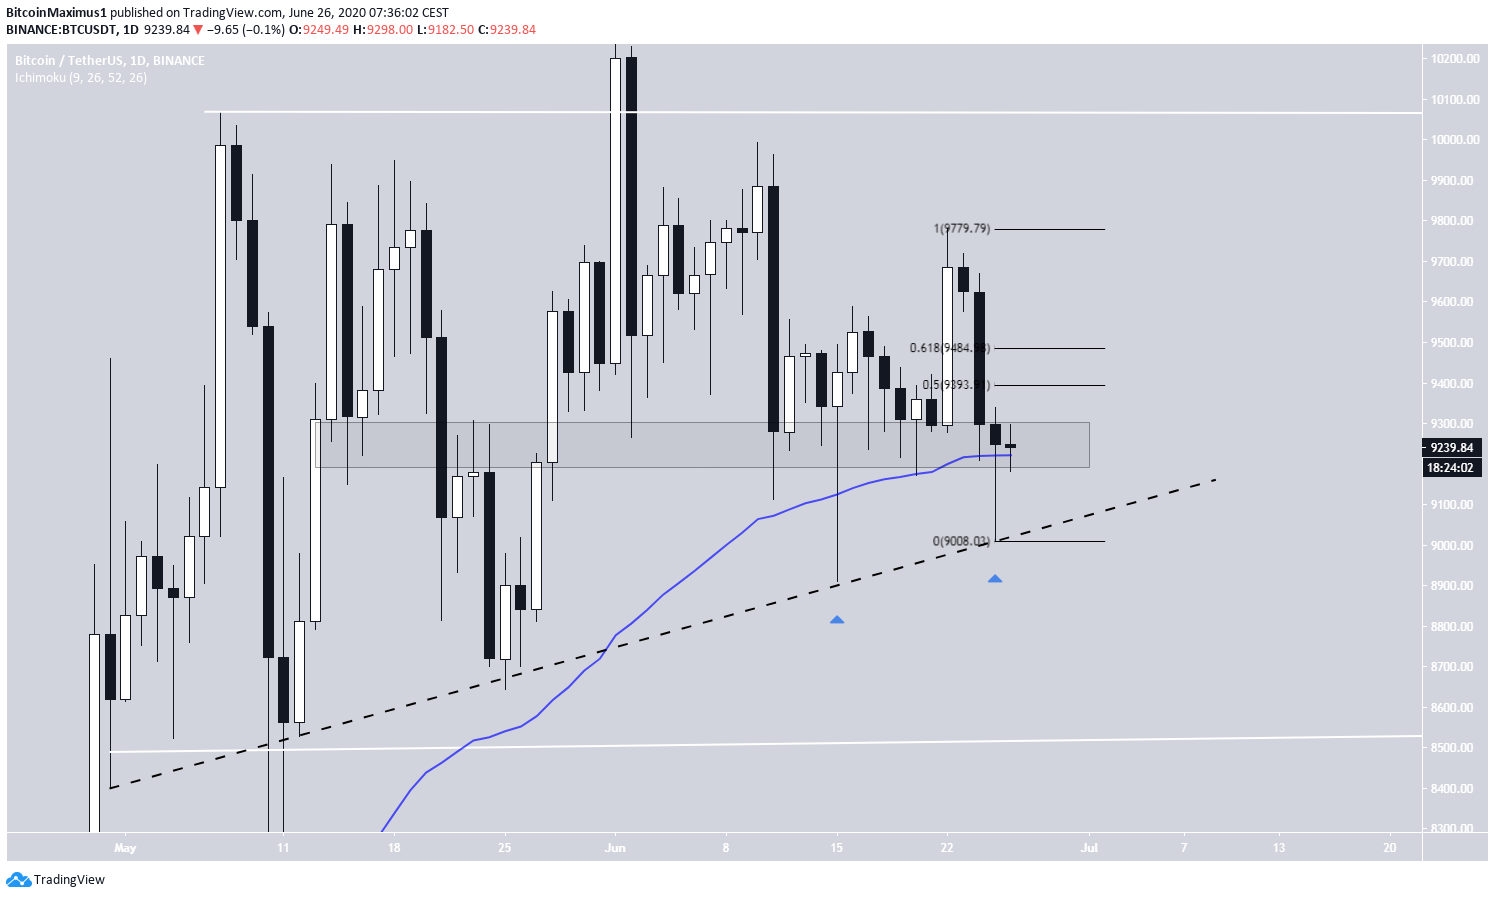
On June 25, the Bitcoin price continued its descent from the day prior, dropping to a low of $9,009. However, the lower prices were quickly bought up, and the price closed at $9,249, creating a long lower wick and a hammer candlestick.
The price is still trading inside a significant support area, from which a bounce is expected.
Current Bitcoin Support
On June 25, the Bitcoin price created a hammer candlestick, which is normally considered bullish, especially when it follows a downward move. The price also bounced on the 50-day moving average (MA), and the ascending support line that has been in place since May 1.
If the price bounces upwards, it could retrace to the 0.5-0.618 Fib levels of the entire downward move between $9,398-$9,488.
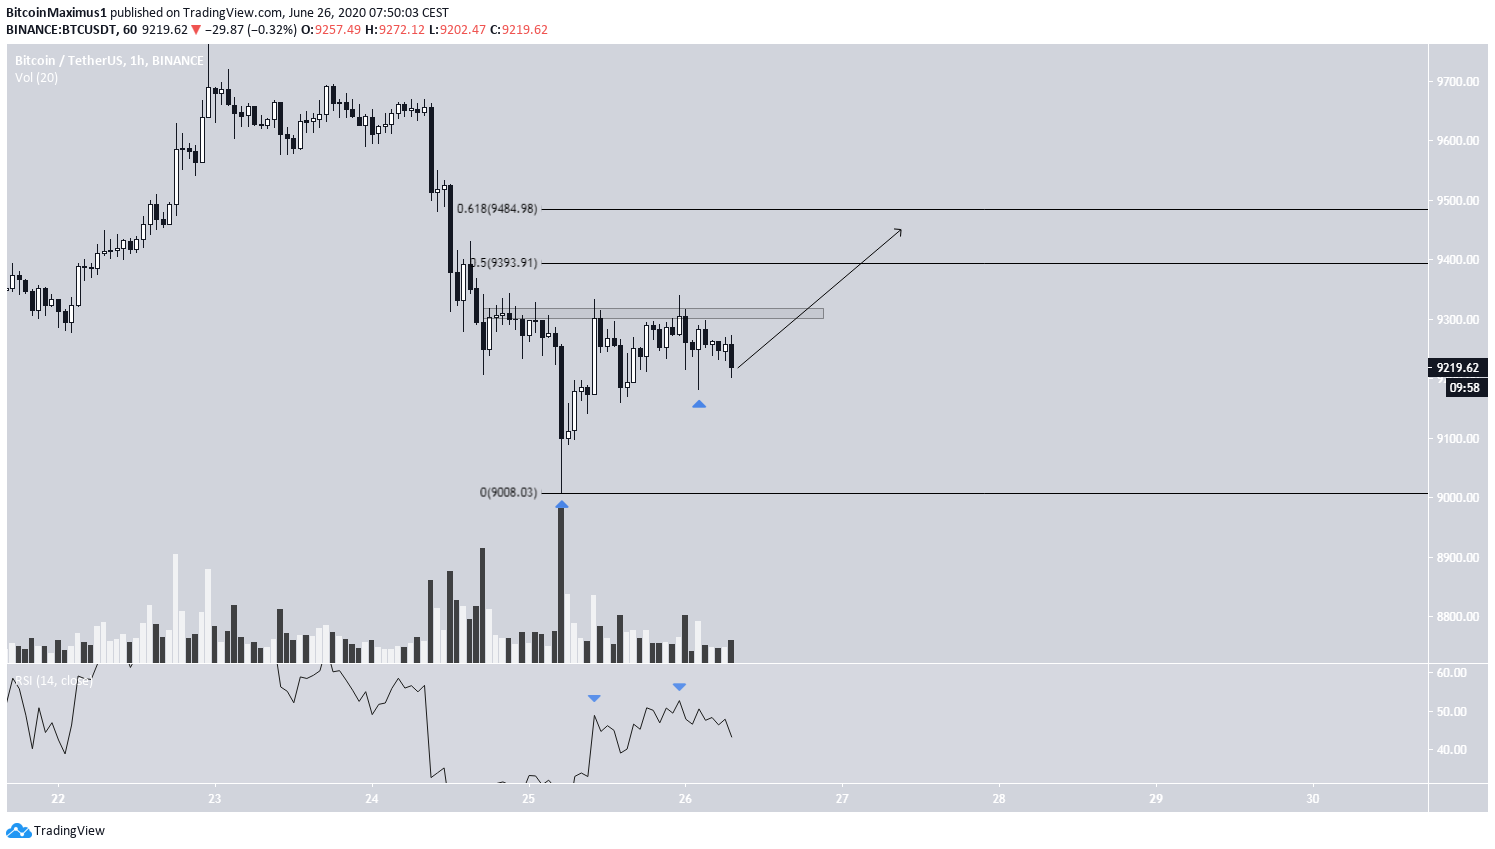
In the shorter-term, the price has shown considerable buying pressure in the form of a long lower-wick on June 25, and a bullish hammer on June 26. It is currently attempting to break out from the $9,300 minor resistance area, and the RSI readings suggest it will be successful in doing so.
If it breaks out, BTC is likely to increase towards the resistance area outlined in the previous section.
Trading Range
In the longer-term, the Bitcoin price has been trading in a range between $8,500 and $10,050 since May 1. At the time of writing, it was trading at the $92,50 support area, right in the middle of this range.
Furthermore, the price is possibly trading inside a symmetrical triangle. Whether the price breaks out or down from this triangle will determine if it heads to the range low or the range high at $8,500 or $10,050 respectively. The resistance and support lines of the triangle are currently at $9,500 and $9,000, respectively.
At the time of writing, a breakdown seems more likely. This is mostly due to the sharp rejections each time the price attempts to initiate an upward move. These rejections have transpired with higher volumes than the pumps.
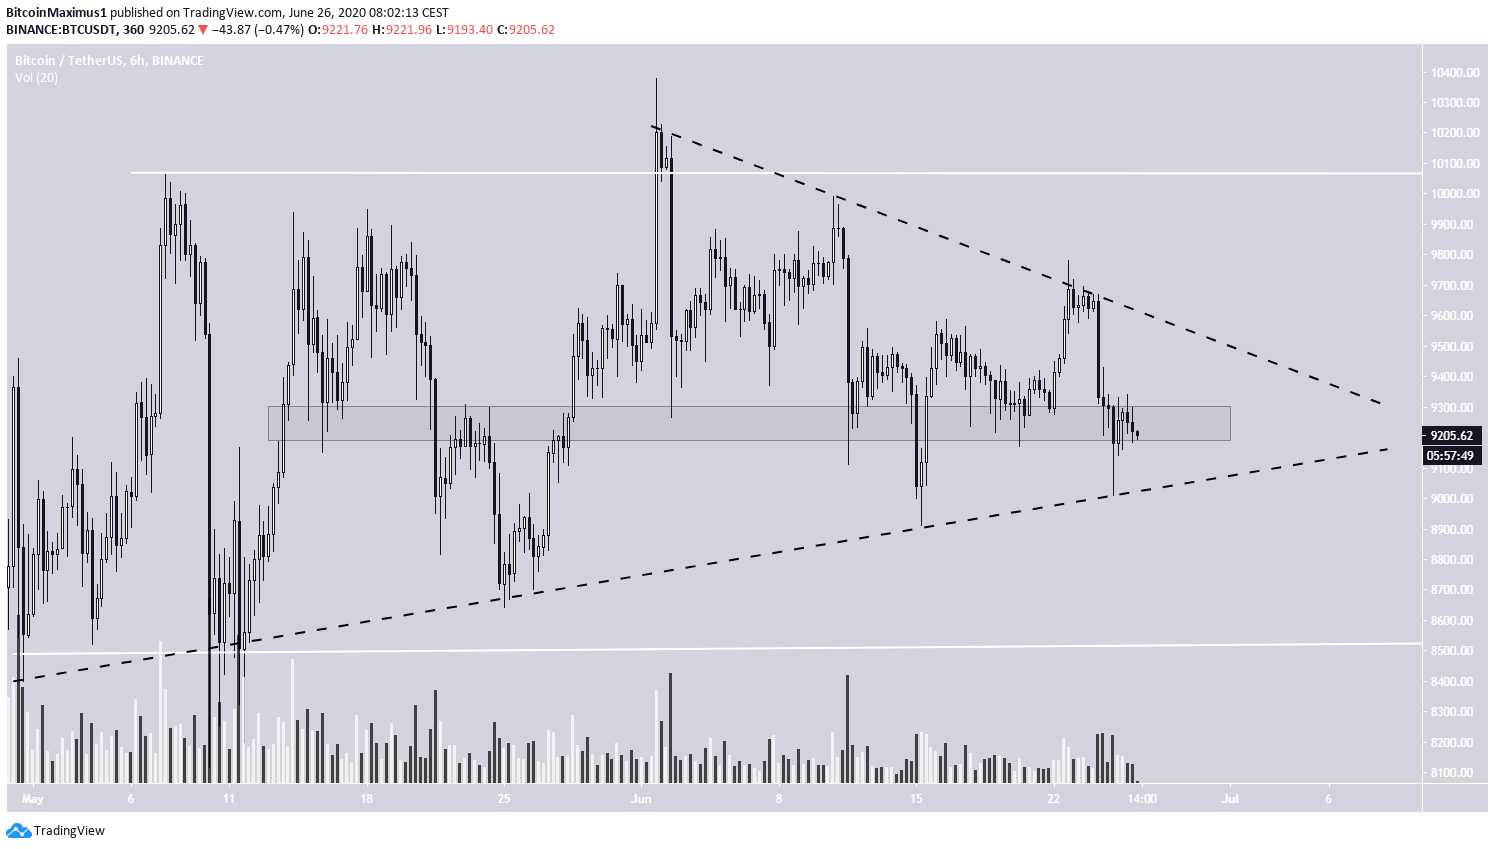
To conclude, whether the Bitcoin price breaks out or down from the current pattern will determine if it heads to the range high or range low.
For our previous analysis, click here.


