


The Bitcoin price decreased considerably on June 24, creating a bearish engulfing candlestick and erasing almost all of the gains made from the June 22 breakout.
However, the price is still trading inside a strong support area backed by the 50-day moving average (MA).
Current Bitcoin Support
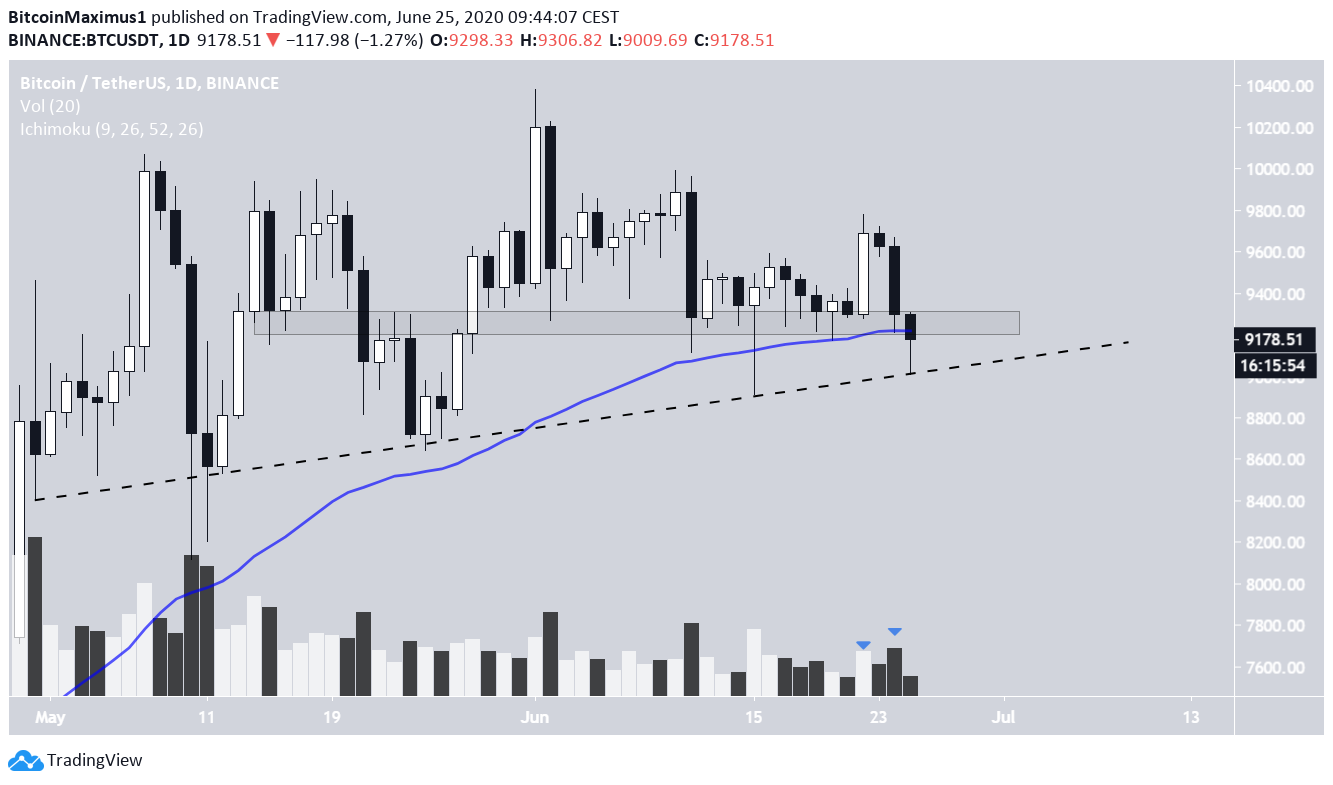
The main support for Bitcoin is found at $9,250, slightly above the current price. The area has intermittently acted as resistance and support since May 14, and whether the price is trading above or below this level will likely be an important determinant of Bitcoin’s future trend.
Bitcoin is also trading right at the 50-day moving average (MA), which has recently supported the price. Furthermore, BTC is possibly following an ascending support line. Therefore, the confluence of support levels at the current price indicates that a breakdown below them would definitely confirm that the trend is bearish.
On the other hand, a bounce at these levels could create a bullish hammer candlestick similar to the one created on June 15.
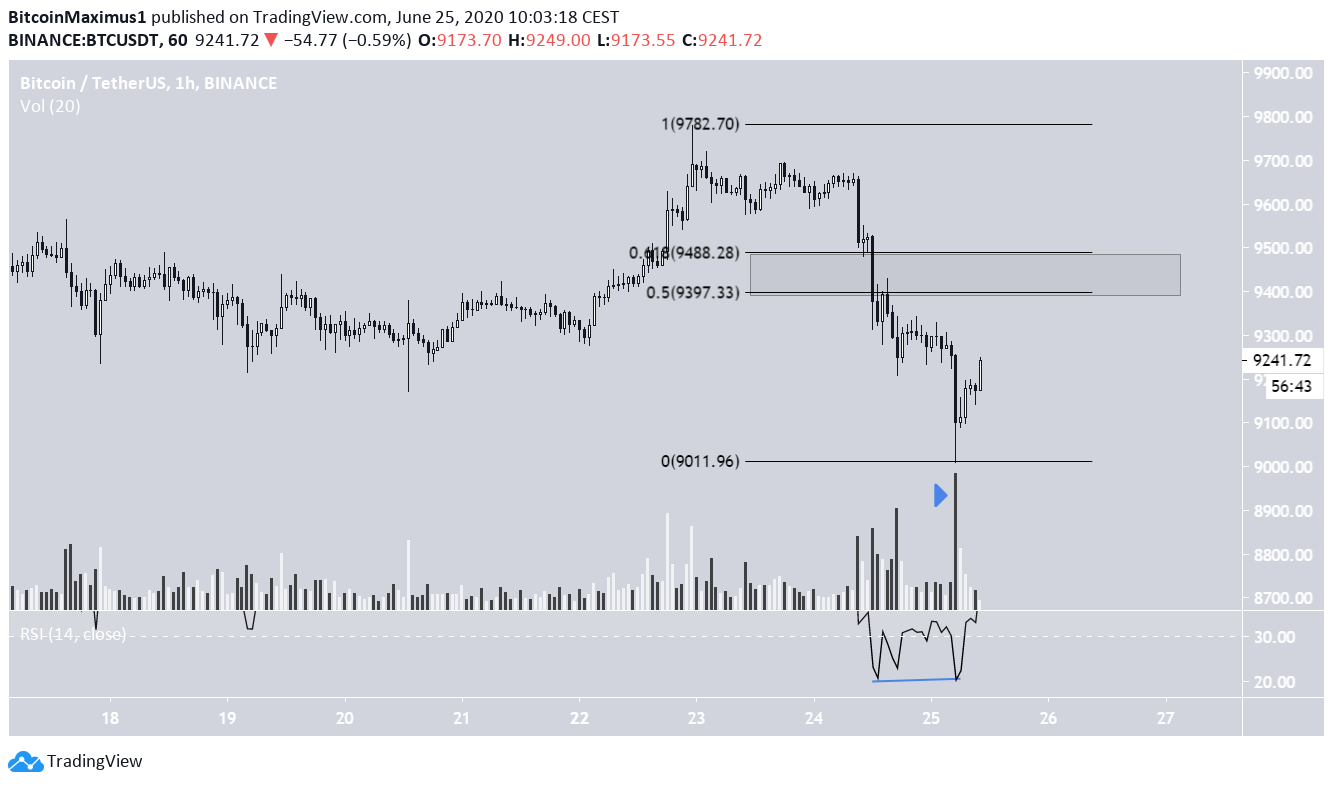
In the short-term, it seems that BTC is attempting to initiate a bounce, as evidenced by the long lower-wick with high volume. Furthermore, there is some bullish divergence in the hourly RSI.
If the price continues to move upwards, the closest resistance area is found between $9,400-$9,500, the 0.5-0.618 Fib levels of the entire downward move.
This movement would create the hammer discussed in the previous section.
Long-Term Movement
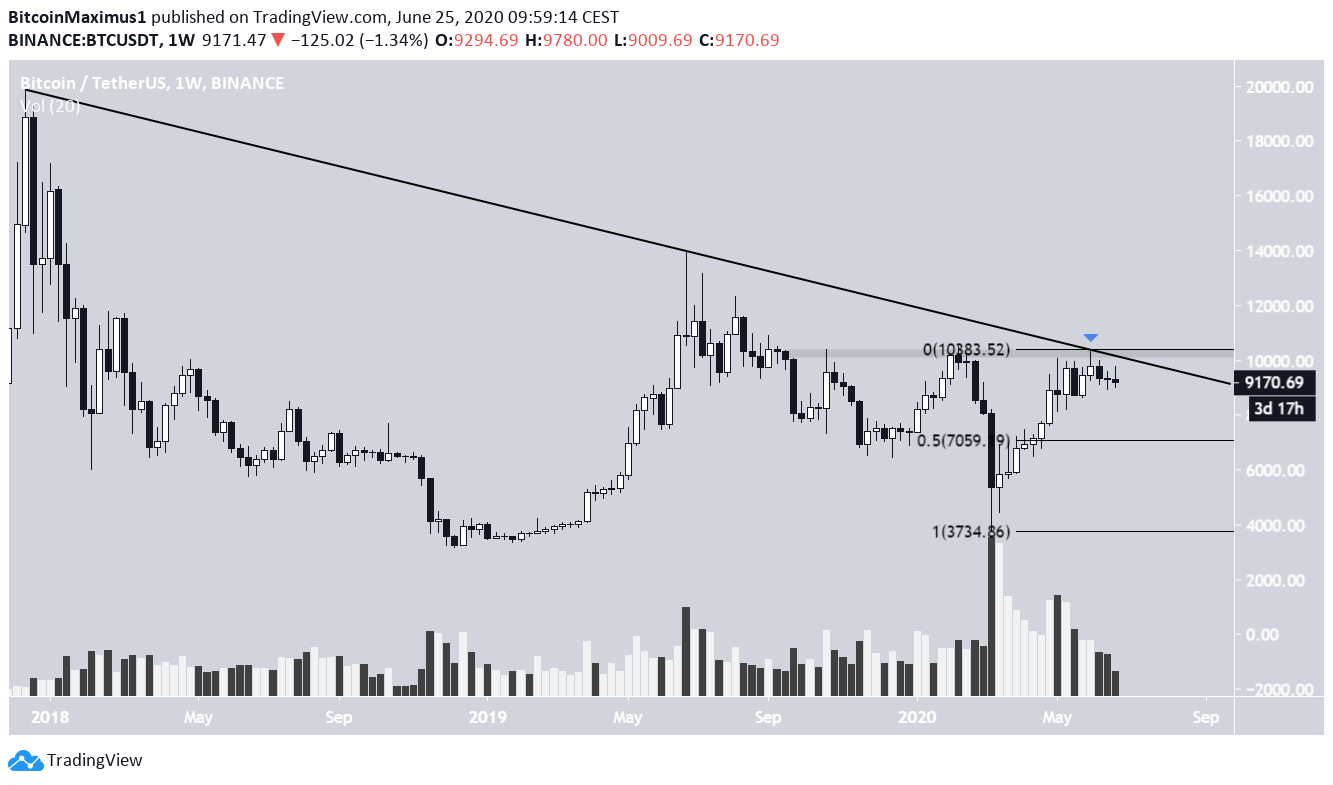
The weekly chart states that Bitcoin is still clearly bearish. The price has been following a descending resistance line since the December 2017 all-time high, currently touching it for the third time. Furthermore, it has created a weekly shooting star candlestick, which is normally a sign of a reversal following a prolonged upward move.
Until the price breaks out from this resistance line and area, the trend cannot be considered bullish.
If a reversal were to occur, due to the lack of support, BTC could decrease all the way to $7,050, the 0.5 Fib level of the entire upward move.
For our previous analysis, click here.



