


The Bitcoin (BTC) price has been decreasing since Aug 17 and has fallen below the previous breakout level.
Unless the level is reclaimed, the price movement is considered bearish.
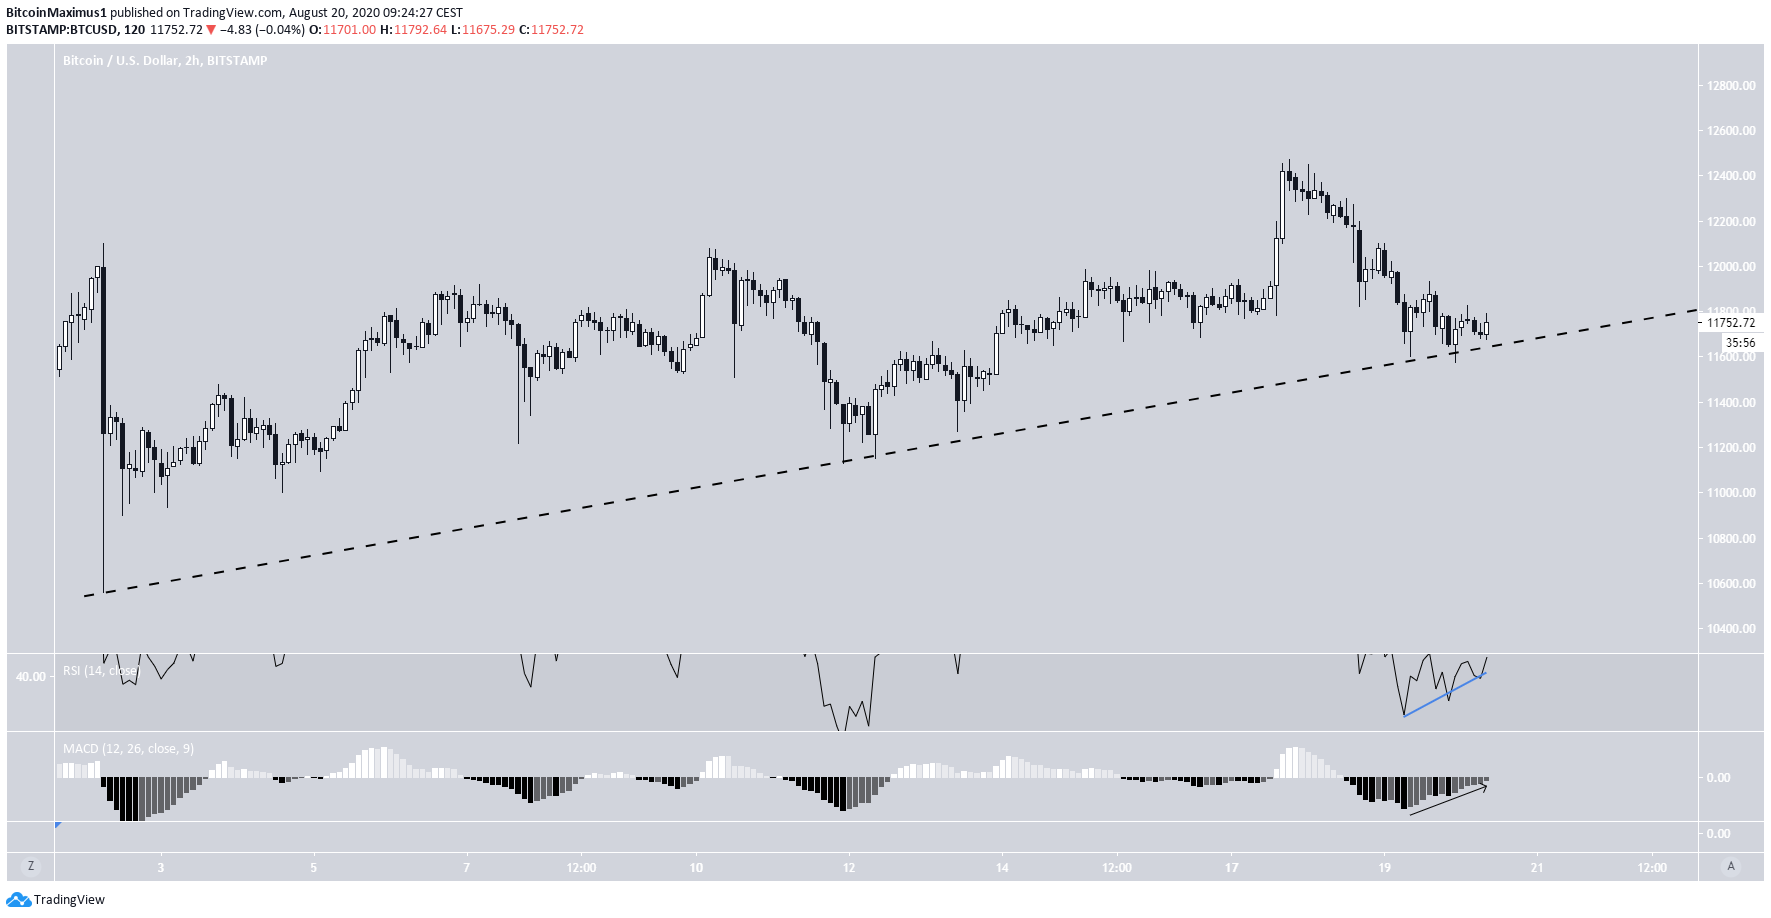
Bitcoin Trading Range
On Aug 17, the Bitcoin price broke out from the $11,950 area, which had been acting as resistance since the Aug 2 high.
However, higher prices could not be sustained. BTC has been decreasing since, falling back below the $11,950 level, which is now expected to act as resistance.
The closest support area is found near $11,150, coinciding with the 50-day moving average (MA).
Technical indicators are bearish. There is a bearish divergence in the RSI, and the short-term MACD has crossed into negative territory. The long-term MACD shows a decrease in momentum as well and has given a bearish reversal signal. Volume has also been increasing during the drop, another bearish sign.

The shorter-term chart reveals that the price has been following an ascending support line since Aug 2, and is currently sitting on the line. There is a small bullish divergence in both the RSI and the MACD, suggesting that a bounce is likely.
Until the price is able to reclaim the previous breakout level at $11,950, the price movement is considered bearish.
Bearish Wave Count
In yesterday’s analysis, we stated that the price is likely in a C corrective wave, which is expected to end in the ranges of $10,954-$10,850 or $9,659-$9,732.
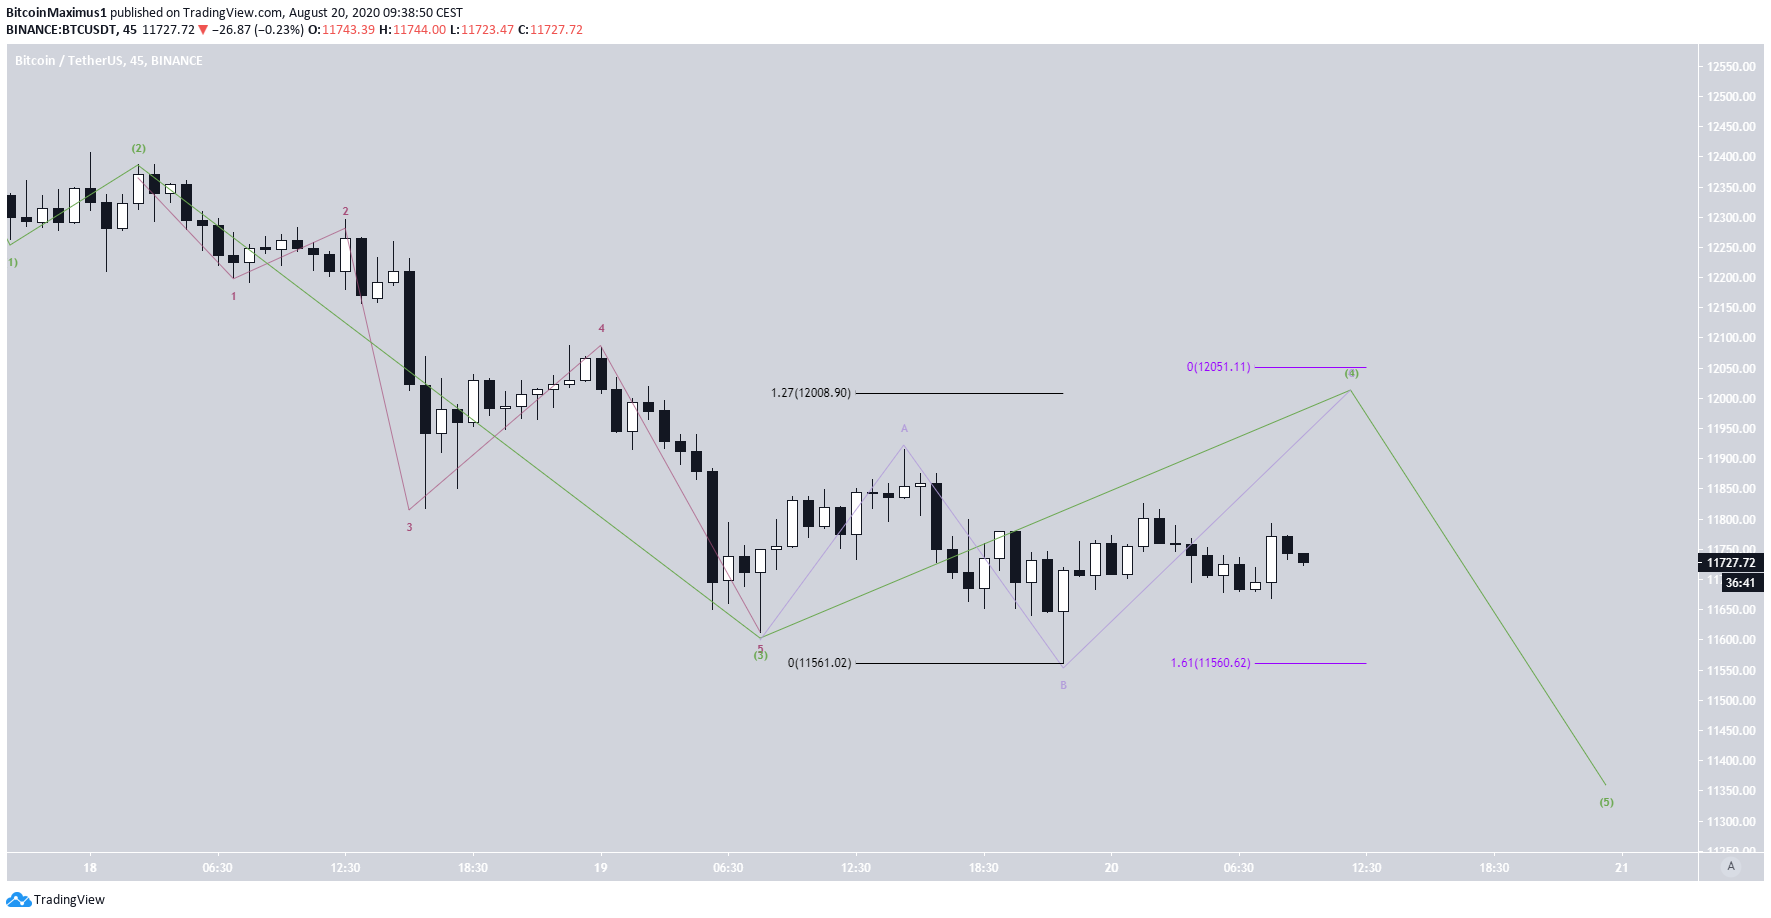
We can further outline the decrease by mapping a possible five-wave count (orange) for wave C. It seems that the price is in the first wave, which is transpiring in five sub-waves (green).
BTC is currently in sub-wave 4. which could end near the 0.5 Fib level of the entire decrease at $12,000. Due to the length of time for the downward move, the upwards reversal is expected to end today in the afternoon.
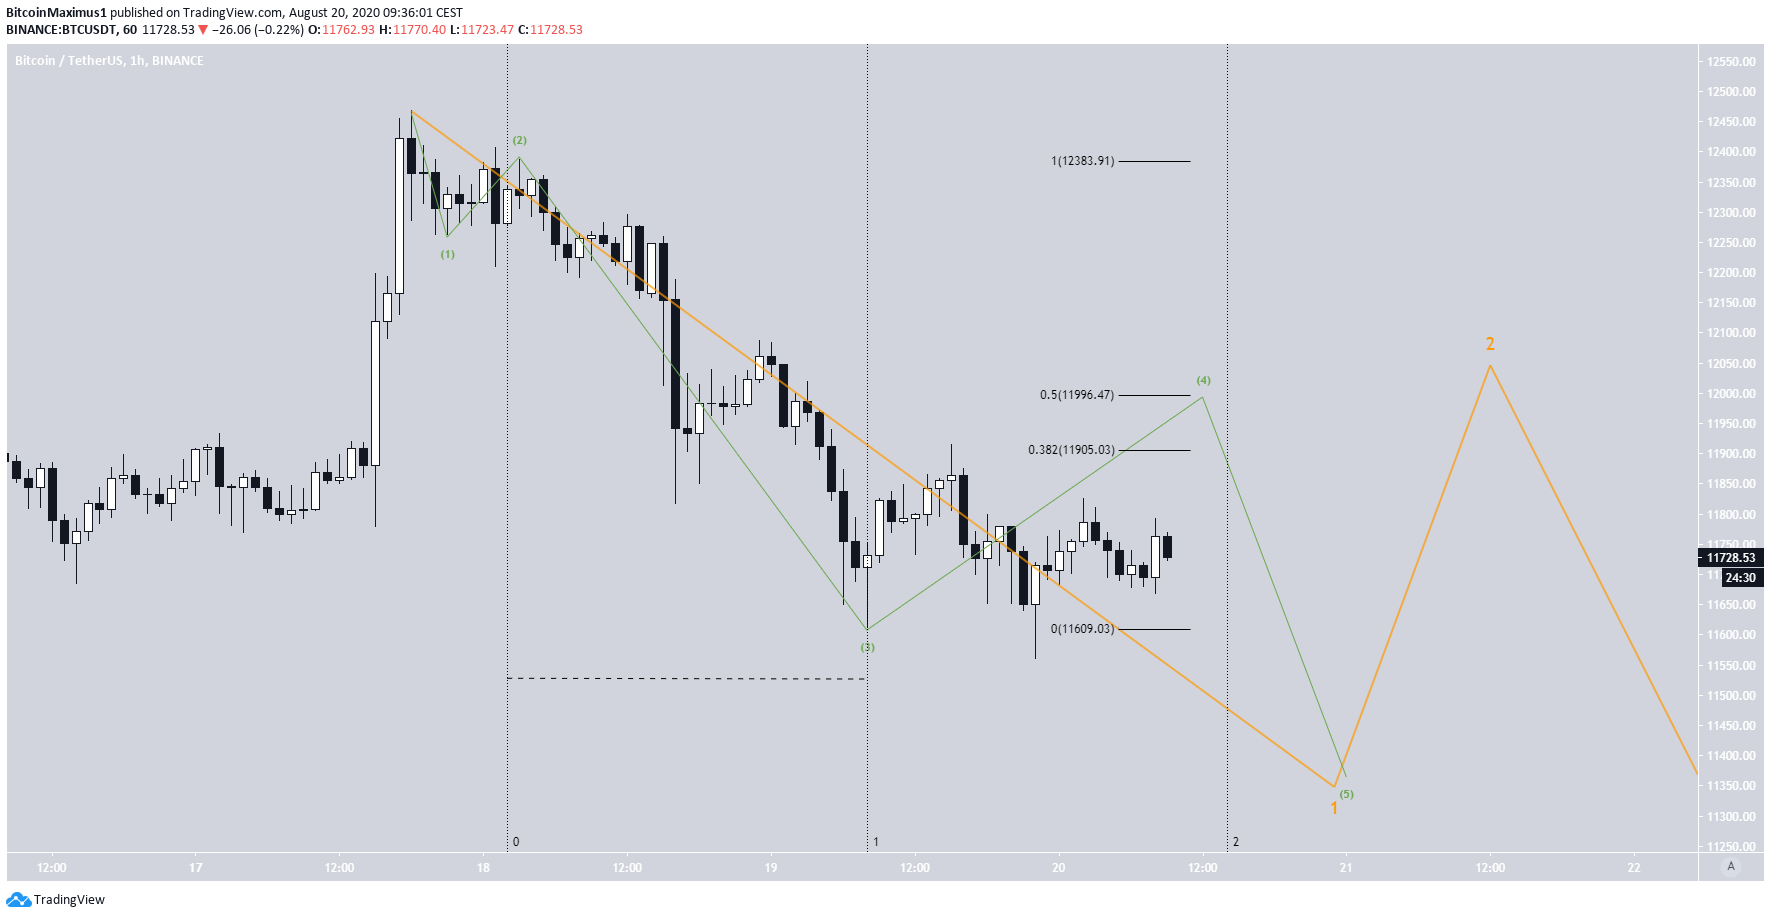
We can further outline an A-B-C corrective formation (purple) inside wave 4. A similar target near $12,000 is given by the 1.27 external Fib retracement of sub-wave B, and the 1.61 Fib of sub-wave A, making this a likely level for the reversal to end before the price resumes its downward movement.
To conclude, the Bitcoin price has likely begun a corrective movement since it failed to sustain higher prices after a breakout.
For our previous Bitcoin analysis, click here!


