
Bitcoin (BTC) is trading inside a parallel ascending channel and has created a triple-top pattern.
Whether the price breaks out or down from the channel will be a key factor in determining its future movement.
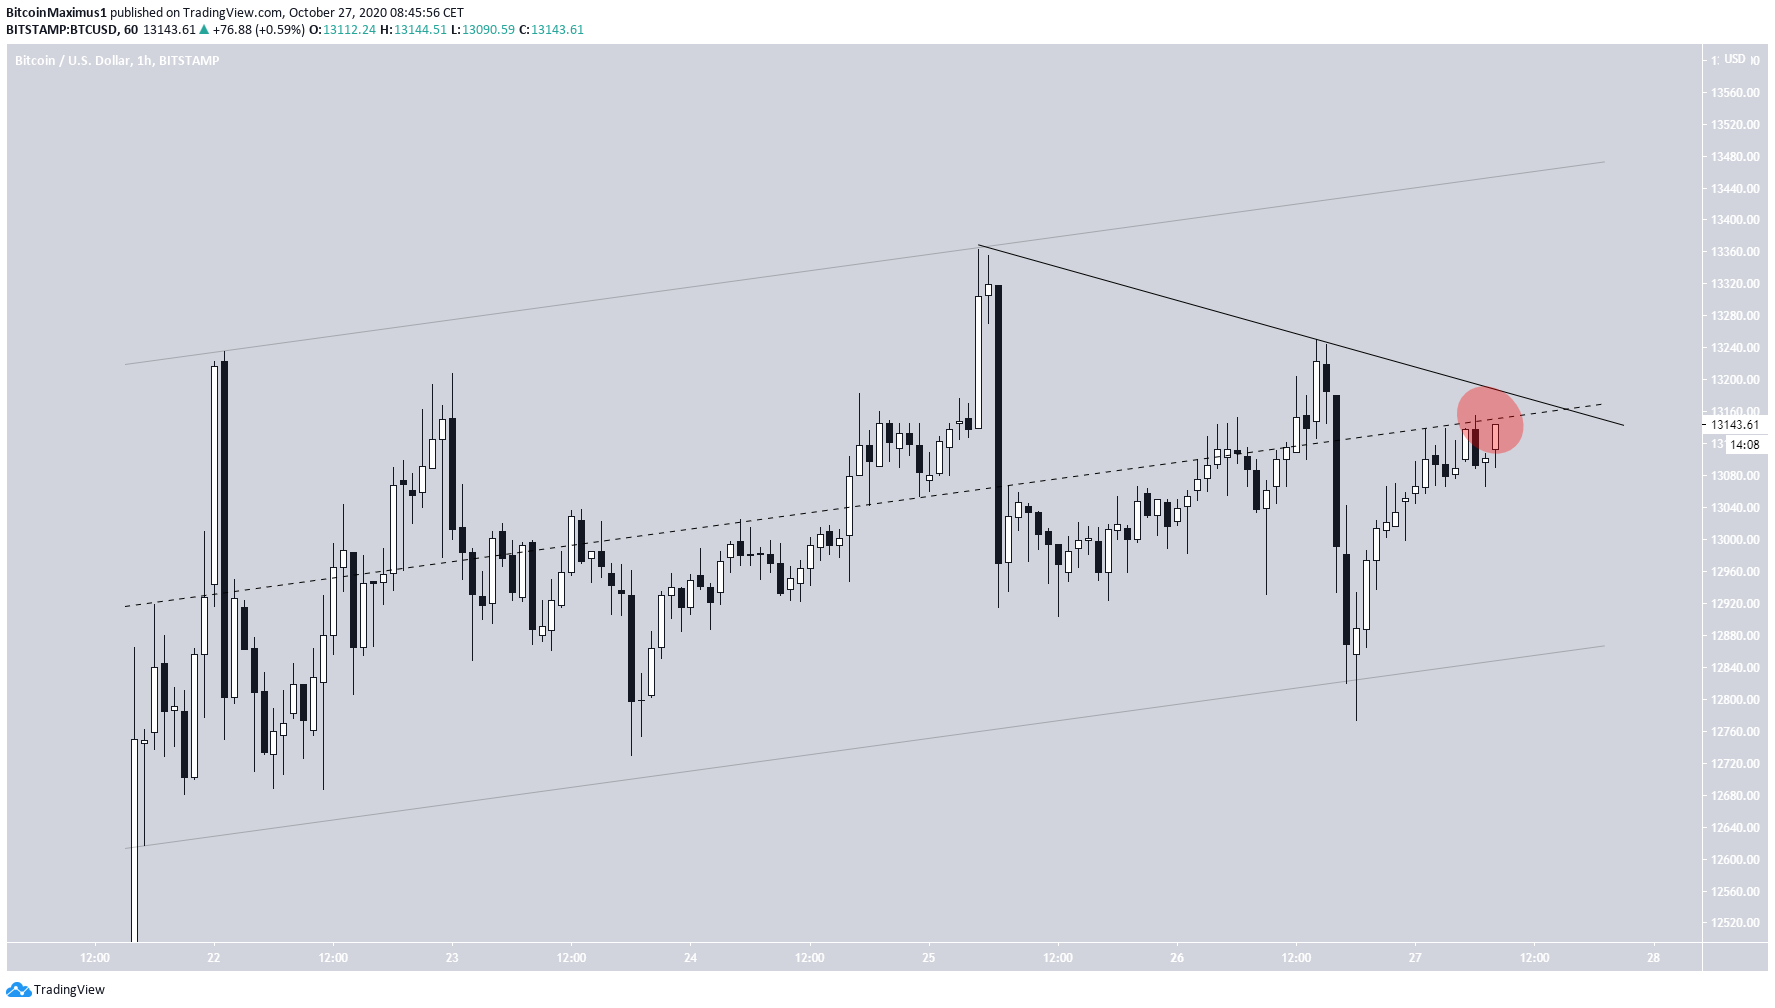
Bitcoin Parallel Ascending Channel
The Bitcoin price has been trading inside a parallel ascending channel since it reached a high of $13,235 on Oct 22.
Yesterday, the price dropped sharply, almost breaking down from the support line of the channel. However, a bounce followed afterward that took the price towards the middle of the channel.
At the time of writing, the price was facing significant resistance (shown as a red circle below) from both the middle of the channel and a possible descending resistance line drawn from the two previous highs.
A breakout above this level would be a significant bullish development, signaling an increase towards the resistance line of the channel and possible breakout.
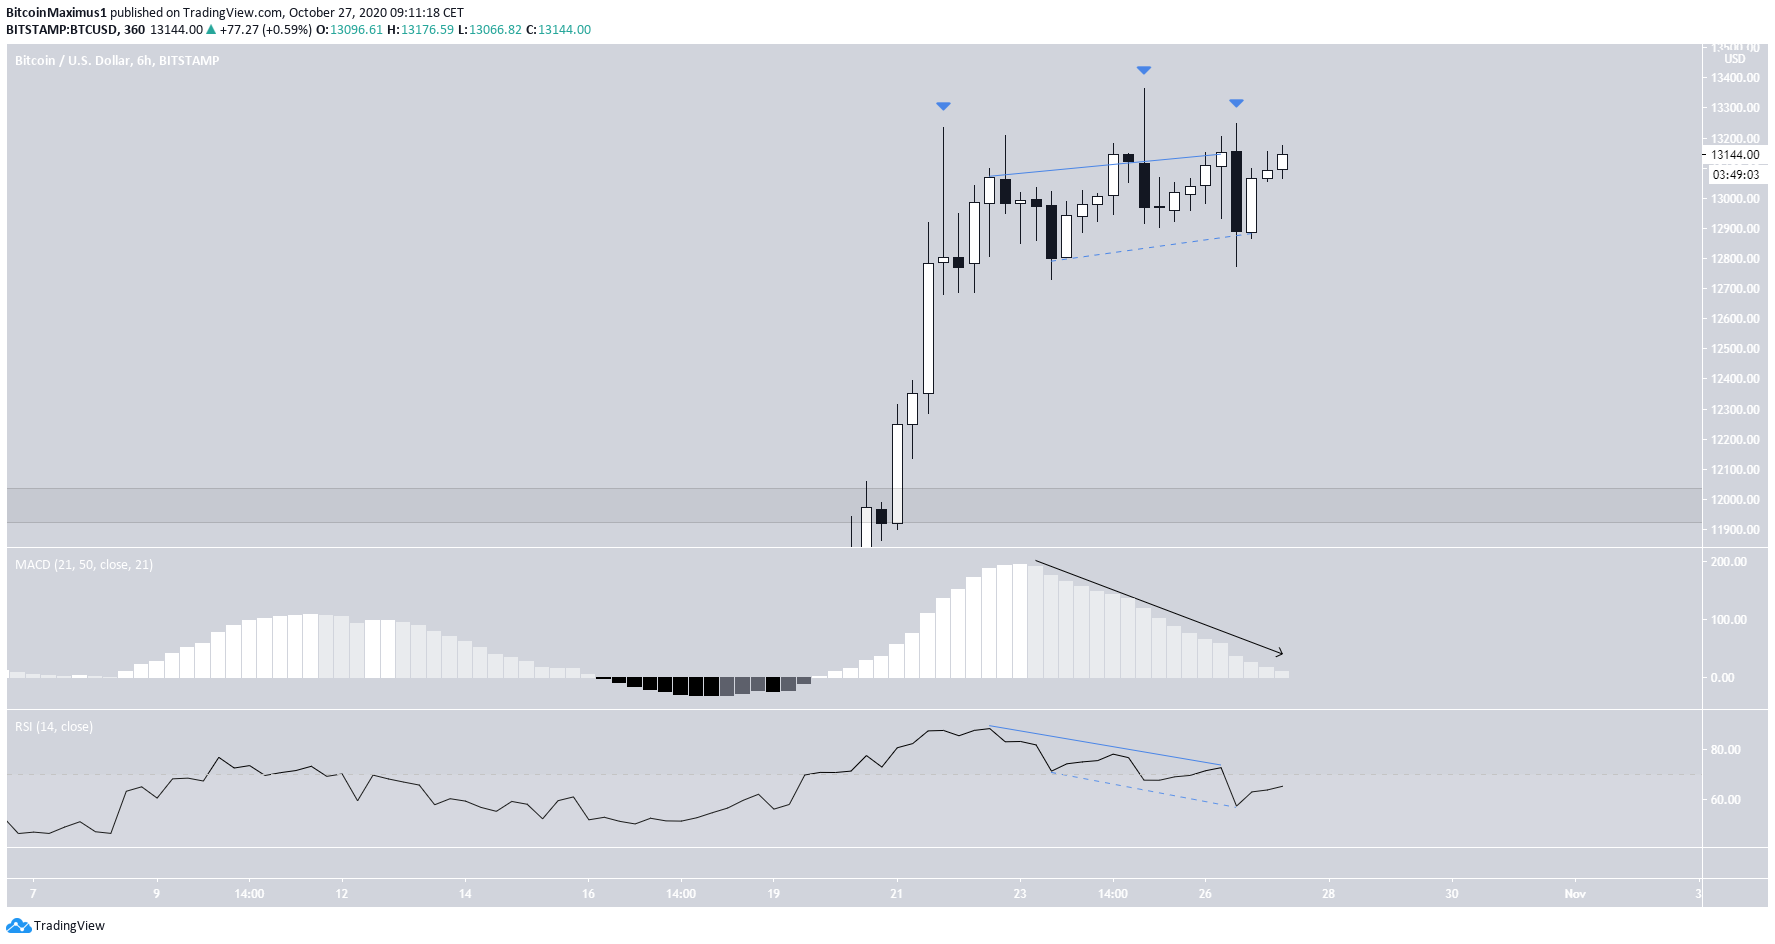
Technical Indicators Show Ambiguity
Technical indicators in the six-hour time-frame are leaning on bearish, but there is ambiguity.
On the bearish side, the price has created what looks like a triple-top pattern, characterized by long upper wicks, a shooting star candle, and a bearish engulfing candlestick. Furthermore, the RSI has generated a considerable bearish divergence and the MACD is decreasing.
On the other hand, there is a hidden bullish divergence in the RSI, which could negate the regular bearish divergence since it is transpiring afterward.
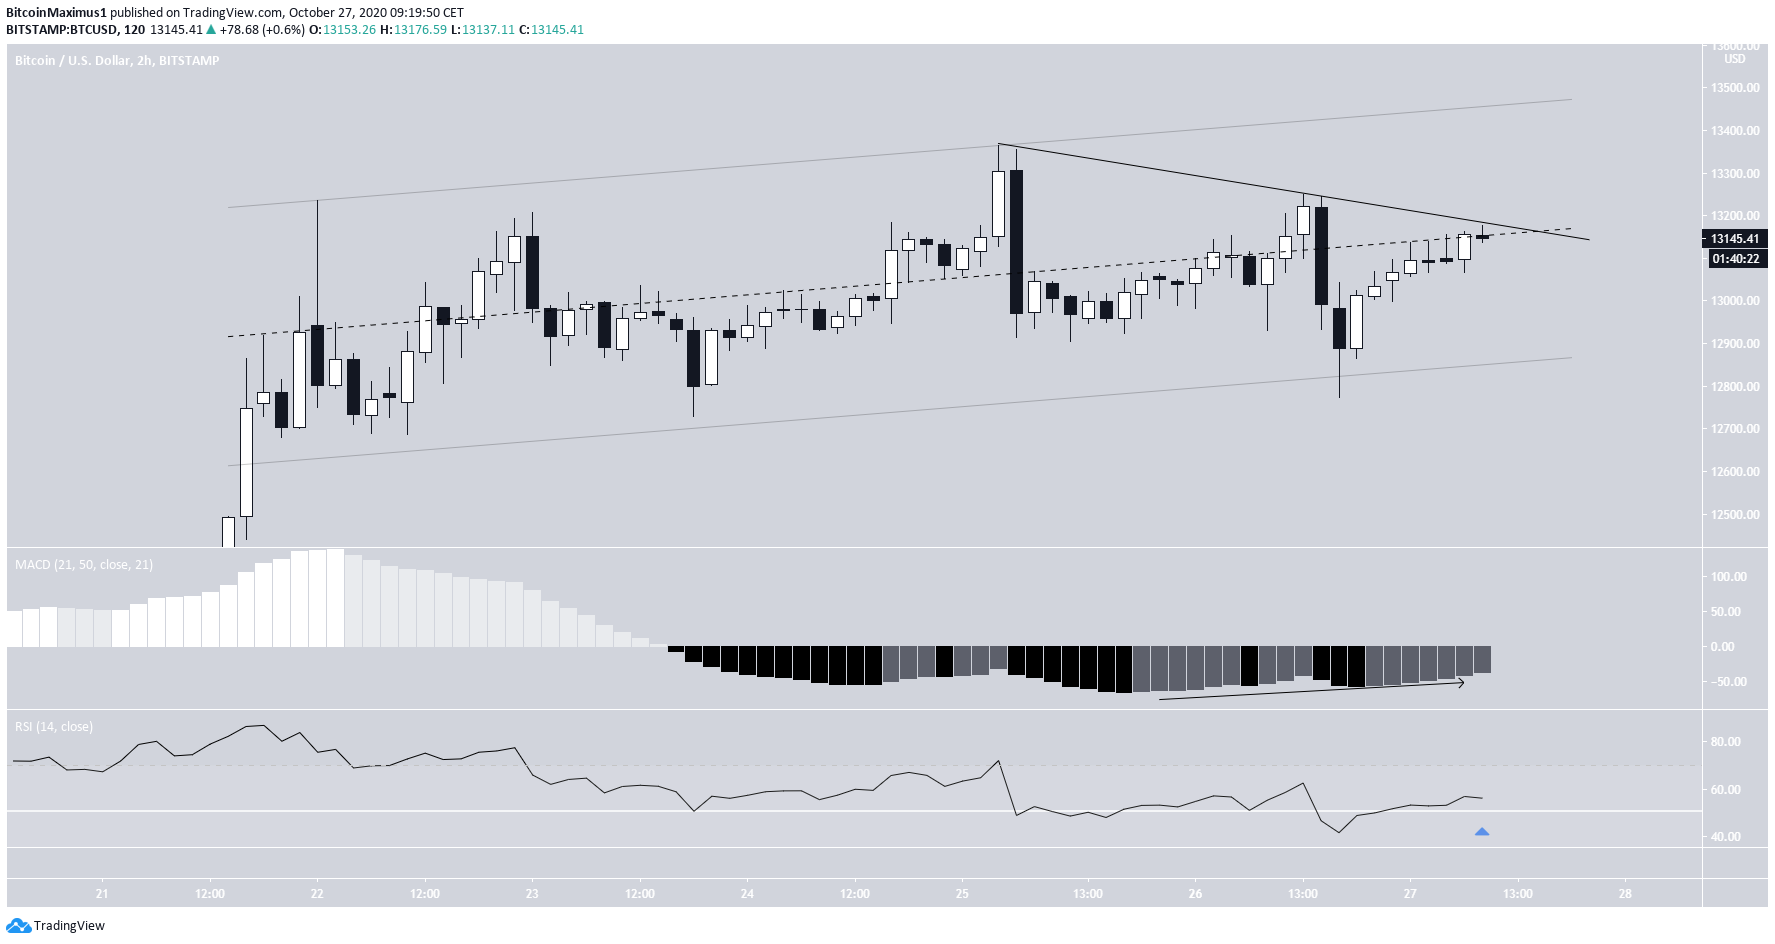
The two-hour chart is leaning slightly bullish. The MACD has begun to increase and there is a slight bullish divergence.
Therefore, whether or not BTC is successful in moving above the middle of the channel will be helpful in determining a bullish or bearish trend.
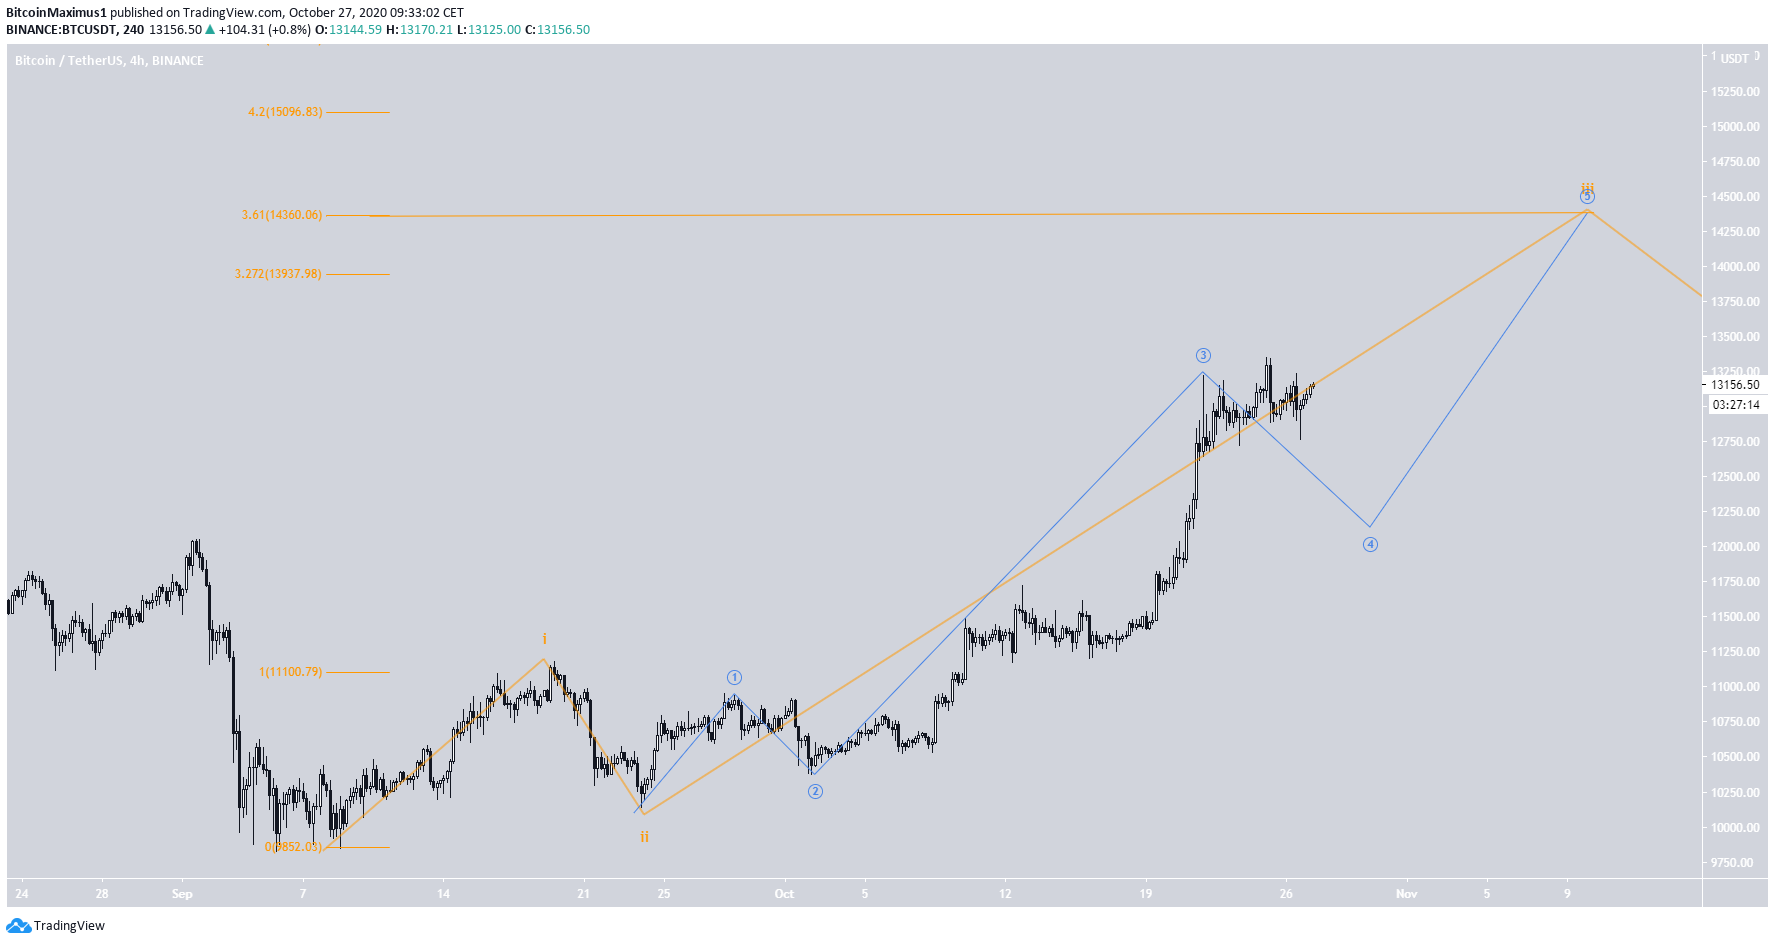
Wave Count
It is likely that BTC began a bullish impulse on Sept 7 (shown in orange below) and is currently in wave 3. This wave has a preliminary target of $14,360 — the 3.61 Fib level of the length of wave 1.
However, the sub-wave count is not entirely clear. While the most likely scenario suggests that the price has just completed sub-wave 3 (blue) and will now correct in the short-term, the time it’s taken for the corrective movement to begin and the ambiguity in technical indicators cast some doubt.
A breakdown from the channel would likely confirm that the correction has begun.
A breakout from the aforementioned short-term descending resistance line and parallel channel would likely mean that the price has begun sub-wave 5 or is in an extended sub-wave 3.
For BeInCrypto’s previous Bitcoin analysis, click here!
Disclaimer: Cryptocurrency trading carries a high level of risk and may not be suitable for all investors. The views expressed in this article do not reflect those of BeInCrypto.
