
On June 27, 2019, the Bitcoin Cash price reached a high of $515. A flash crash ensued shortly after. BCH reached lows close to $380 on July 2.
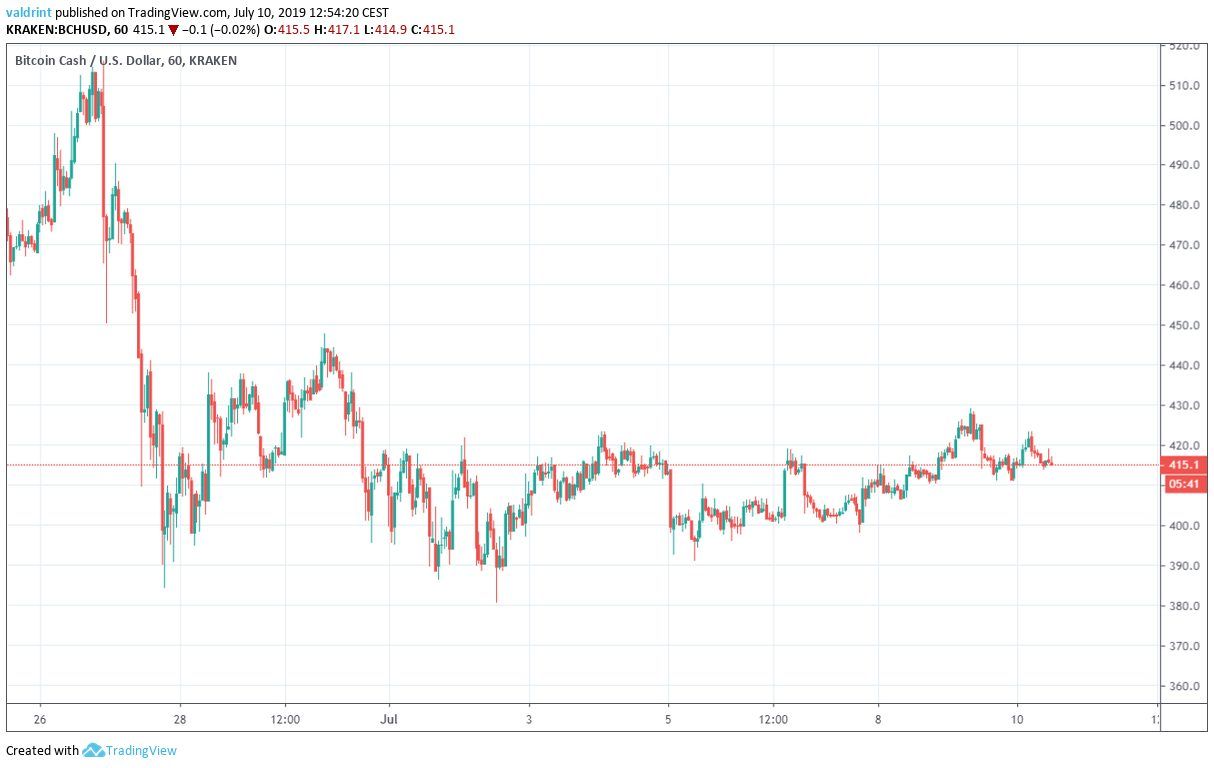
Since then, it has been gradually increasing.
Will it again reach highs above $500 or will BCH drop below $400? Below, we will analyze the BCH price in different time-frames alongside technical indicators in order to answer that question.
If you want to trade Bitcoin Cash (BCH) safely and securely on our partner exchange, follow this link to get set up on XCOEX.
For our previous analysis, click here.
Bitcoin Cash Price: Trends and Highlights for July 10
- BCH/USD is trading inside short- and long-term ascending channels.
- Bullish divergence is developing in the RSI.
- Short-term moving averages have made a bullish cross.
- There is resistance near $440.
BCH Price in an Ascending Channel
Since reaching a low of $380.2 on July 2, BCH has been gradually increasing, creating the ascending channel outlined below:
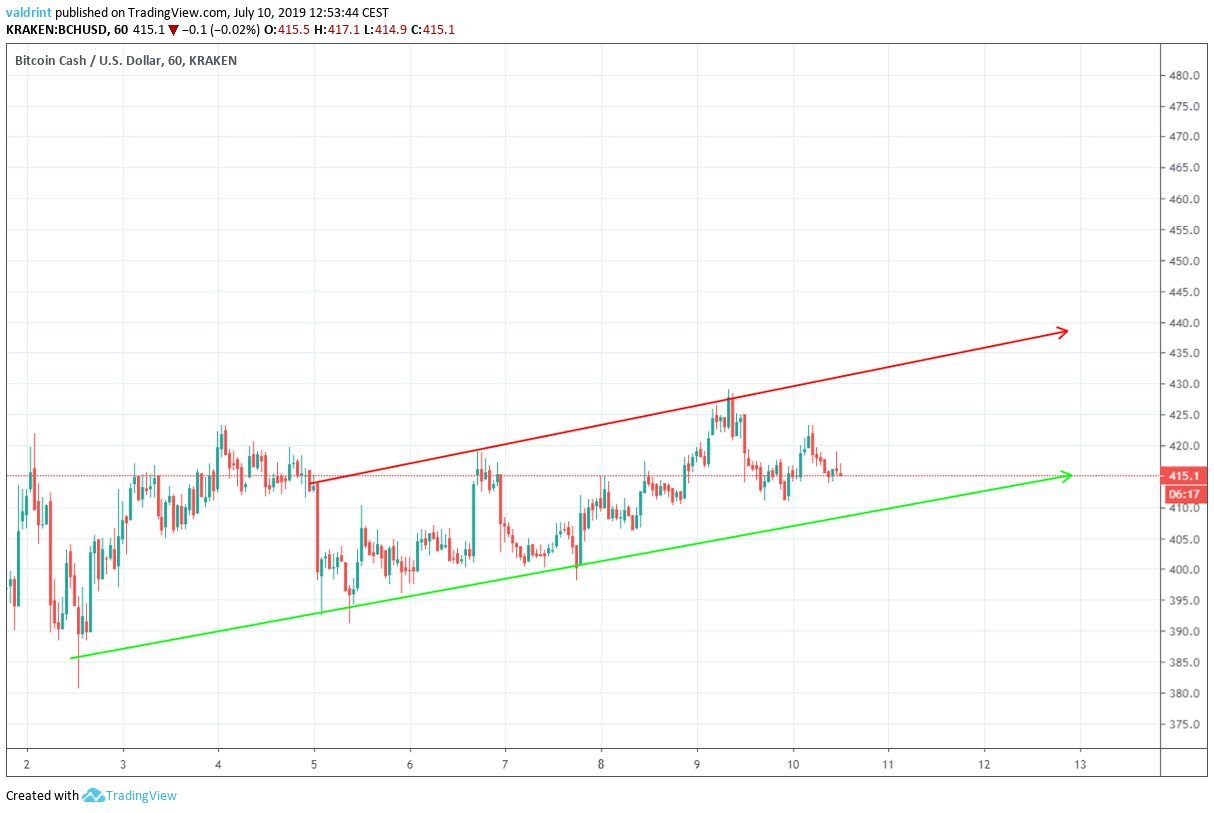
During this time, it has not experienced any significant fluctuations.
At the time of writing, it was trading in the middle of the channel.
Where will it go next?
Further Increases Ahead?
While the resistance line has been touched several times, indicating failed attempts at a breakout, the support line has only been touched three times, the last being on July 2.
Around that time, the RSI began to generate significant bullish divergence.
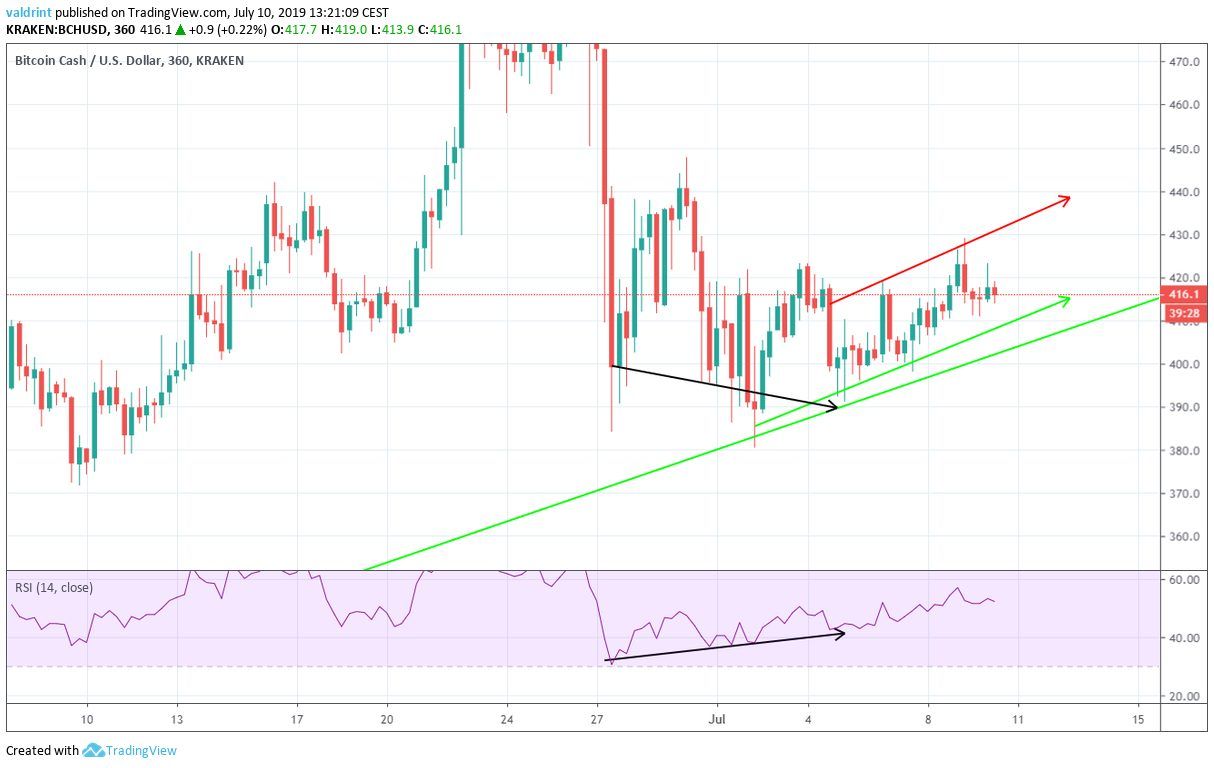
This divergence marked the beginning of the short-term ascending triangle.
However, it is not present in longer-term time-frames.
Additionally, the 10- and 20-period moving averages (MA) also suggest future price increases.
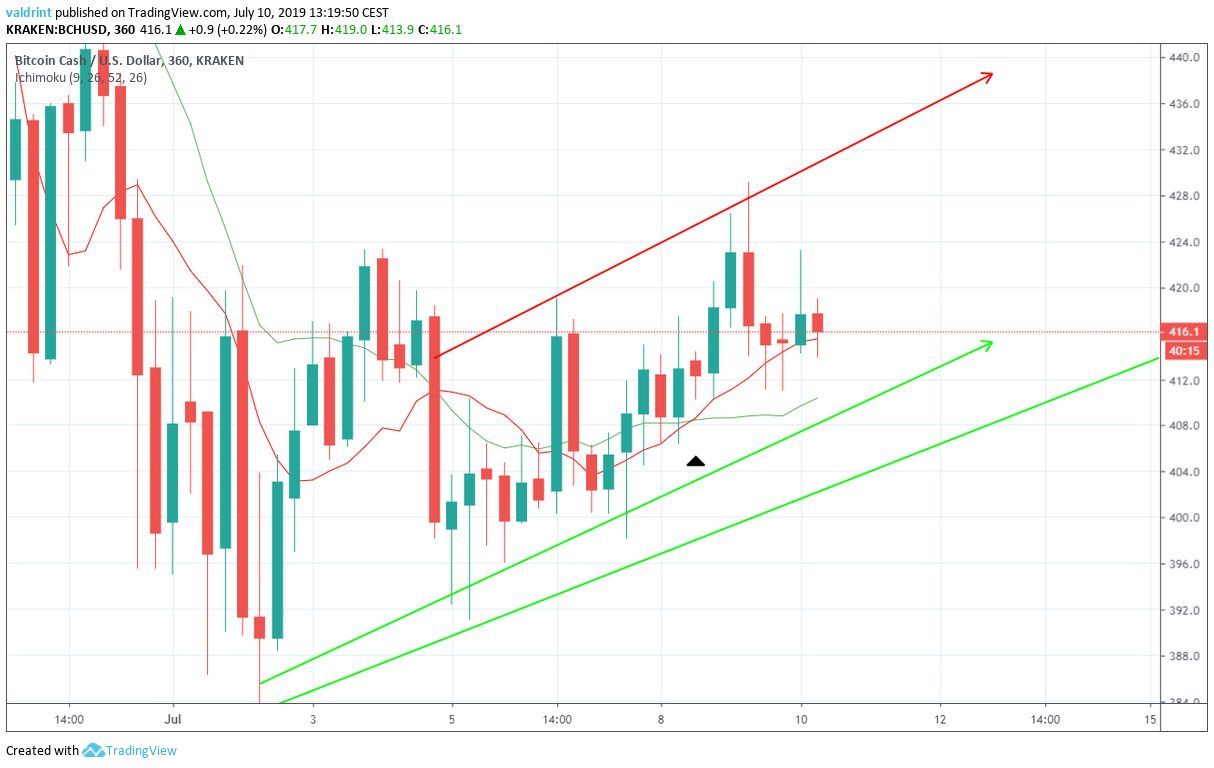
A bullish cross transpired on July 8.
Since then, the BCH price has been trading above both MAs, finding close support above the 10-period one.
The use of these indicators makes it likely that the price will continue to increase at the rate predicted by the channel and possibly break out.
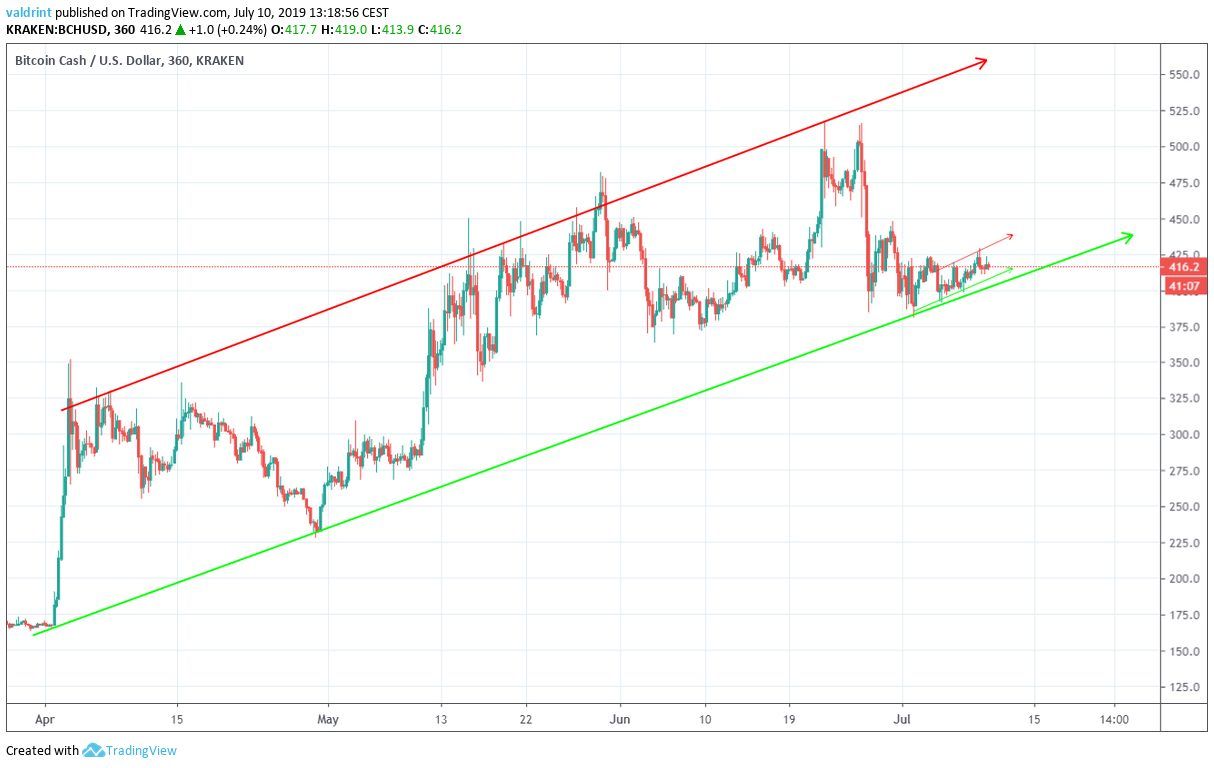
Reversal Areas
One resistance area is traced for BCH/USD below:
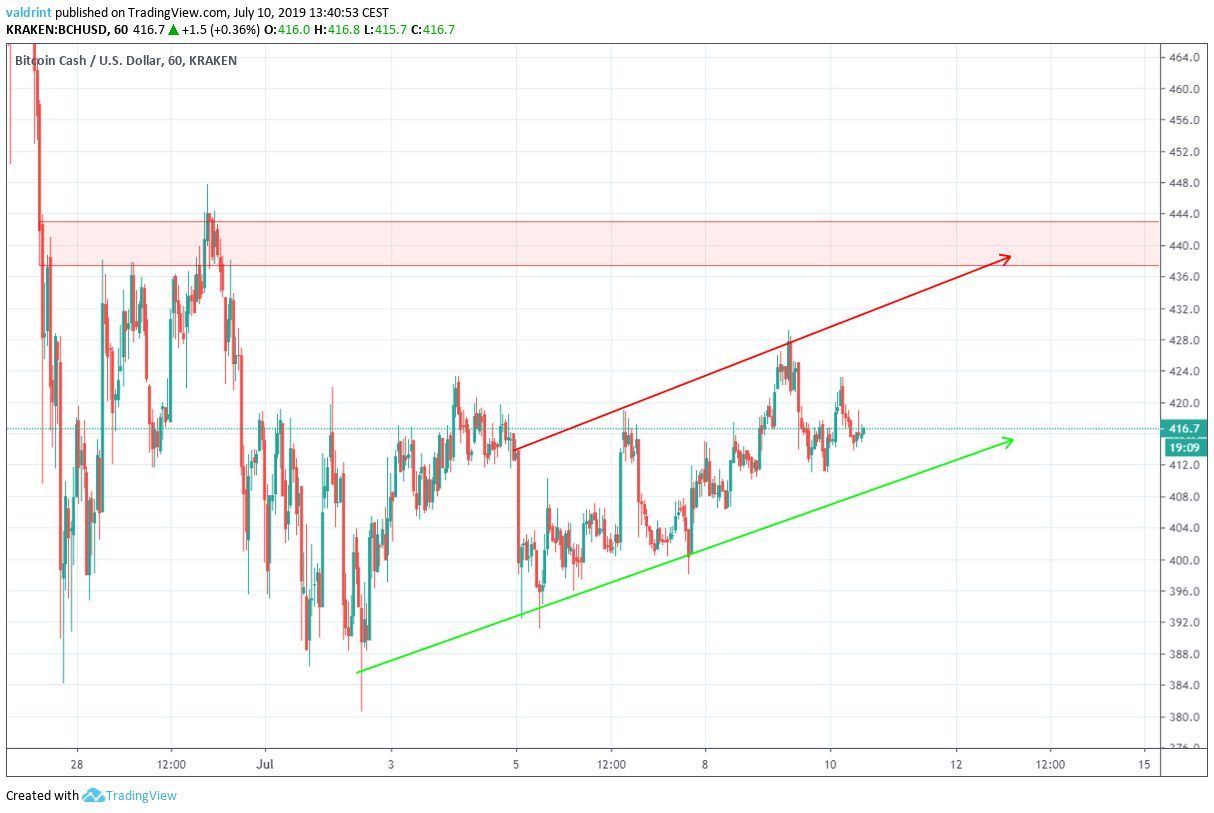
The closest resistance area is found near $440.
If the Bitcoin Cash price breaks out from the channel, it is likely to provide resistance.
If the price continues to increase at the rate predicted by the channel, it should reach this area by July 15.
Summary
The BCH price is trading inside long- and short-term ascending channels.
Technical indicators support continued price increases.
There is resistance near $440.
Do you think the BCH price will break out from the channel? Let us know in the comments below.
Disclaimer: This article is not trading advice and should not be construed as such. Always consult a trained financial professional before investing in cryptocurrencies, as the market is particularly volatile.
Images are courtesy of Shutterstock, TradingView.
