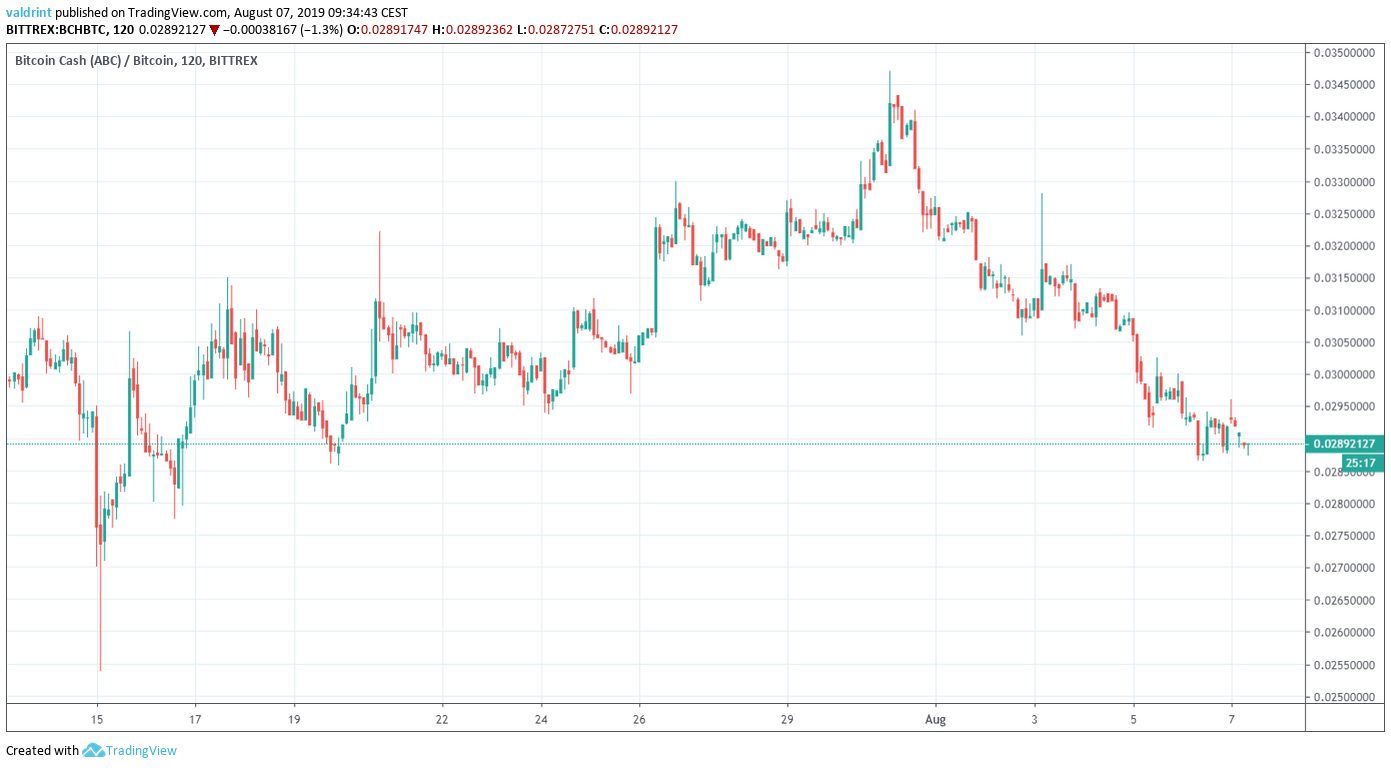
On July 15, 2019, the Bitcoin Cash price reached a low of ₿0.025. A gradual upward move followed. On July 31, BCH reached a high of ₿0.034. It has been decreasing since.
How long will the Bitcoin Cash price continue to decrease? Continue scrolling below if you are interested in finding out.
For our previous analysis click here.
If you are interested in margin trading Bitcoin Cash (BCH) and other cryptocurrencies with a multiplier of up to 100x on our new partner exchange with the lowest fees, follow this link to get a free StormGain account!
Bitcoin Cash Price: Trends and Highlights for August 7
- BCH/BTC broke down from an ascending support line.
- It is following a long-term descending resistance line.
- There is support at ₿0.025.
- Long- and short-term moving averages are very close to making a bearish cross.
Previous Movement
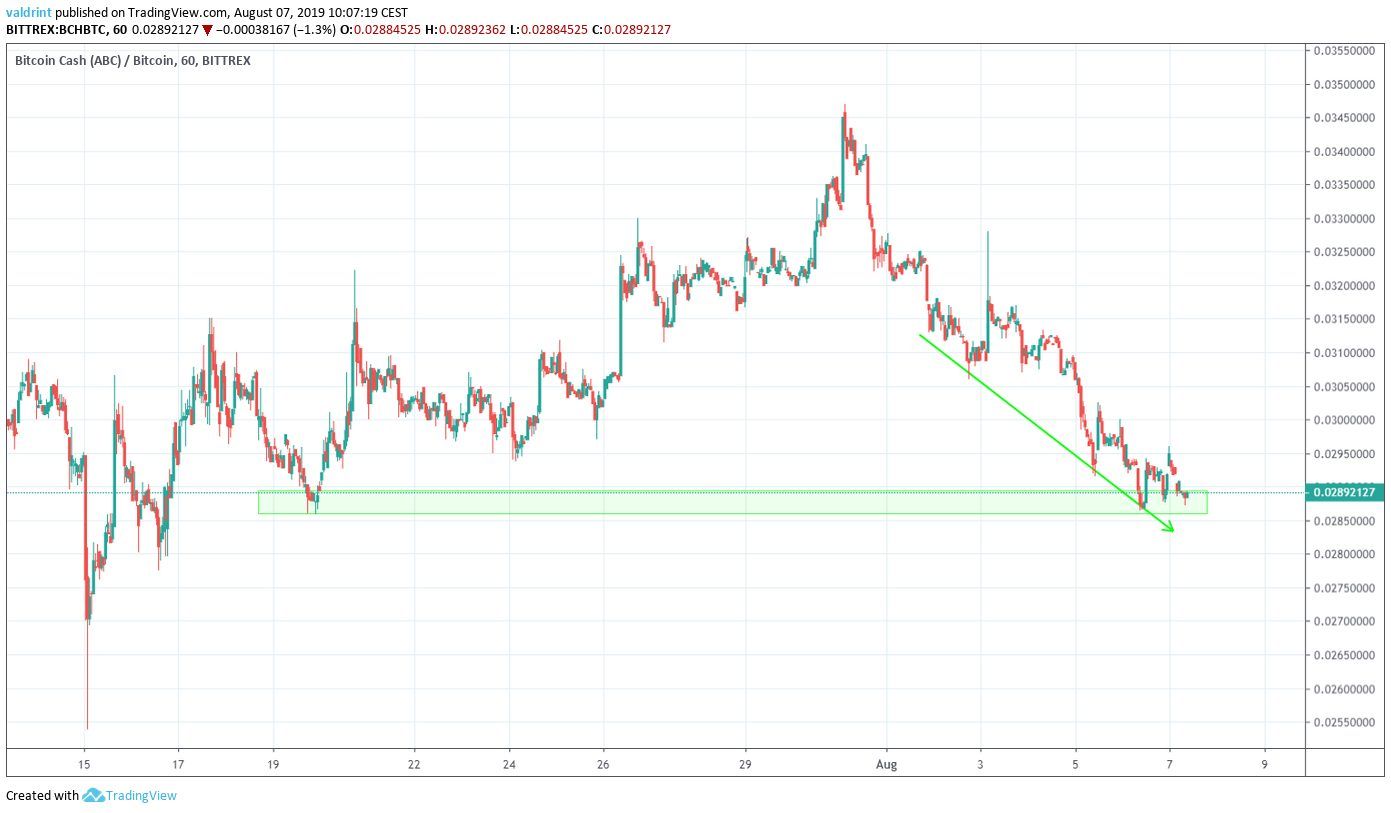
Since reaching the aforementioned low on July 15, the Bitcoin Cash price has been following an ascending support line.
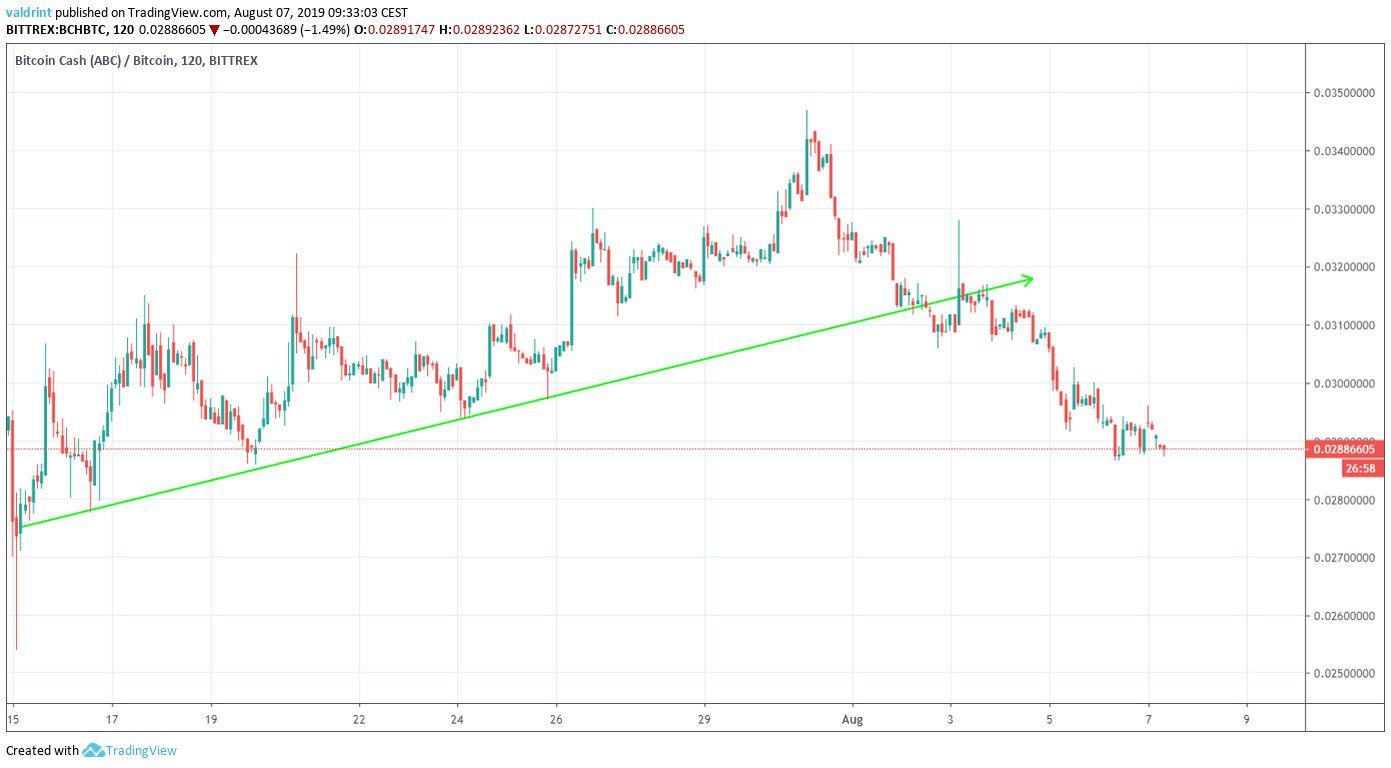
The decrease starting on July 31 caused the price to decrease until it reached the line.
However, instead of bouncing, the Bitcoin Cash price broke down.
At the time of writing, it was trading below ₿0.029.
Where will it go next?
Descending Resistance Line
A look at the daily time-frame shows that BCH has been following a descending resistance line since April 01.
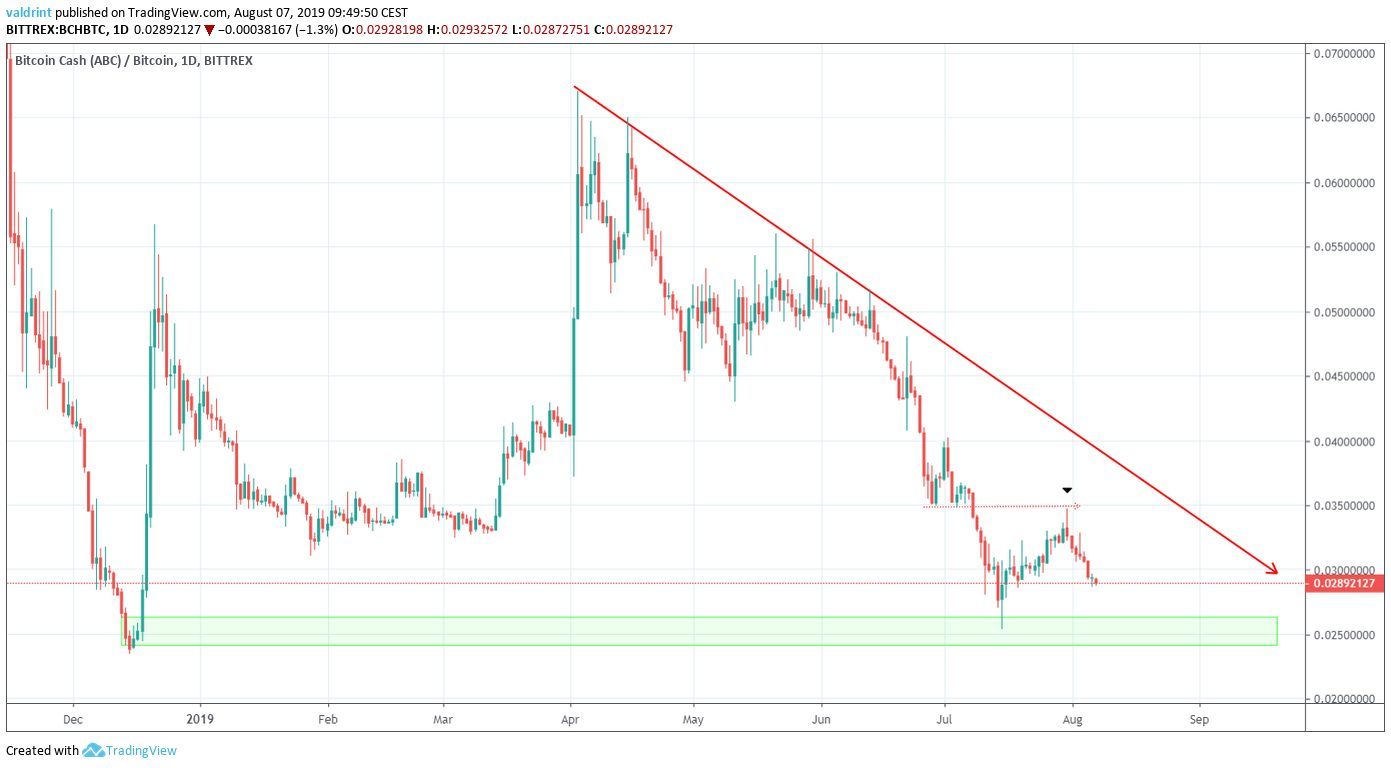
Additionally, we can see that once the Bitcoin Cash price reached the minor resistance area at ₿0.035, it immediately began to decrease, creating a long lower wick in the process.
The closest support area is found at ₿0.025.
The price has not traded below this area since December 2018.
Multiple Bearish Crosses
Incorporating moving averages (MA) into the analysis paints a bearish outlook.
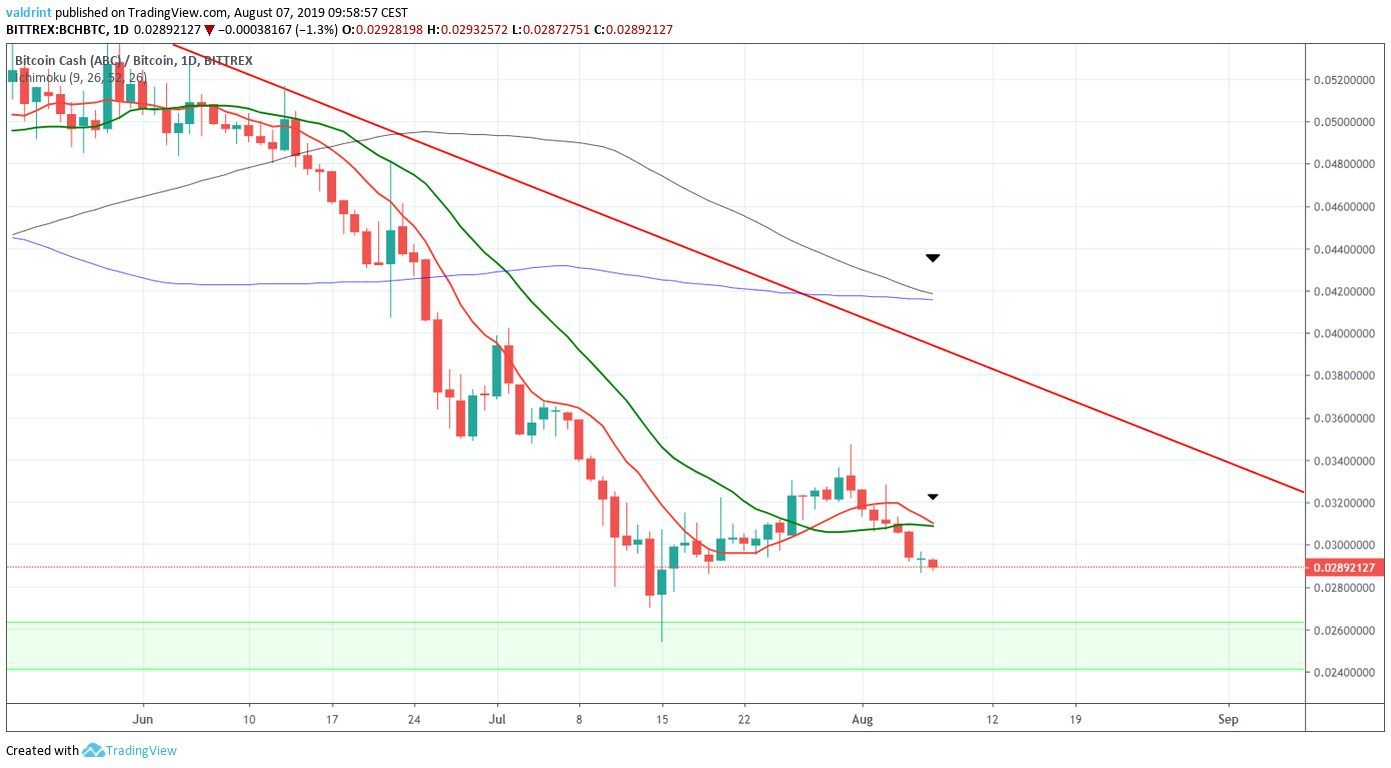
At the current time, there are two bearish crosses that are very close to transpiring:
- A long-term cross between the 100- and 200-period MAs
- A short-term cross between the 10- and 20-period MAs.
Both of them suggest that the Bitcoin Cash price is likely to continue decreasing until it reaches the support area.
However, the decrease will likely not follow a straight line.
Let’s go back to the short-term and see how that will play out.
Trade Bitcoin Cash, Ethereum, and other cryptocurrencies with a free account at our partner exchange, BitMEX.
Bitcoin Cash Price Possible Reversal
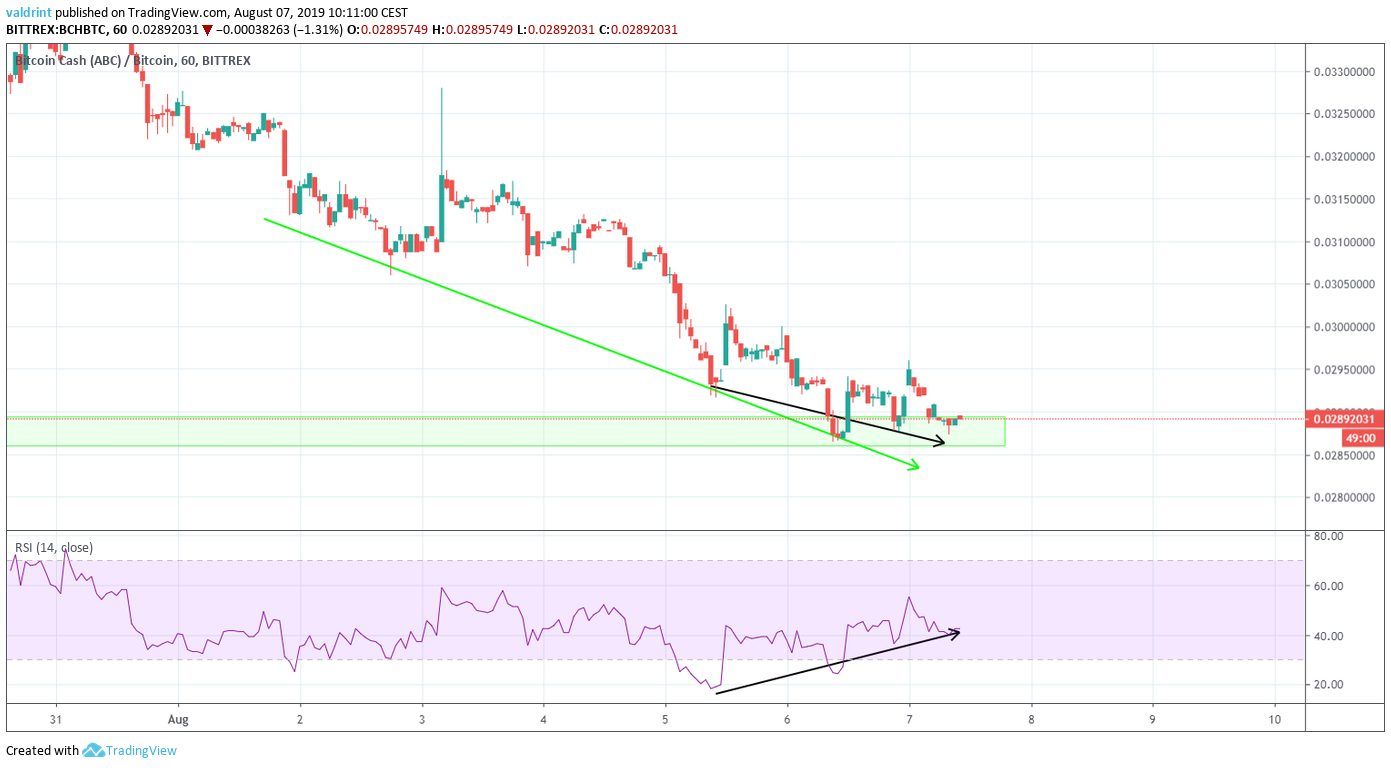
A look at the hourly time-frame shows that the Bitcoin Cash price is following a descending support line and has reached a minor support area.
Additionally, there is some bullish divergence developing in the RSI.
However, the divergence is only present in short-term time-frames since August 5.
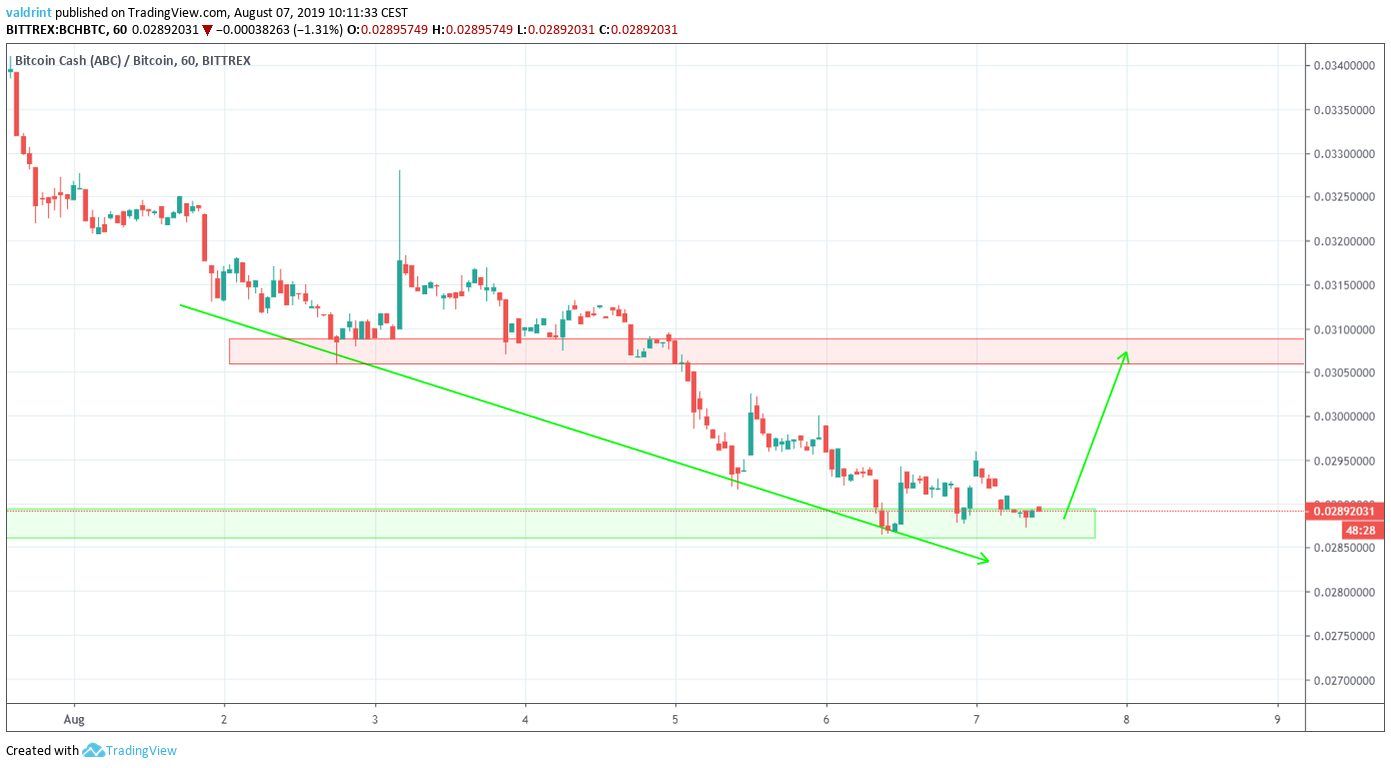
Therefore, we believe it is likely that the Bitcoin Cash price increases until it touches the resistance area before continuing its decrease in the support area.
Bitcoin Cash Price Summary
The BCH price recently broke down from a short-term ascending support line.
According to our analysis, it is likely to continue decreasing until it reaches the support area at ₿0.025.
Do you think that BCH will continue decreasing? Let us know in the comments below.
Disclaimer: This article is not trading advice and should not be construed as such. Always consult a trained financial professional before investing in cryptocurrencies, as the market is particularly volatile.
Images are courtesy of Shutterstock, TradingView.