Bitcoin Cash (BCH): Trends For May 24, 2019
- BCH/USD and BCH/EUR made a double top on May 20-21.
- It has possibly created an inverse head and shoulders pattern.
- It is trading inside a long-term ascending broadening wedge
- Bearish divergence is developing in the RSI and the MACD.
Triple Top?
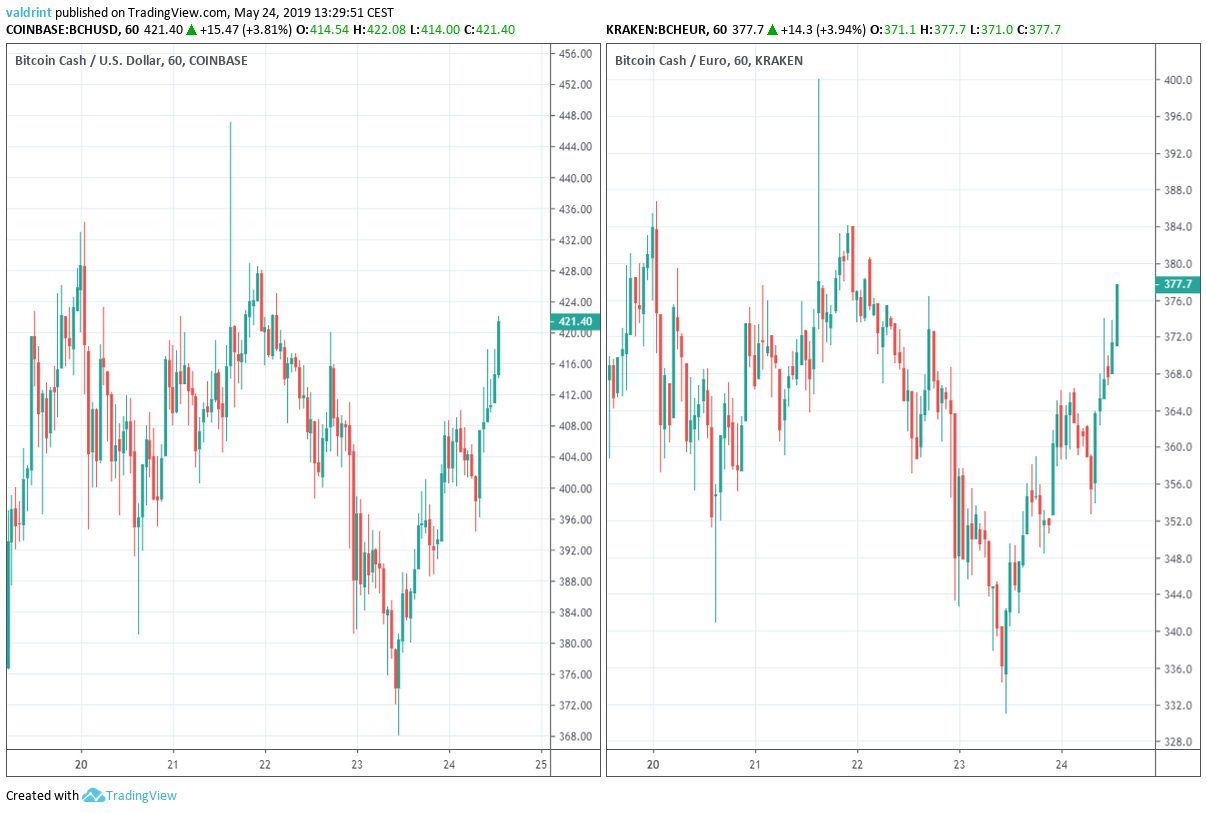
On May 20, Bitcoin Cash reached a high of $432.9. After a drop, similar levels were reached the next day. Another drop ensued.
Price movements are shown in the graph below:

The price is currently on its way to reaching these levels for the third time. This would effectively create a triple top, which is a bearish reversal pattern.
However, another hypothetical scenario is possible.Another Possibility
After reaching a high on May 20, the price dropped to create a low of $381.0. Similarly, the price dropped again after reaching a second high on May 21. However, this time the drop was sharper and the price reached a low of $368.03. These two lows could provide the left shoulder and the head of an inverse head and shoulders (H&S) pattern. This pattern would be completed by another drop towards the $381 area, which would create the right shoulder. In this scenario, the triple top level of $430 would serve as the neckline of the pattern. However, the inverse head and shoulders is a bullish pattern. Therefore, these patterns cannot occur at the same time.Which One Is It?
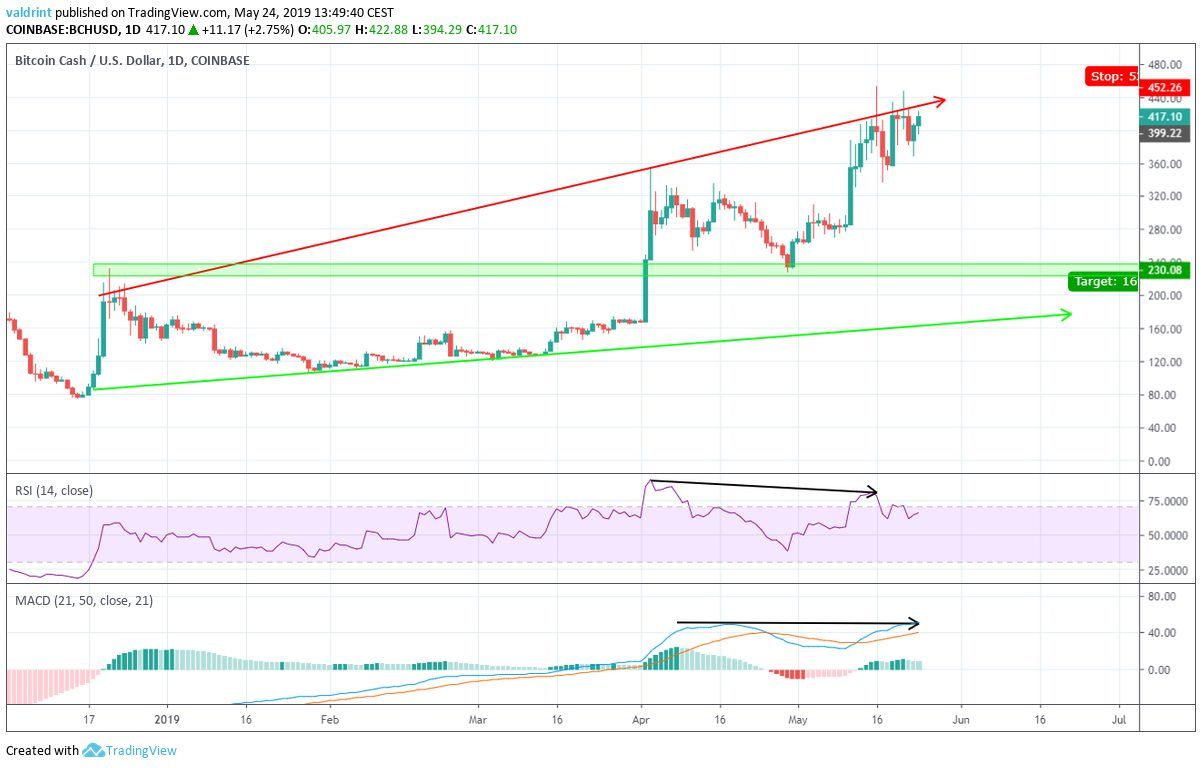
To determine whether its a triple top or head and shoulders pattern, the price of BCH is analyzed at daily intervals from Dec 2018 to May 2019 alongside the RSI and the MACD below to better
In yesterday’s analysis, we stated that :
Even though today we experienced short-term increases, this has not changed our outlook for BCH. The divergence is very significant in long-term timeframes, especially in the RSI, and these short-term increases do not sufficiently invalidate our hypothesis. Therefore, we believe that the triple top scenario succeeded by a breakdown is more likely than the inverse H&S succeeded by a breakout.Since Dec 2018, the price of BCH has been trading inside an ascending broadening wedge. The resistance line was touched during the highs of Apr 3 and May 16.
Similarly, the RSI and the MACD made highs on Apr 3. However, they have since decreased.
This bearish divergence suggests that the price of BCH will continue dropping toward the support line.
Assessment of Our Trade Setup For Bitcoin Cash (BCH)
Yesterday, we initiated a trade setup with
An average entry of $400 and €350. The stop-loss order is placed at $452.1 and €400.1, slightly above the May 16 highs. This is a stop loss of 13%. Our targets are set at $230 and €200 respectively.
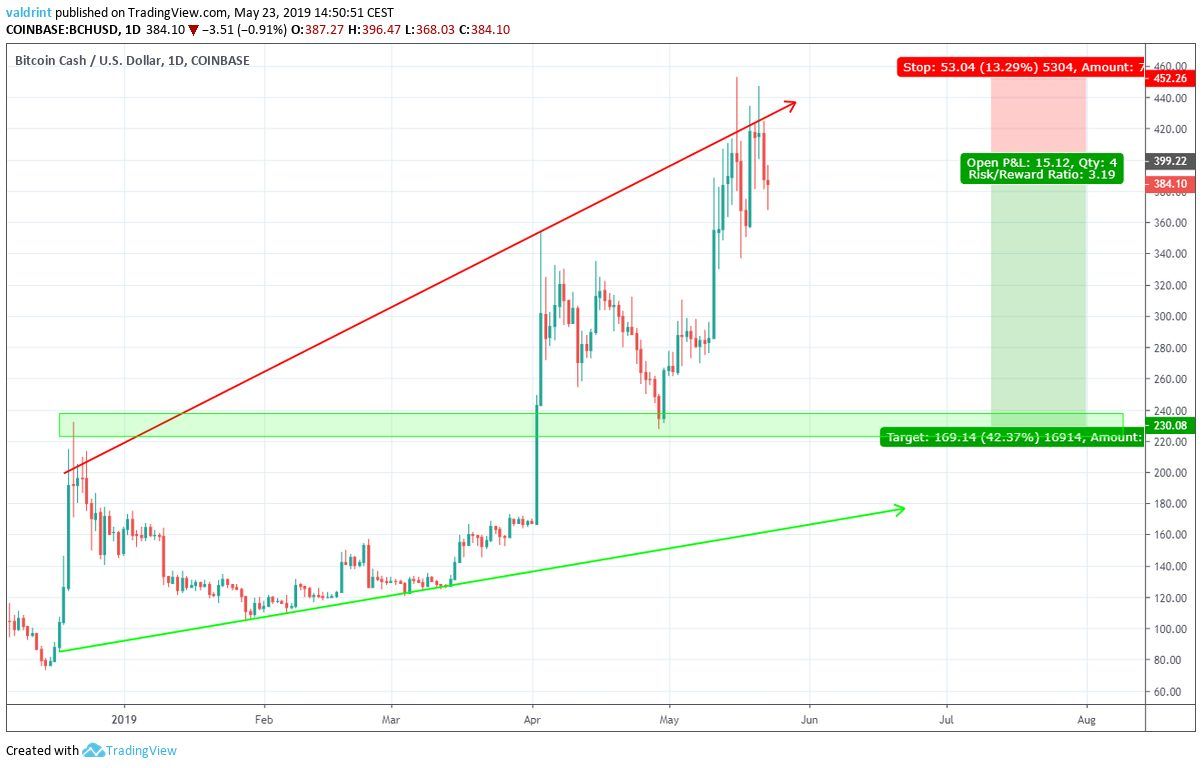
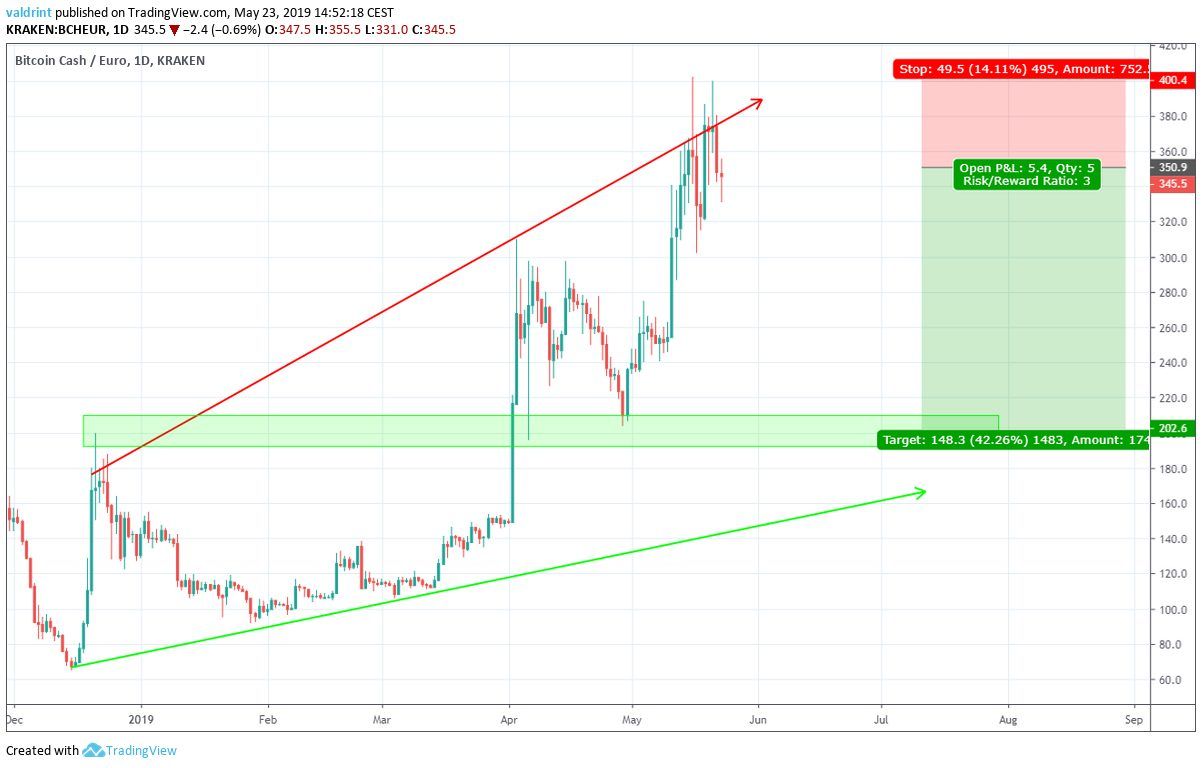 Today’s short-term increases brought the price slightly above our average entry levels. However, our stop loss is still significantly away.
If our triple top scenario is completed, the price will eventually reach our target price of $230 and €202. For those interested in initiating this trade setup, they may find the current promotion from XCOEX attractive.
Do you think Bitcoin Cash will create a triple top pattern? Let us know your thoughts in the comments below.
Disclaimer: This article is not trading advice and should not be construed as such. Always consult a trained financial professional before investing in cryptocurrencies, as the market is particularly volatile.
Disclaimer
In line with the Trust Project guidelines, this price analysis article is for informational purposes only and should not be considered financial or investment advice. BeInCrypto is committed to accurate, unbiased reporting, but market conditions are subject to change without notice. Always conduct your own research and consult with a professional before making any financial decisions. Please note that our Terms and Conditions, Privacy Policy, and Disclaimers have been updated.

