


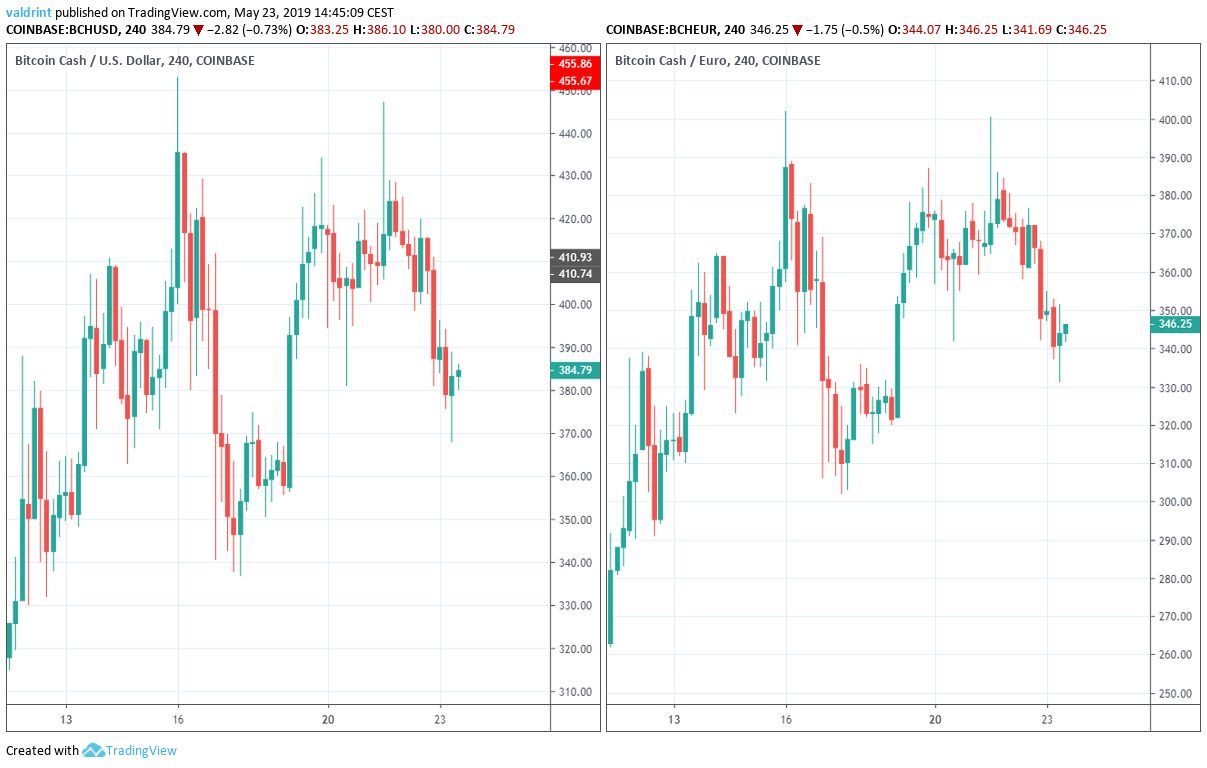
The price of Bitcoin Cash (BCH) reached a high of $452.91/€402 on May 16. Prices dropped and then rebounded. By May 20, BCH had reached highs just below those seen four days prior.
This appears to have created a double top pattern which indicates possible future losses. To validate this theory, however, a more thorough analysis is needed.
In this analysis, we look at trends, indicators, and price fluctuations to determine whether decreases are increases are likely. Then we define a possible short trade setup for BCH/USD and BCH/EUR.
Bitcoin Cash (BCH): Trends For May 23, 2019
- BCH/USD and BCH/EUR reached a high on May 16.
- It is trading inside a symmetrical triangle.
- It is trading inside a long-term ascending broadening wedge
- Bearish divergence is developing in the RSI and the MACD.
- There is support near $230 and €200.
Symmetrical Triangle
On May 12, Bitcoin Cash reached a high of $332.02 and generated an ascending support line. Combined with the descending resistance line created from May 16’s highs, a symmetrical triangle has developed.
Since May 16, BCH has been decreasing within this trading pattern:
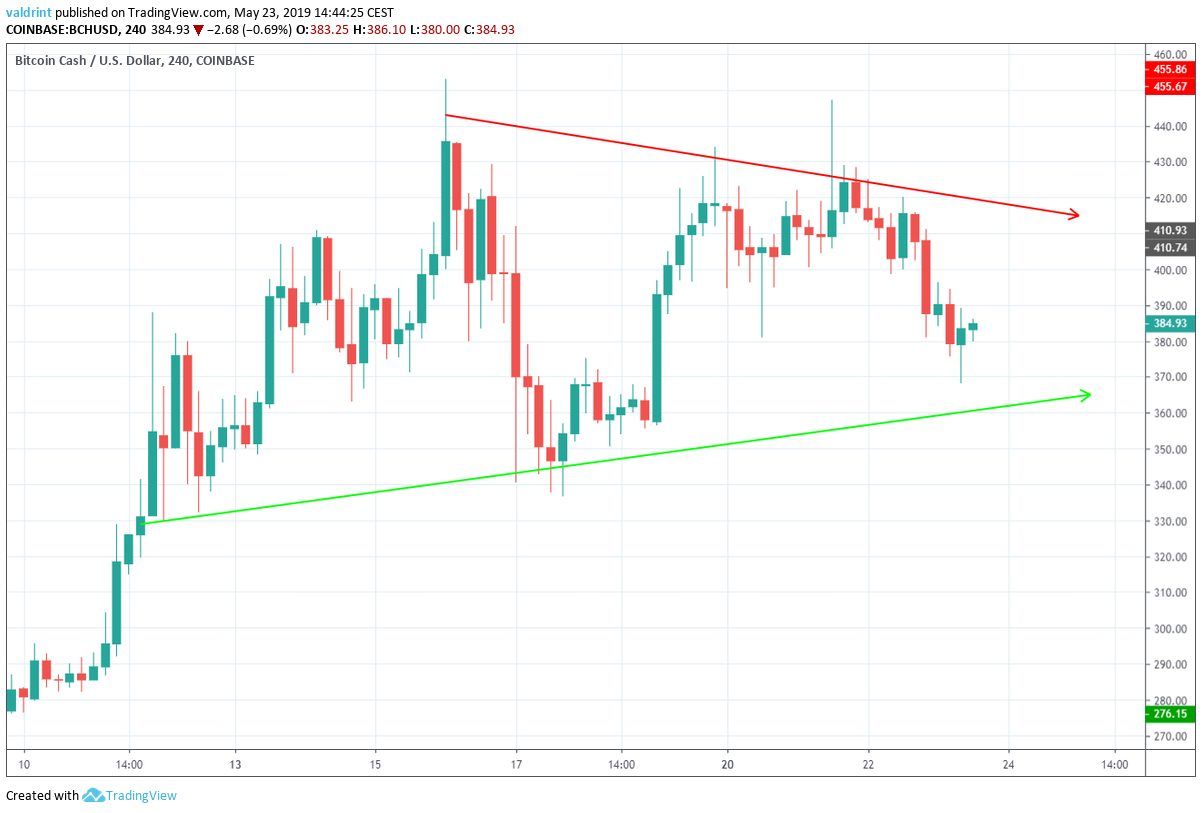
On May 20, the resistance line was reached. Price has since been dropping toward the support line. If it is reached, this will provide further validation of the trading pattern’s legitimacy.
BCH To Support?
To determine whether or not BCH will continue falling toward the support line or rebound toward the resistance, we analyze the price of BCH is analyzed at daily intervals from Dec 2018 to May 2019 alongside the RSI and the MACD below:
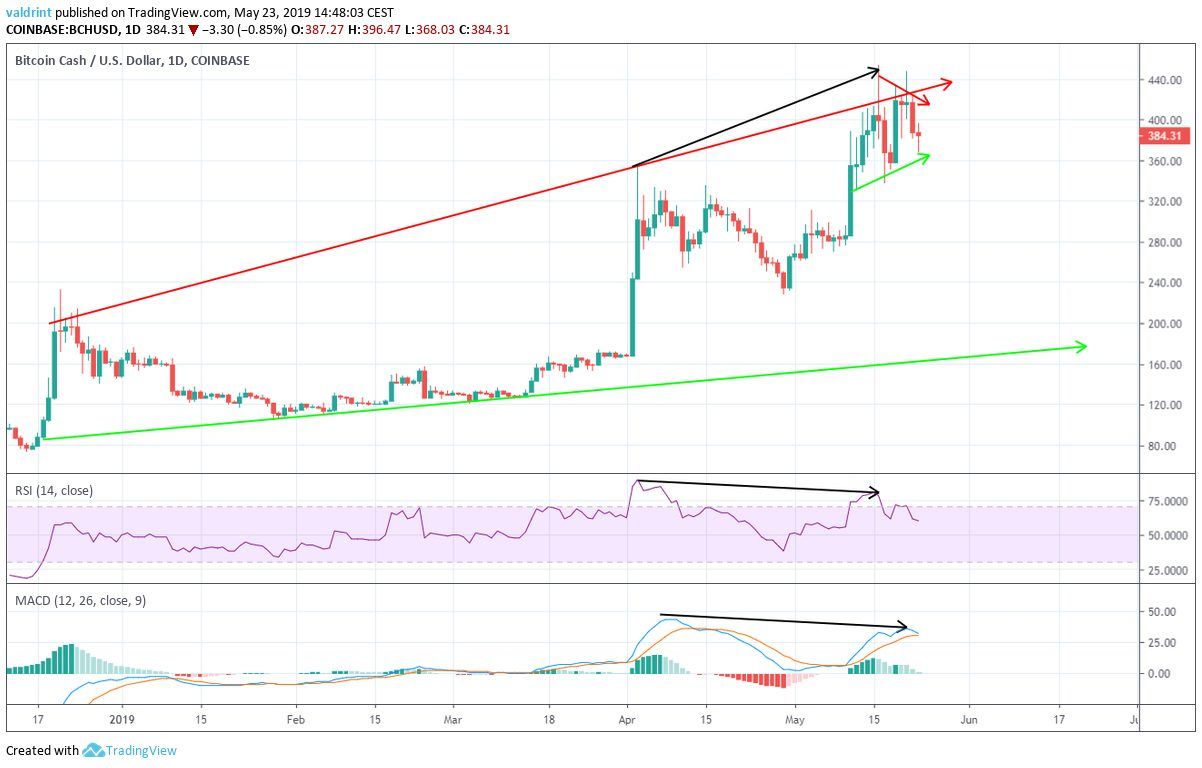
Since Dec 2018, the price of BCH has been trading inside an ascending broadening wedge. The resistance line was touched during the highs of Apr 3 and May 16.
Similarly, the RSI and the MACD made highs on Apr 3. However, they have since decreased.
This bearish divergence suggests that the price of BCH will continue dropping toward the support line of the short-term triangle. It also appears possible that the price could breakdown and fall toward the long-term support line.
However, it also remains possible that after reaching short-term support, BCH will rebound to validate the short-term or long-term resistance line. Validation of the long-term resistance line would require a breakout from the short-term trading pattern.

May 23 Trade Setup For Bitcoin Cash (BCH)
As a result of the position of the price relative to its pattern, we have isolated a potential short trade setup for BCH in both USD and EUR. The Risk/Reward Ratio and Stop Loss percentage are slightly different for the pairs. In order to avoid confusion, however, we have rounded up both values.
An average entry of $400 and €350 is defined. The stop-loss order is placed at $452.1 and €400.1, slightly above the May 16 highs. This is a stop loss of 13%.
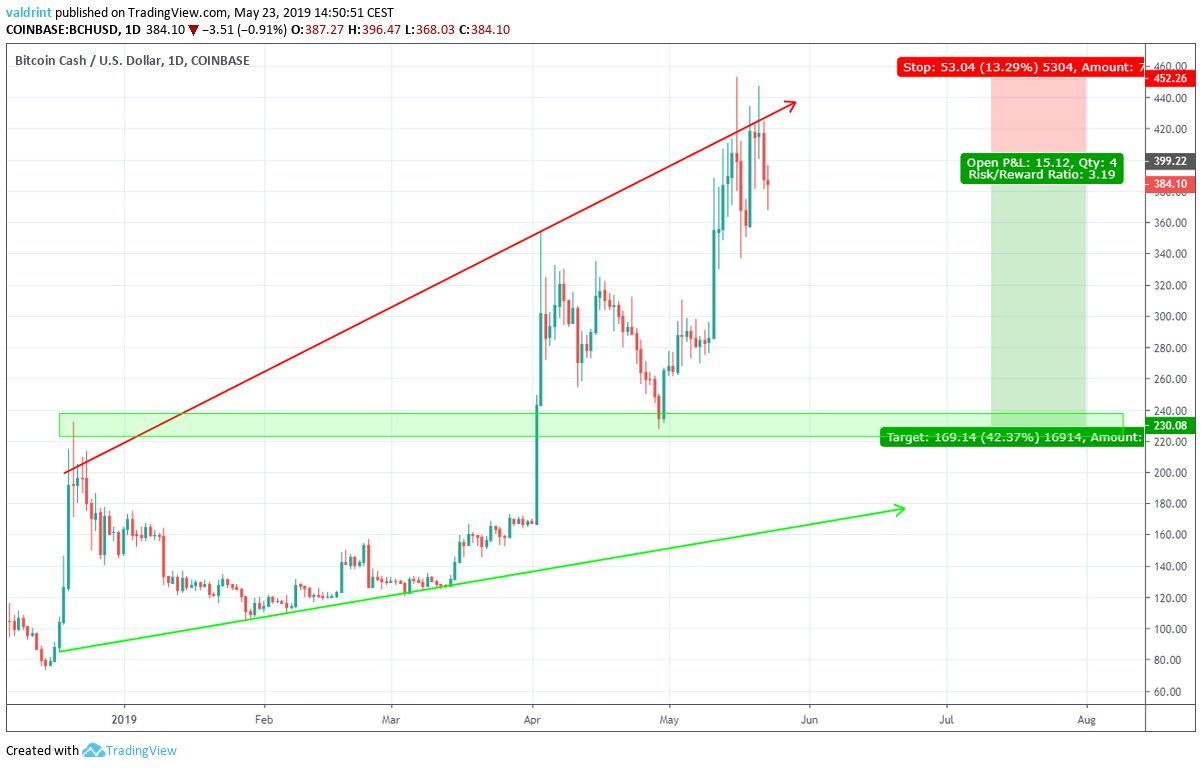
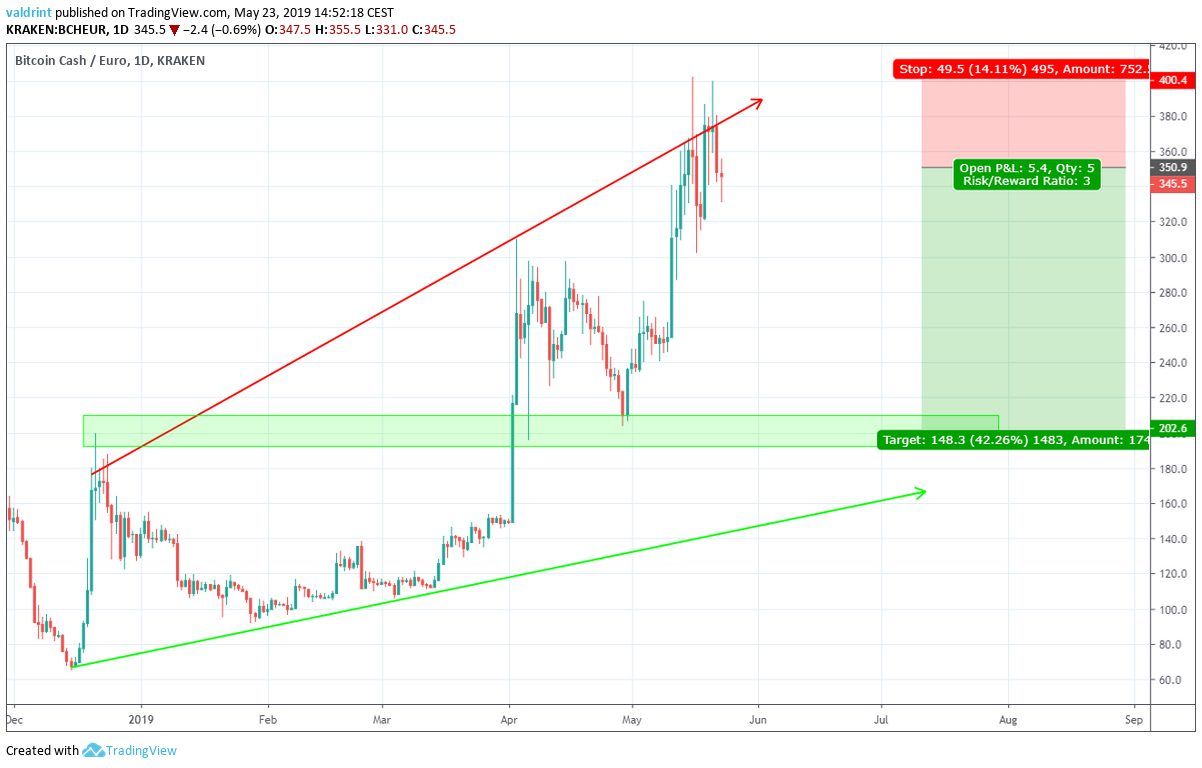
The target is found by identifying the closest support area.
Do you think Bitcoin Cash will drop to the support area? Let us know your thoughts in the comments below.
Disclaimer: This article is not trading advice and should not be construed as such. Always consult a trained financial professional before investing in cryptocurrencies, as the market is particularly volatile.


