

The Bitcoin Cash (BCH) price has been decreasing since reaching a high of ₿0.045 on Jan 18, taking the form of a symmetrical triangle.
Bitcoin Cash Highlights
- BCH has broken out from its trading range.
- A golden cross has transpired.
- The price is possibly trading inside a symmetrical triangle.
- There is resistance at ₿0.045 and ₿0.052.
$BCH
— Bagsy (@Bagsy) February 4, 2020
As long as we don't lose the range EQ as support, I'm thinking this moves up to tag the range high for another +32%.
Thank you to @TraderX0X0 for helping me determine the range on this one. pic.twitter.com/0mMtxzFCOM
BCH Previous Breakouts
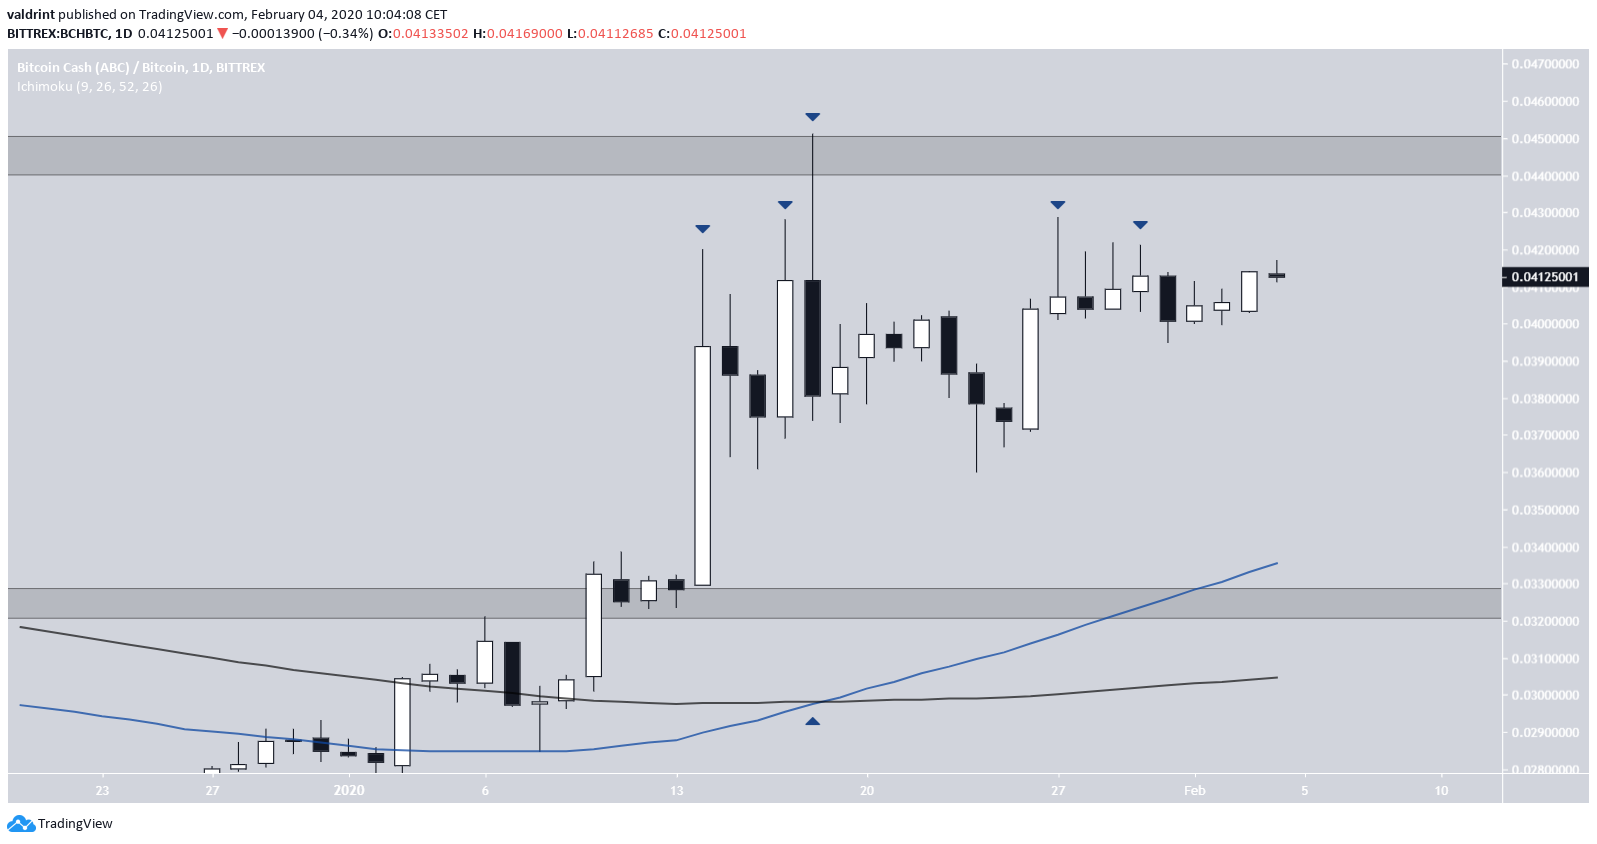
On Jan 14, 2020, the BCH price broke out from the trading range it has been consolidating in since July of 2019. The range had lower and upper limits of ₿0.026 and ₿0.0325 respectively. After the breakout, the price reached the next resistance area at ₿0.045 but failed to hold on, and instead created a long upper wick and decreasing afterward. After the breakout, a bullish cross between the 50 and 200-day moving averages (MA) transpired (golden cross). This is a sign that the price has likely begun a new bullish market cycle. However, the price is trading well above these MAs and has yet to validate them as support. Thus, it would not be surprising if the price returned to test the support, a customary movement after breakouts.
In addition, the BCH price has created several long upper wicks since the breakout, a sign of selling pressure that reaffirms the possibility that the price will correct to validate the MAs.
After the breakout, a bullish cross between the 50 and 200-day moving averages (MA) transpired (golden cross). This is a sign that the price has likely begun a new bullish market cycle. However, the price is trading well above these MAs and has yet to validate them as support. Thus, it would not be surprising if the price returned to test the support, a customary movement after breakouts.
In addition, the BCH price has created several long upper wicks since the breakout, a sign of selling pressure that reaffirms the possibility that the price will correct to validate the MAs.
Symmetrical Triangle
Since the Jan 18 high, the BCH price seems to be trading inside a symmetrical triangle. Currently, it is at the resistance line of this pattern. Similar to the daily chart, the movement near this line has been characterized by long upper wicks. If the price were to decrease to the support line, which is found at ₿0.038, it could serve to validate the aforementioned MAs.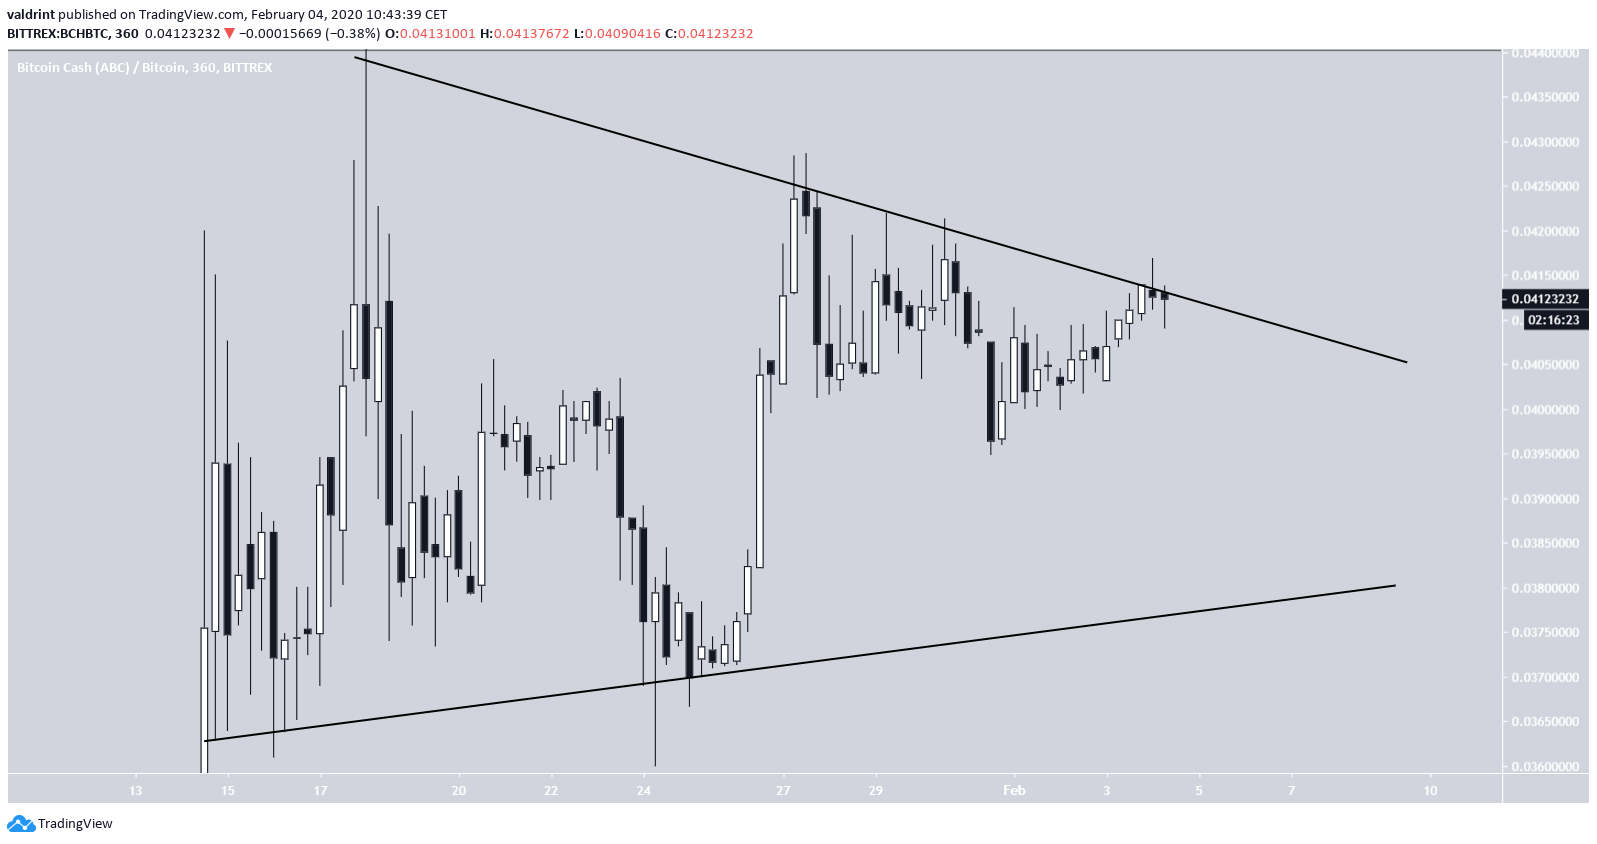
Future Movement
As for the future movement, it is likely that BCH will eventually break out from this symmetrical triangle. The daily RSI has been above 50 since Dec 25, a sign that it is in a bullish trend. Furthermore, the symmetrical triangle is a continuation pattern. Since it is following an upward move it is likely to break out. If it does, the price could reach the resistance area at ₿0.052, affirming the target given in the tweet.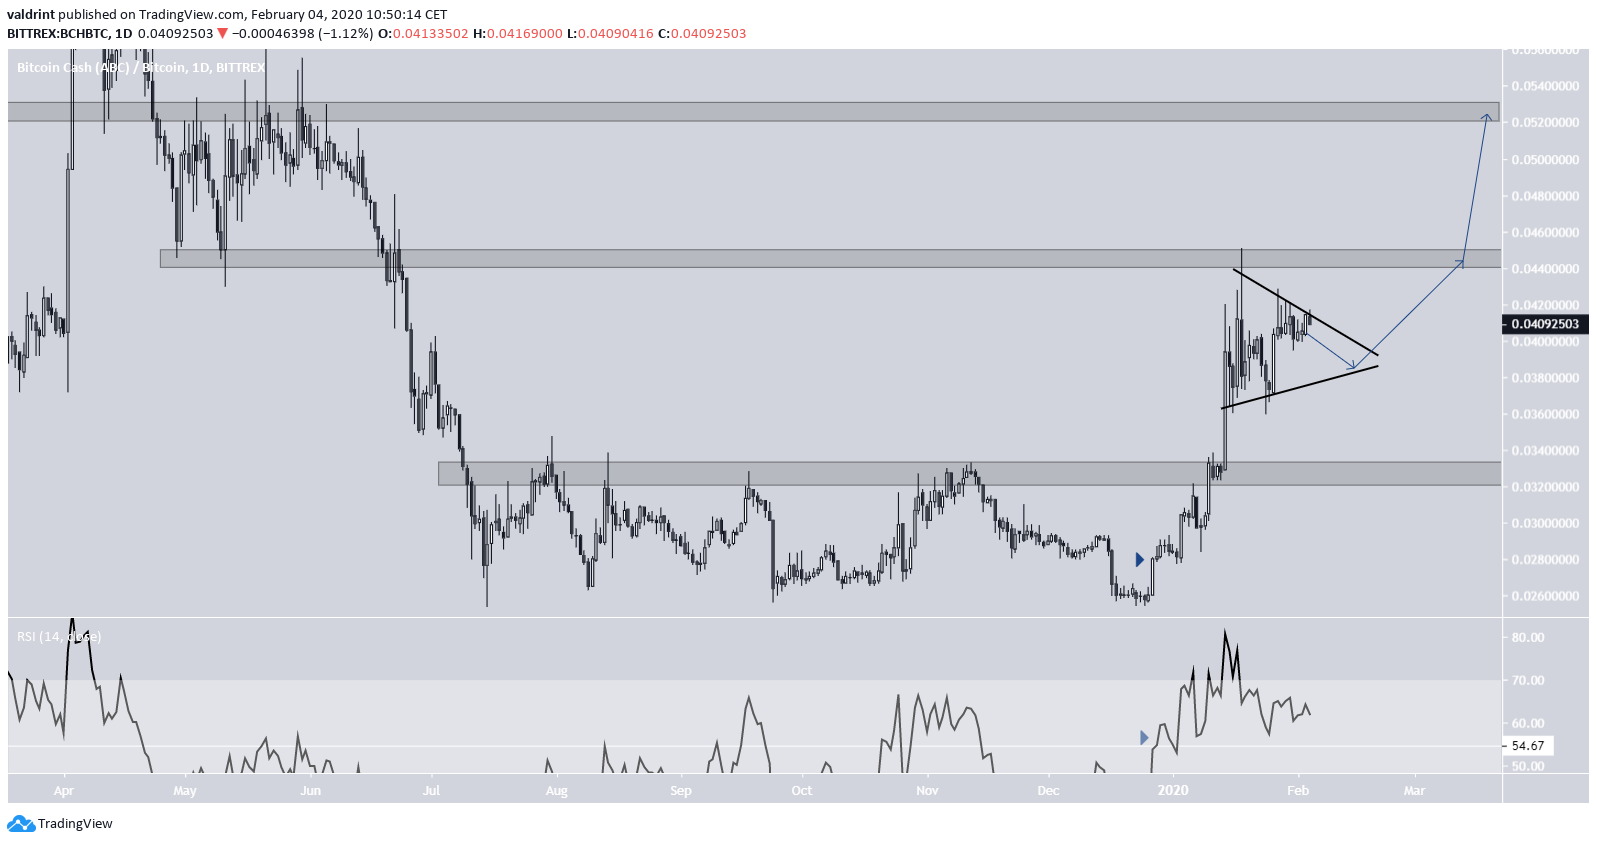 To conclude, the BCH price is trading inside a symmetrical triangle out of which it will likely break out. Prior to doing so, a correction back to the support line of the triangle is expected.
Top crypto platforms in the US
Disclaimer
In line with the Trust Project guidelines, this price analysis article is for informational purposes only and should not be considered financial or investment advice. BeInCrypto is committed to accurate, unbiased reporting, but market conditions are subject to change without notice. Always conduct your own research and consult with a professional before making any financial decisions. Please note that our Terms and Conditions, Privacy Policy, and Disclaimers have been updated.

Valdrin Tahiri
Valdrin discovered cryptocurrencies while he was getting his MSc in Financial Markets from the Barcelona School of Economics. Shortly after graduating, he began writing for several different cryptocurrency related websites as a freelancer before eventually taking on the role of BeInCrypto's Senior Analyst.
(I do not have a discord and will not contact you first there. Beware of scammers)
READ FULL BIO
Sponsored
Sponsored