


On January 14, the Bitcoin Cash (BCH) price broke out above the resistance area of the range it had been consolidating in since July 2019.
The price created a massive bullish engulfing candle, at a point having increased by 28% throughout the day. Currently, it has created a short-term continuation pattern, a breakout from which could take it to ₿0.044.
Full-time cryptocurrency trader @CryptoMichNL outlined a BCH price chart, stating that the price has reached his first target. In addition, he suggested that a retest of ₿0.0331 would provide a good opportunity to re-enter the trade.
First target reached on this one.
Retrace and retest of 0.0331 would be a good long entry. pic.twitter.com/n6DaoM0UXp
— Michaël van de Poppe (@CryptoMichNL) January 14, 2020
Will the BCH price retrace to the target? If so, where will it go afterward? Keep reading below if you are interested in finding out.
BCH Range Breakout
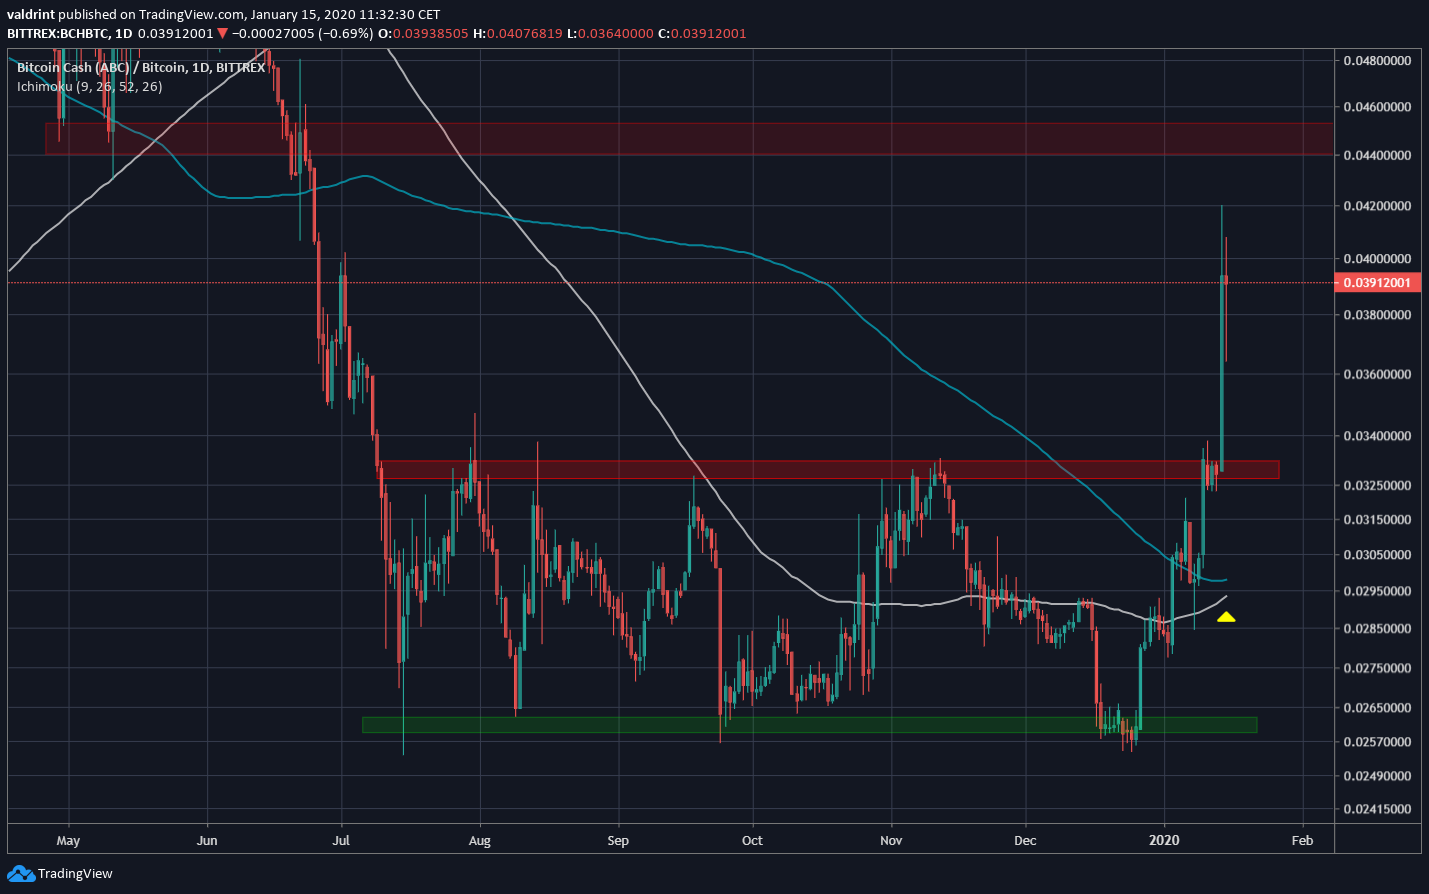
The BCH price had been trading in a range between ₿0.026 and ₿0.033 since July 2019. The retest outlined in the tweet would be a retest of this same resistance area.
On January 14, the BCH price broke out amidst a massive bullish engulfing candlestick that reached a high of ₿0.042. To further confirm this breakout, the 100- and 200-day moving averages (MA) are very close to making a bullish cross, confirming that the price is in an upward trend.
The closest resistance area is found at ₿0.044.
Continuation Movement
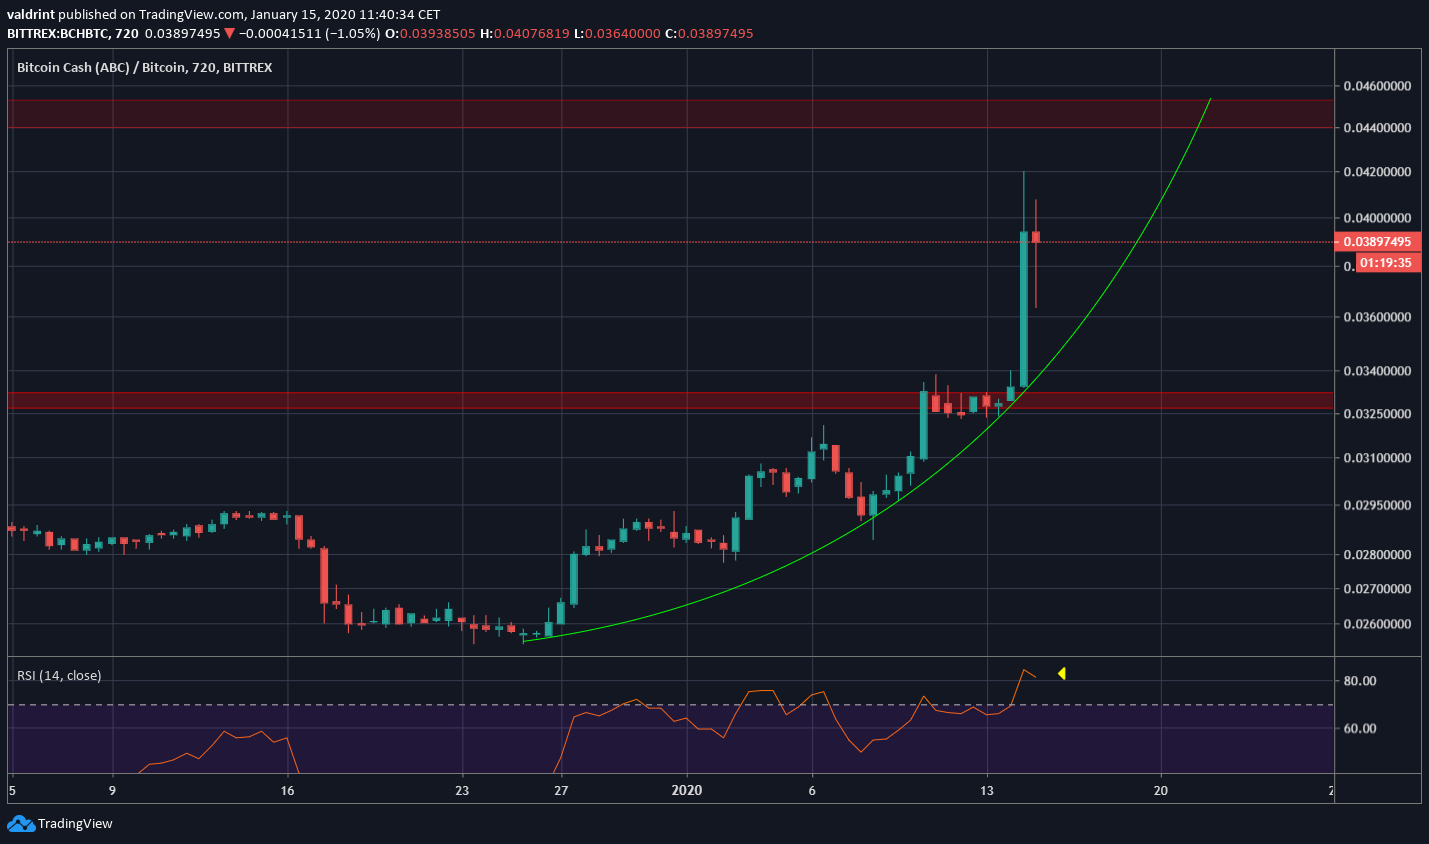
The BCH price movement since December 27, 2019, has become parabolic, especially after the breakout above the resistance area. This is a type of movement seen recently in numerous altcoins. If the price continues to follow this support line, it will reach the aforementioned resistance area by January 20 at the latest.
In addition, while the RSI is overbought, there is no bearish divergence yet to warn that a reversal is near.
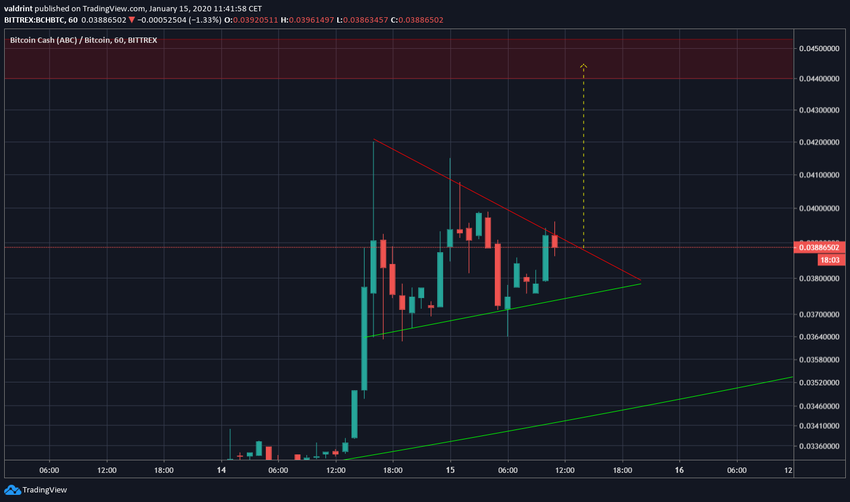
Looking at the short-term movement, we can see that the BCH price has created a symmetrical triangle, which is a continuation pattern. Coming after an upward move, a breakout would be expected. If the price travels the entire height of the pattern, it will reach the resistance area at ₿0.044.
To conclude, the BCH price broke out from its range and has created a short-term continuation pattern. A breakout above this pattern would take the price to the next resistance area at ₿0.044. We believe this is likely. Conversely, due to the strength of the breakout and the creation of a continuation pattern, we do not believe the price will retest the breakout level at ₿0.033, at least not in the near future.
