
The Bitcoin Cash (BCH) price is approaching a long-term descending resistance line that has been in place since 2018.
While a short-term decrease could occur, Bitcoin Cash is expected to eventually be successful in breaking out above this resistance line.
Long-Term Bitcoin Cash Resistance
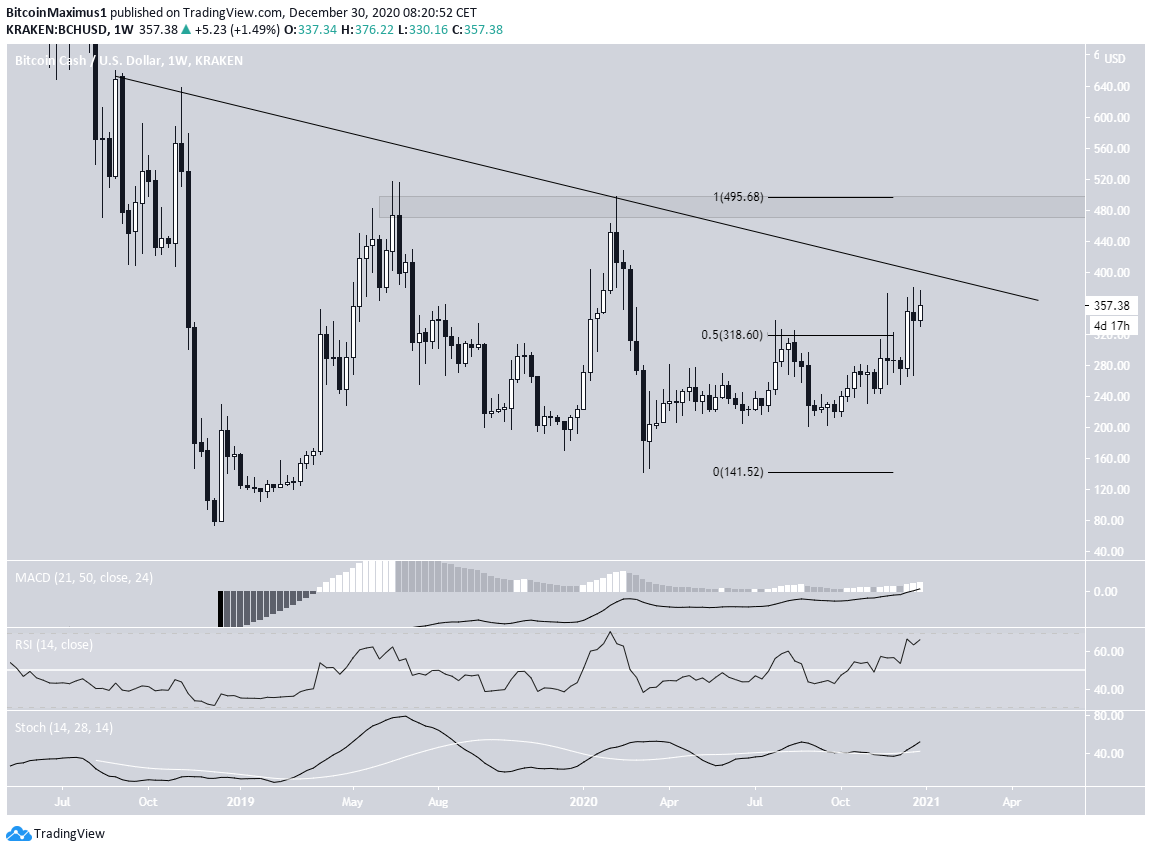
The weekly chart shows that BCH has moved above the previous resistance area at $318, created by the 0.5 Fib retracement level of the most recent decrease
It is now approaching a long-term descending resistance line that has been in place since August 2018. If successful in breaking out, the next resistance area would be found at $480.
Technical indicators are bullish, supporting the possibility that BCH will reach the descending resistance line and eventually break out.
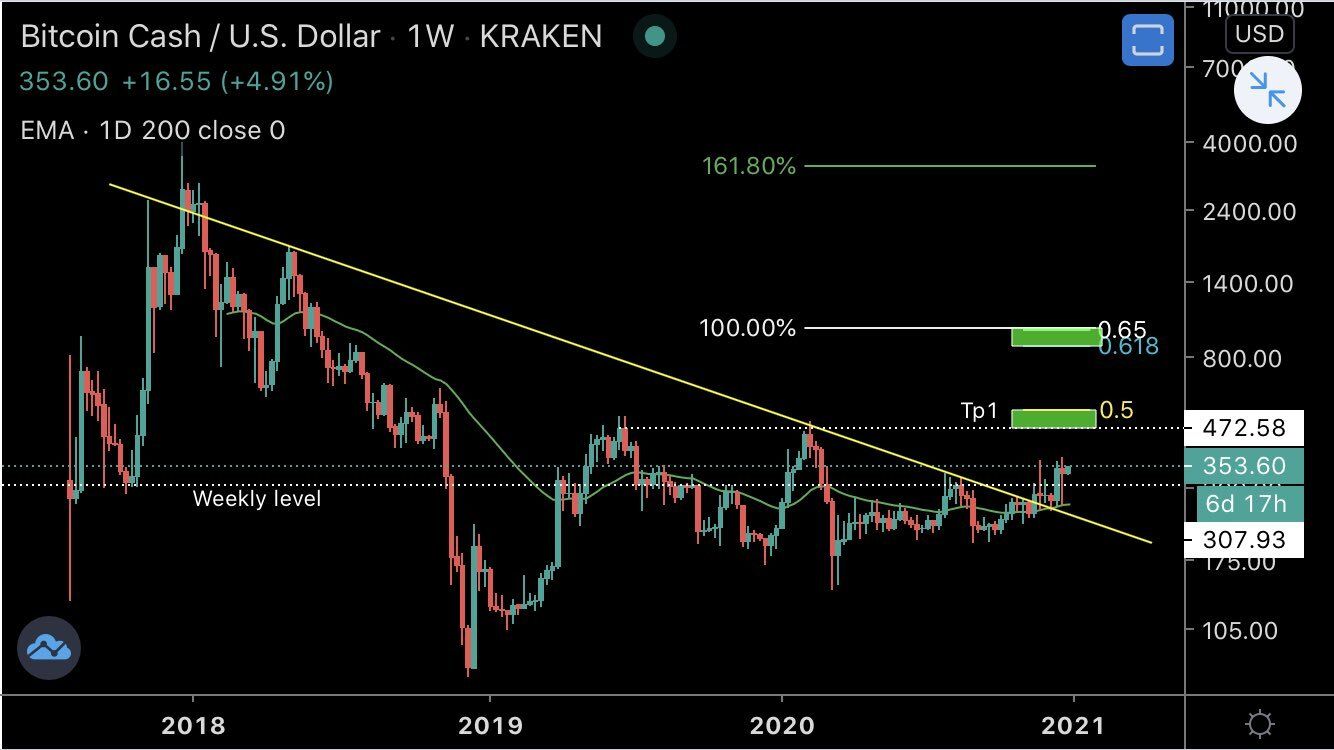
Cryptocurrency trader @mesawine1 stated that the BCH price has broken out from a long-term descending resistance line and is likely to increase all the way to $480.
However, as we saw above, BCH has likely still not broken out from this line.
Sign Of Weakness
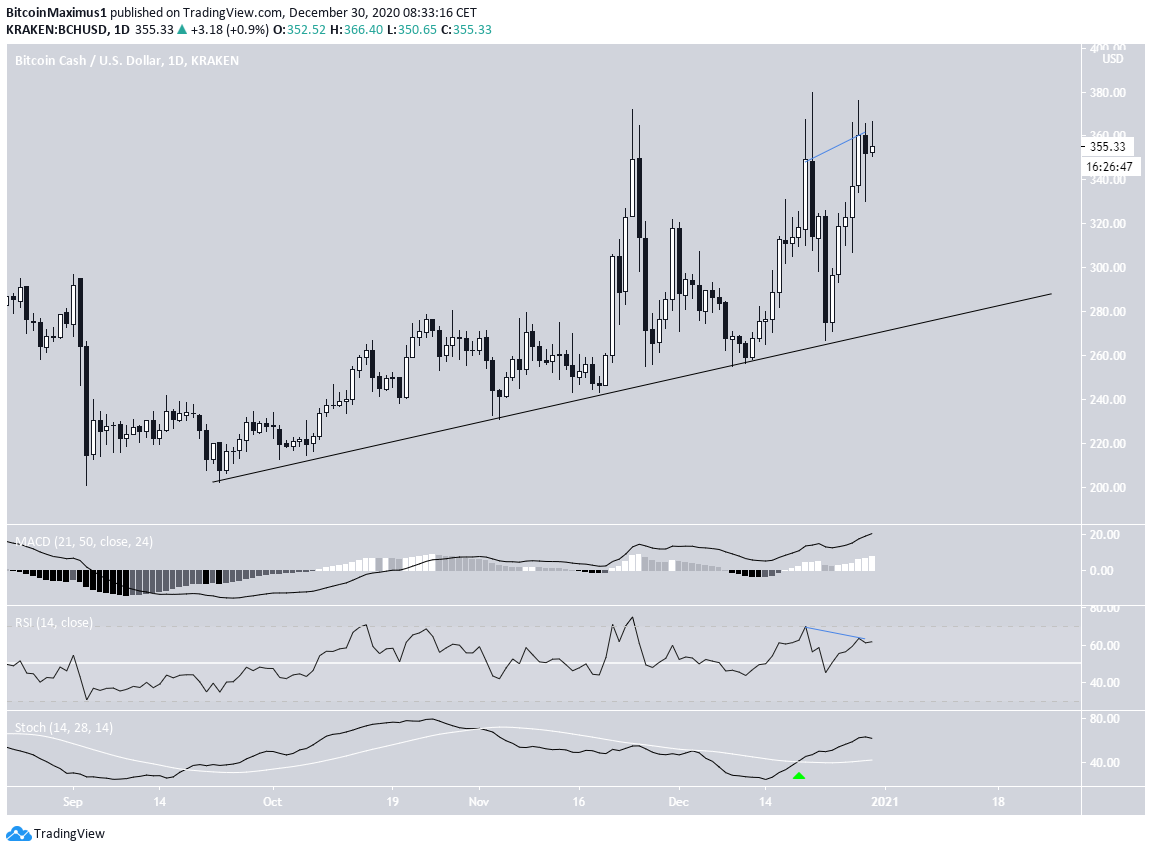
The daily chart shows that BCH is following an ascending support line, currently found near $290. While this is a bullish development, BCH is trading considerably above this line, so would still mark a significant decrease.
Furthermore, BCH has created what appears to be a triple top pattern, which is combined with long upper wicks and a bearish divergence in the RSI.
However, the MACD and Stochastic oscillator are both still bullish.
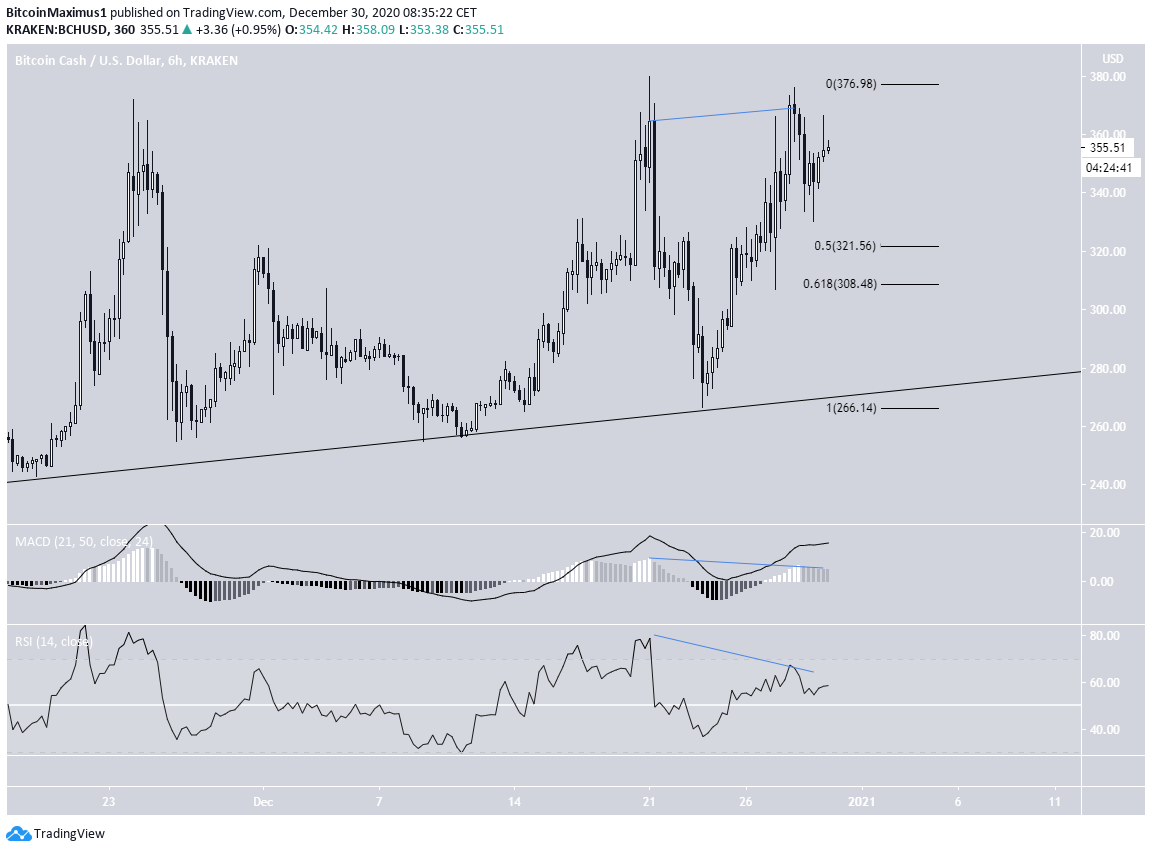
A similar outlook is given by the six-hour chart, which shows an even more pronounced bearish divergence in the RSI and MACD.
Therefore, BCH could decrease in the short-term, possibly reaching a low near $308-$321 (0.5-0.618 Fib retracement levels) before resuming its upward movement and breaking out from the long-term resistance line.
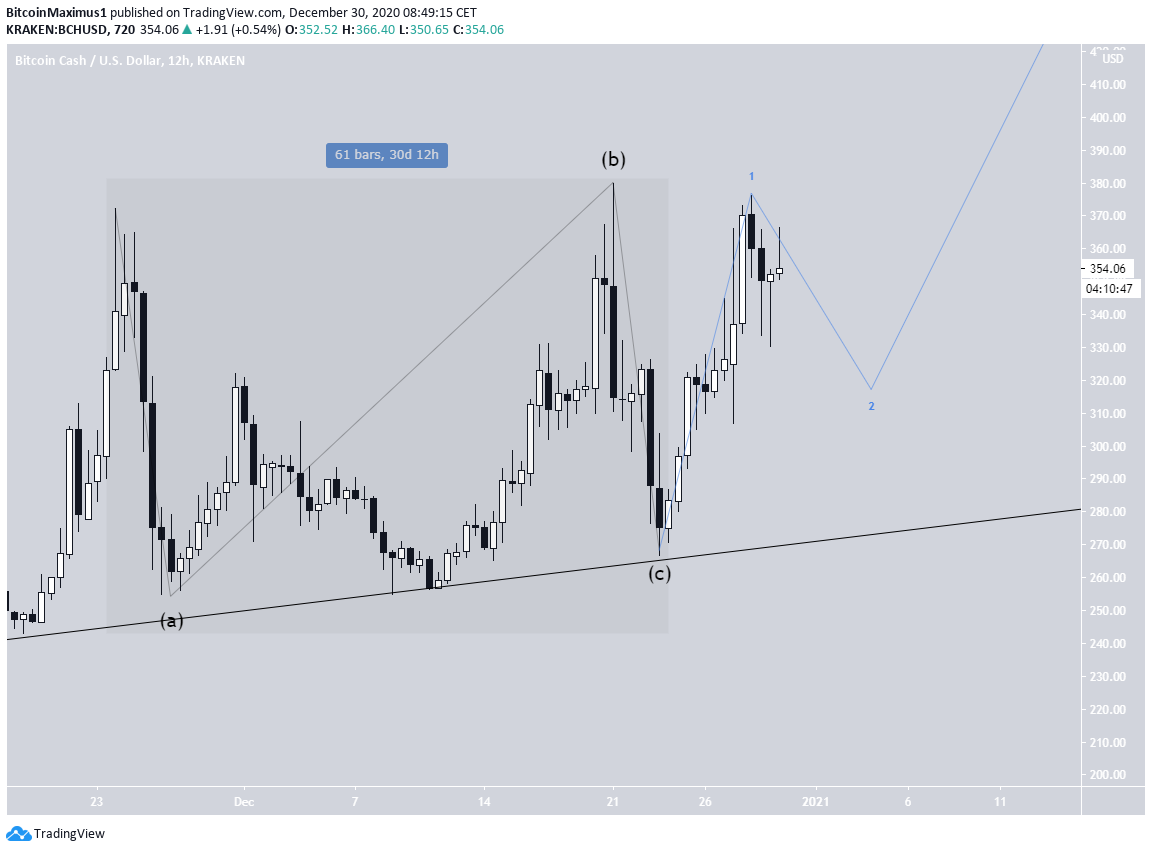
BCH Wave Count
While the complete wave count is not entirely confirmed, the movement throughout November and December (highlighted) resembles a running flat A-B-C corrective structure.
If correct, it would mean that BCH has already begun a bullish impulse.
This would fit with the outline provided in the previous sections, in which BCH decreases in the short-term before breaking out.
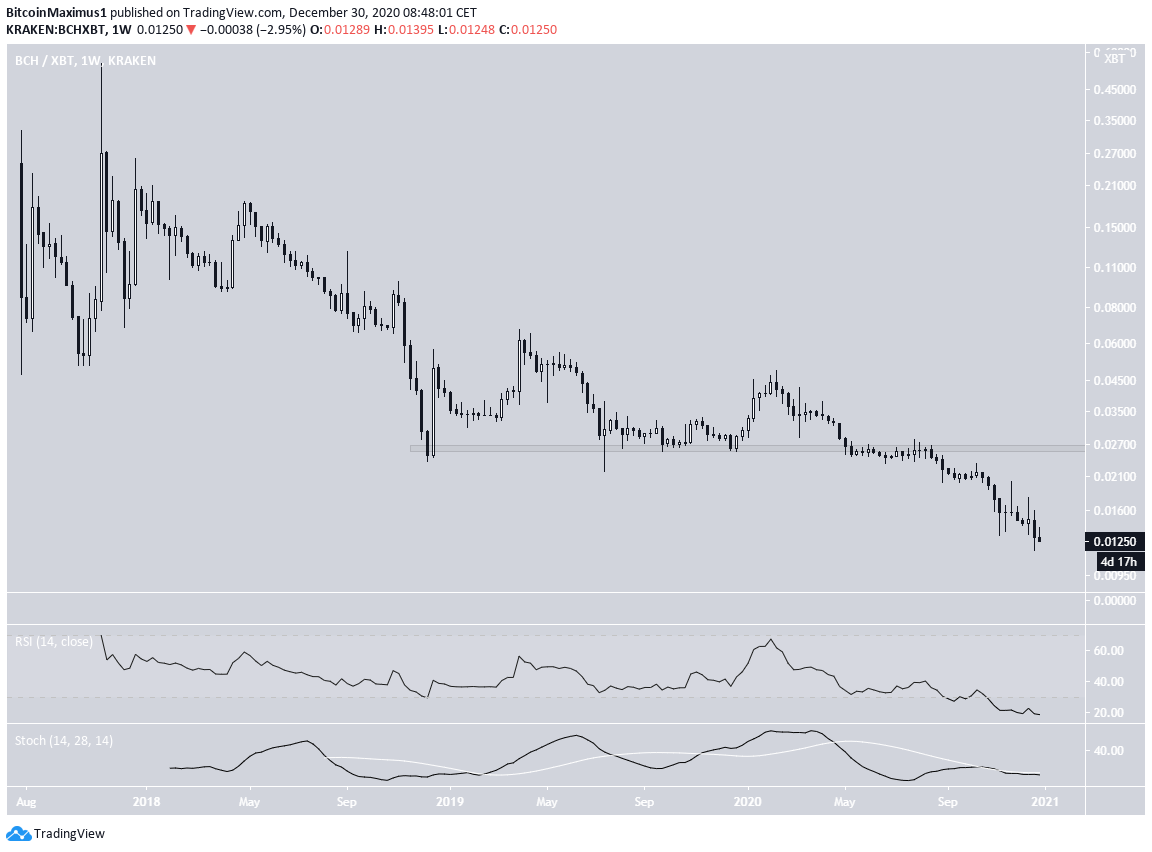
BCH/BTC
The BCH/BTC chart does not look bullish at all. BCH broke down from the ₿0.027 support area in August and has been moving downwards at an accelerated rate since.
BCH/BTC is now in bearish price discovery, and there are no bullish reversal signs to suggest that the trend will flip anytime soon.
Conclusion
While the long-term trend for BCH/USD is likely bullish, a breakout from the descending resistance line is required to confirm this. A short-term decrease back to support could occur prior to the breakout.
BCH/BTC is in bearish price discovery and is showing no signs of a bullish reversal.
For BeInCrypto’s latest Bitcoin (BTC) analysis, click here!
Disclaimer: Cryptocurrency trading carries a high level of risk and may not be suitable for all investors. The views expressed in this article do not reflect those of BeInCrypto.
