

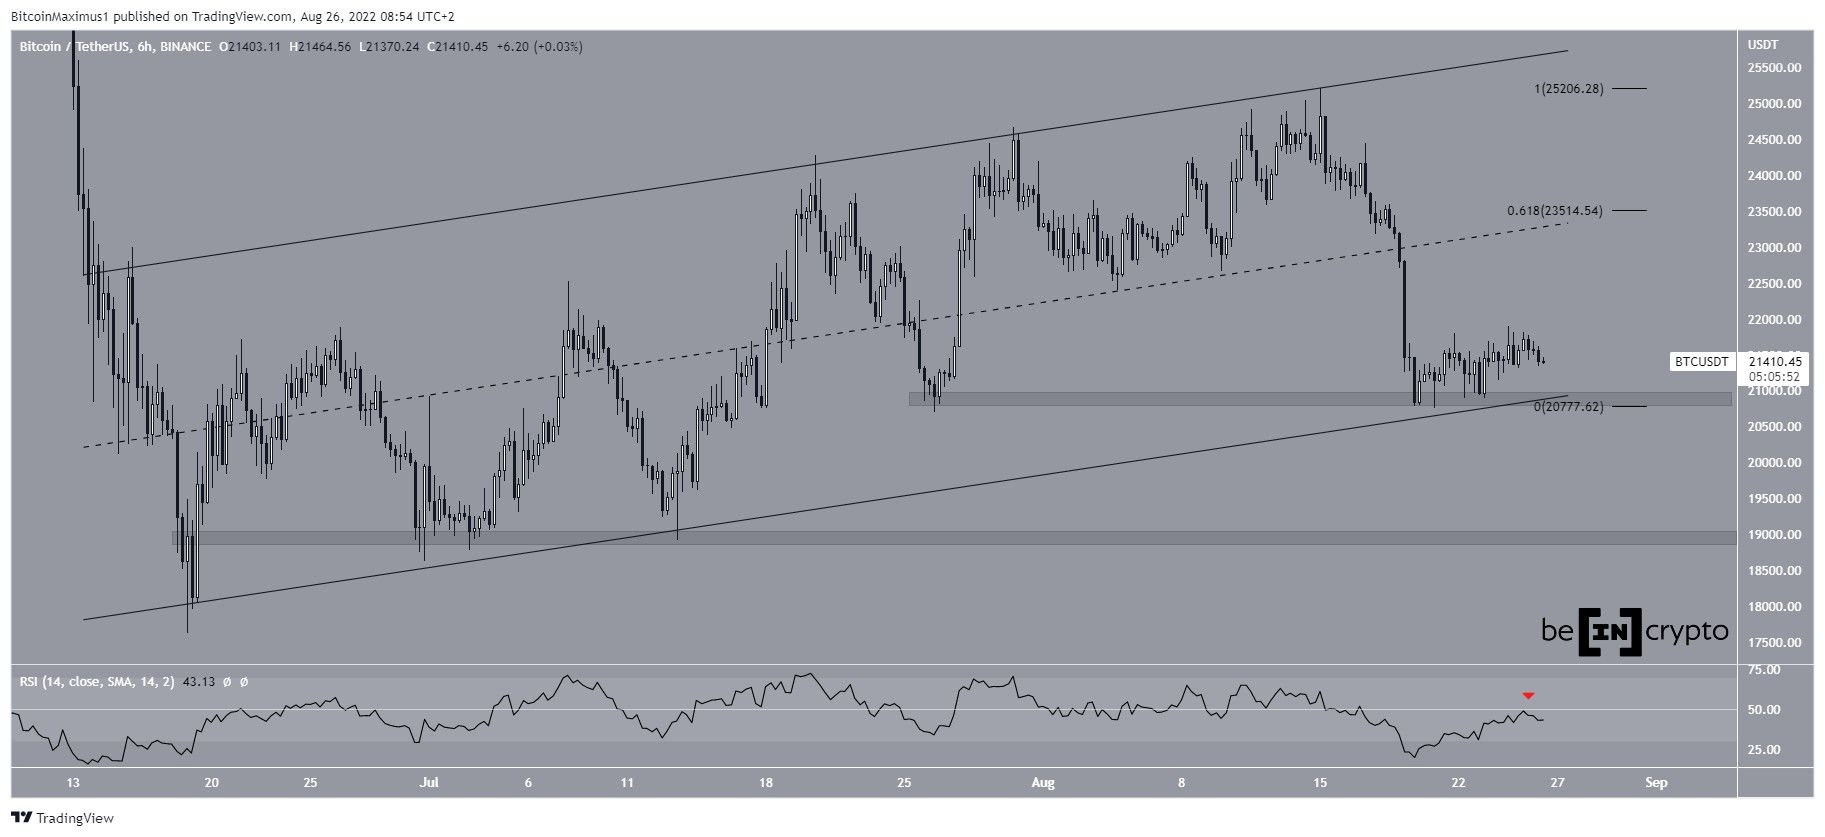
Bitcoin (BTC) is barely holding on to the lower portion of a corrective pattern and a minor horizontal support area. A breakdown below them could be the catalyst for a sharp downward move.
Bitcoin has been increasing inside an ascending parallel channel since June 18. The movement inside the channel led to a local high of $25,211 on Aug. 15 but the prices could not be sustained,
On Aug. 20, Bitcoin rebounded from the $20,900 horizontal support area and the support line of the channel and has been mostly increasing since then.
RSI faces resistance
Despite the bounce, BTC is still trading in the lower half of the channel. Moreover, the six-hour RSI was rejected by the 50-line (red icon) and has begun to move down.
When combining these with the fact that channels usually contain corrective movements, it is more likely that the increase is corrective and Bitcoin will eventually break down.
If the price decreases below the $20,900 area and the support line of the channel, it could continue to drop all the way back to $19,000 and potentially even lower.
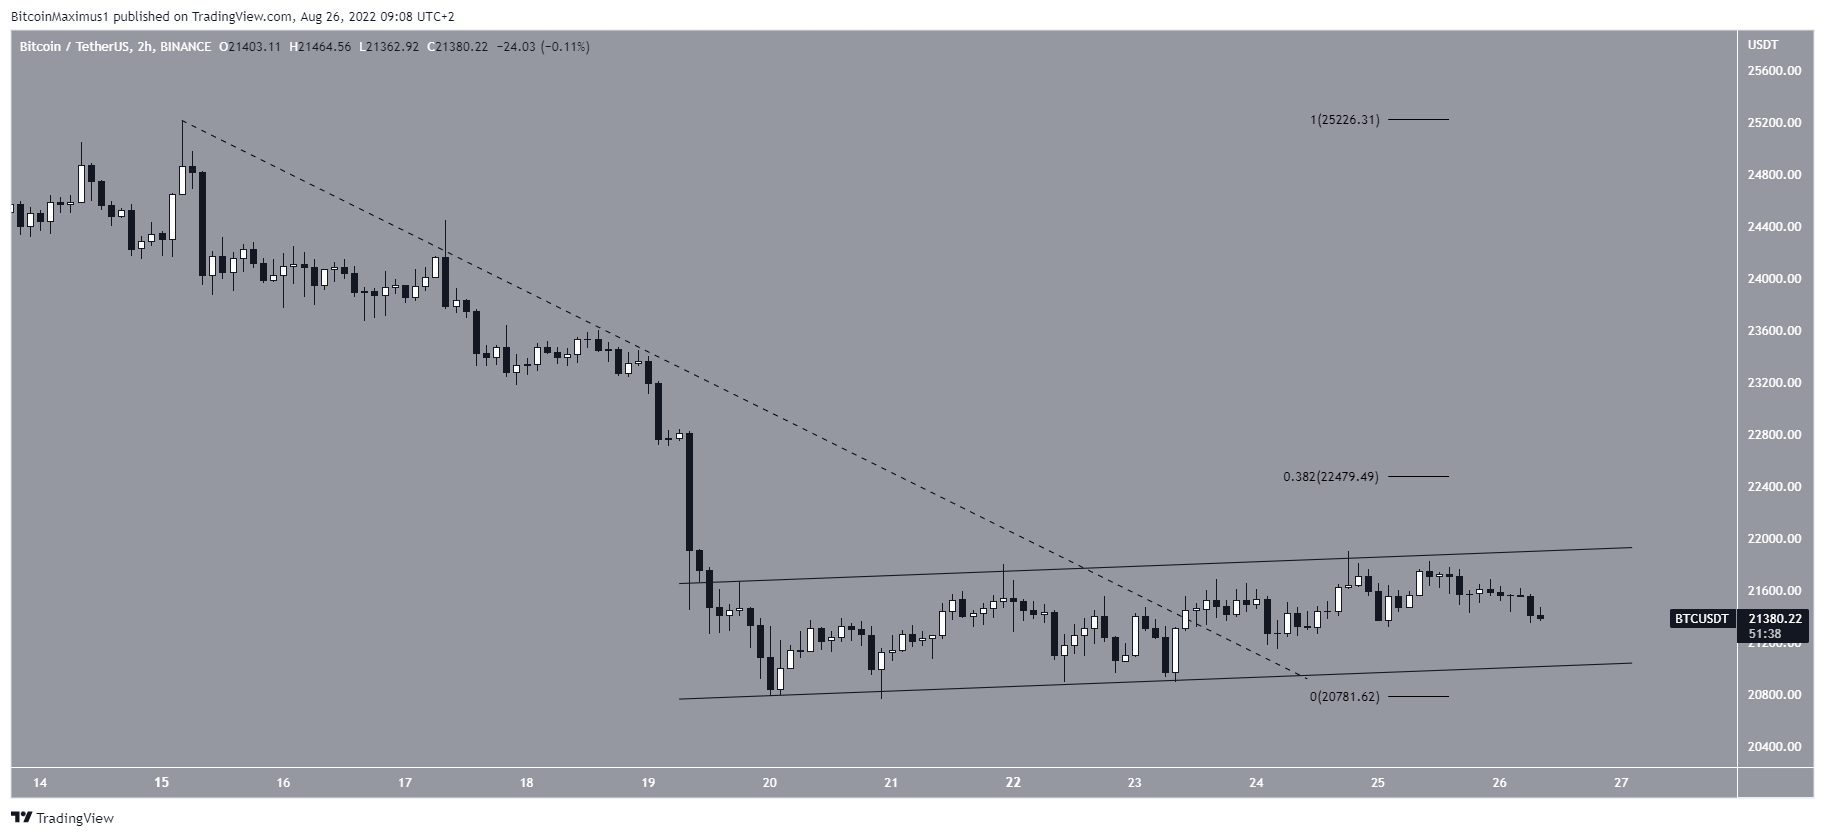
Short-term BTC movement
The two-hour chart shows that BTC has broken out from a descending resistance line (dashed). However, it failed to sustain the upward movement and has not even been able to reach the 0.382 Fib retracement resistance level. This is considered a sign of weakness since the breakout failed to lead to any significant upward movement.
Moreover, the entire trend that led to the breakout has been contained inside an ascending parallel channel. As outlined previously, such channels usually contain corrective movements.
A breakdown from the short-term channel would likely cause the price to plummet back under the long-term descending resistance under $19,000.
For Be[in]Crypto’s latest Bitcoin (BTC) analysis, click here
Disclaimer
In line with the Trust Project guidelines, this price analysis article is for informational purposes only and should not be considered financial or investment advice. BeInCrypto is committed to accurate, unbiased reporting, but market conditions are subject to change without notice. Always conduct your own research and consult with a professional before making any financial decisions. Please note that our Terms and Conditions, Privacy Policy, and Disclaimers have been updated.
