


Bitcoin (BTC) has been decreasing since reaching a high of $60,200 on April 2.
Bitcoin is expected to find a short-term bottom soon and resume its upward movement.
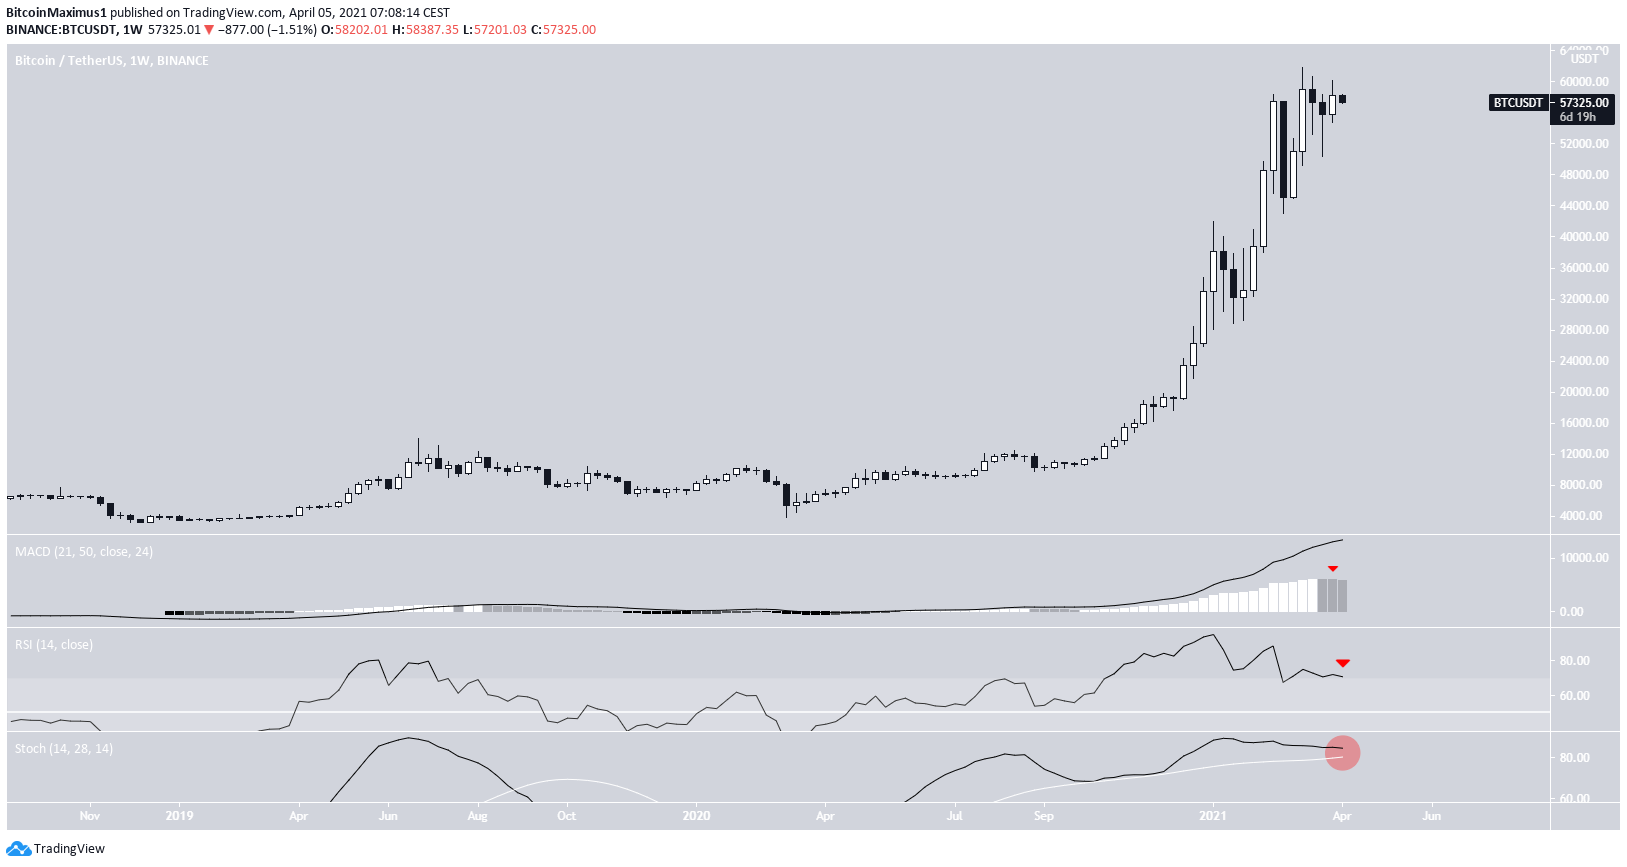
Weekly BTC Close
After creating a hanging man candlestick the week prior, BTC created a small bullish candlestick this week.
Technical indicators are showing weakness. The MACD has created a lower momentum bar and the RSI is decreasing, nearly crossing below 70. The Stochastic oscillator is decreasing, but has yet to make a bearish cross.
Therefore, while these signals do not confirm a top, they are strong signs that the bullish trend might soon come to an end.
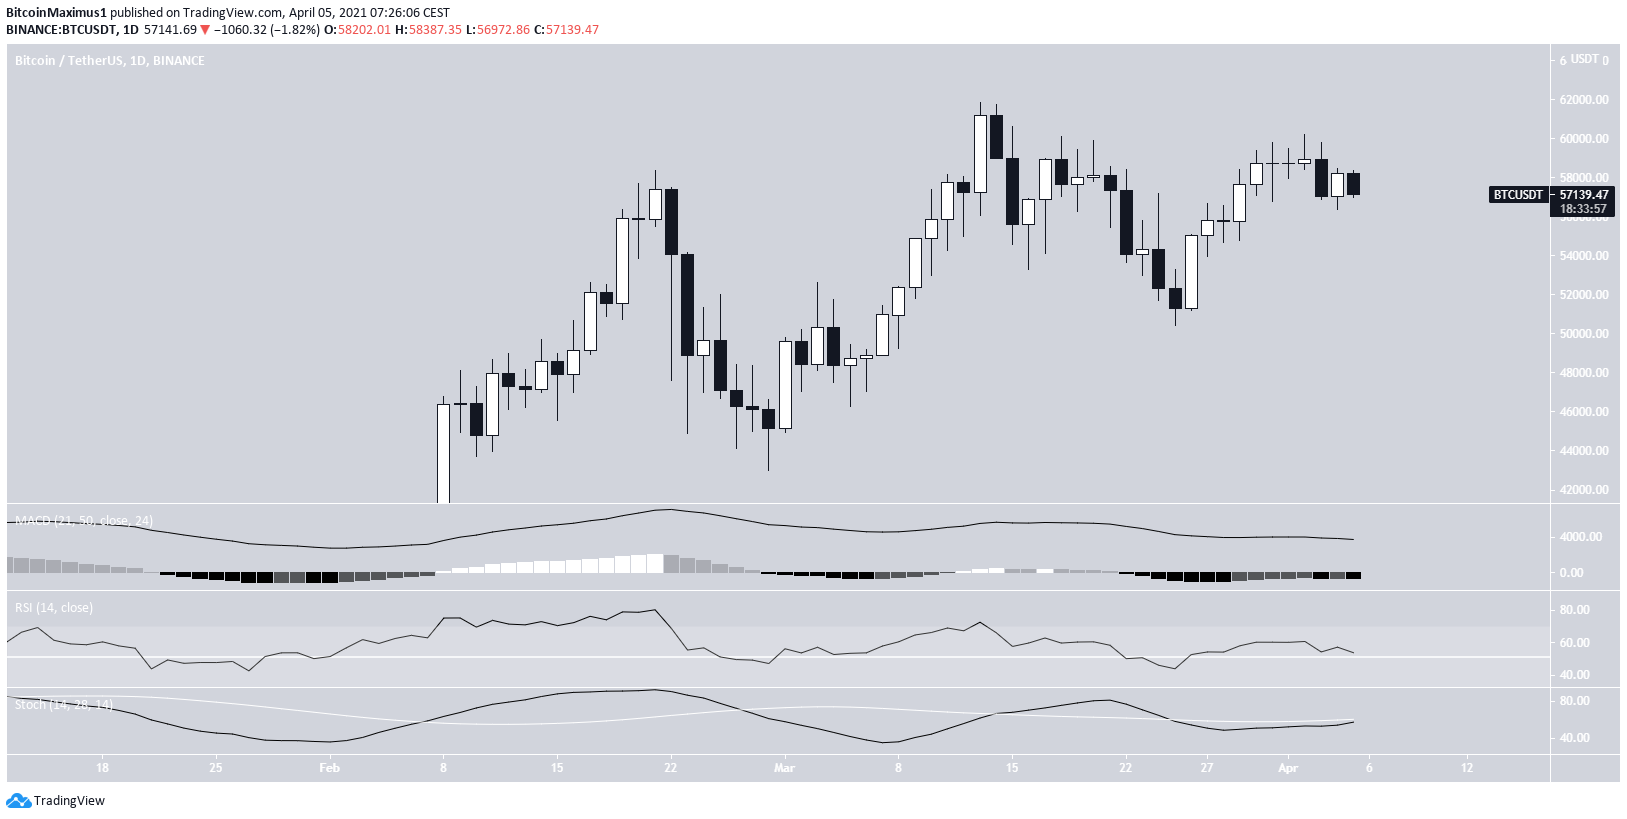
Will BTC Find Support?
Technical indicators in the daily time-frame are more bullish.
The RSI has crossed above 50. The Stochastic oscillator is very close to making a bullish cross and could potentially do so today. While the MACD has yet to give a bullish reversal sign, the value remains positive.
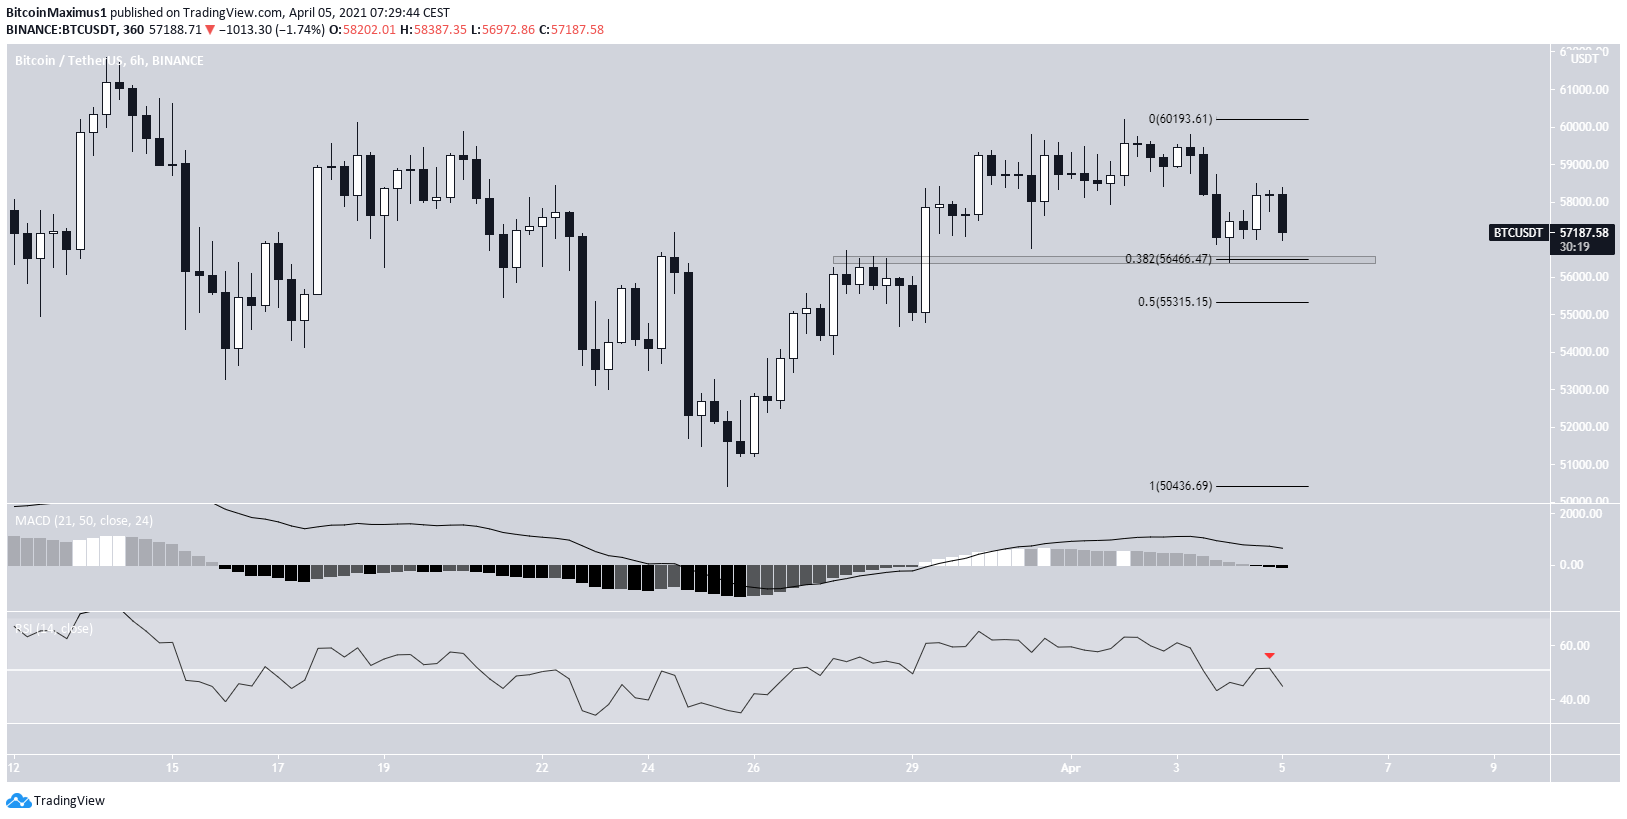
BTC has been decreasing since April 2 when it reached a high of $60,200. At the moment, it’s currently trying to find support.
The six-hour chart shows that the bounce from the 0.382 Fib retracement level was weak.
Both the RSI and MACD are decreasing.
Therefore, it’s possible that a drop to the 0.5 Fib retracement support level at $55,300 occurs before resuming any upward movement.
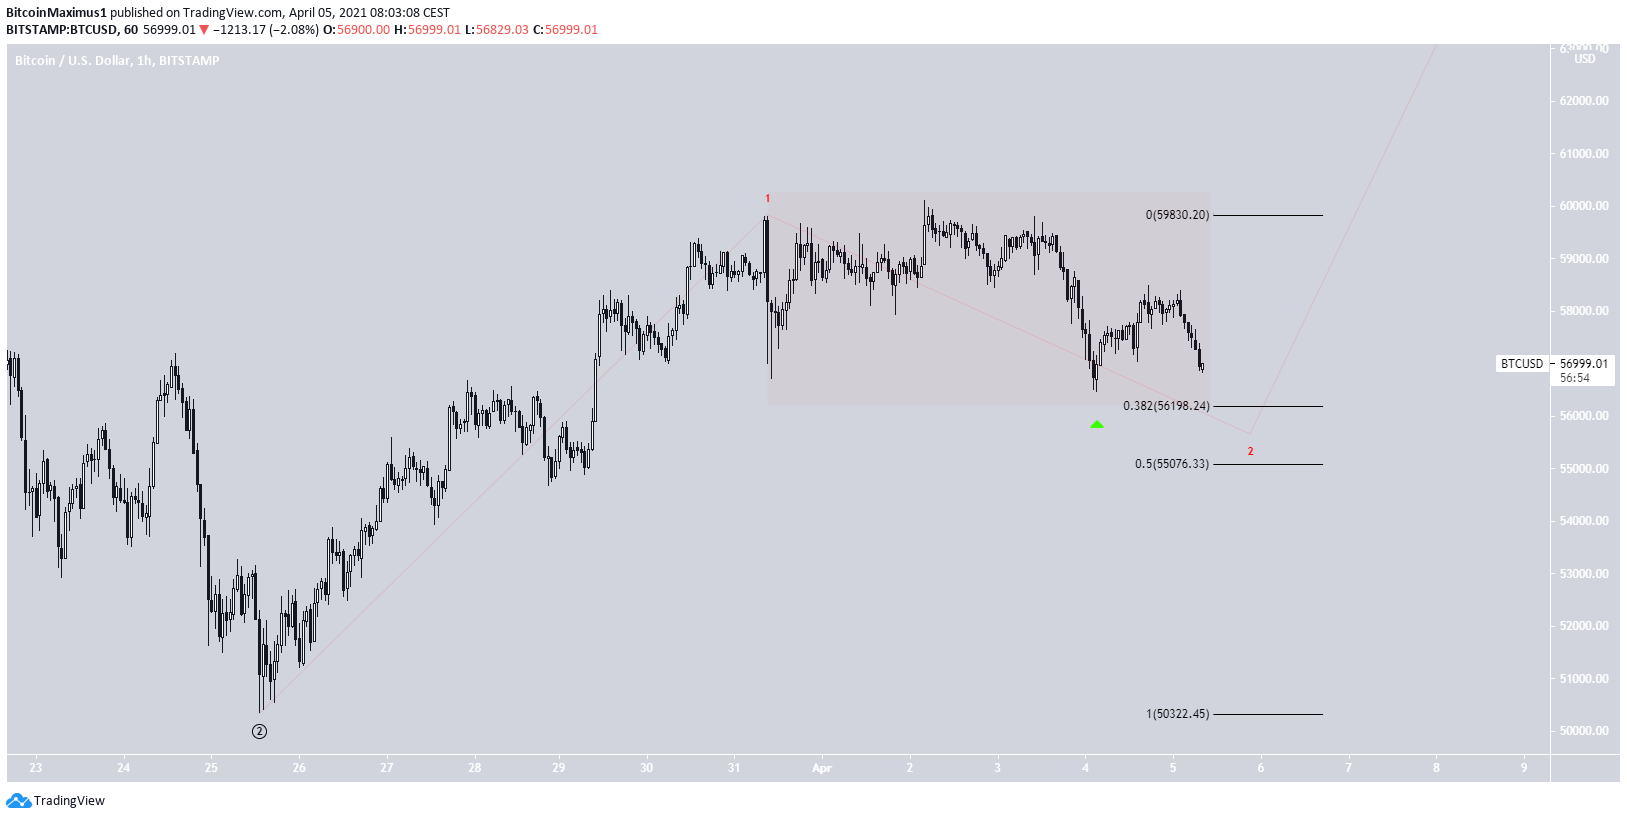
Wave Count
The wave count shows that BTC is likely still correcting (highlighted in red) after completing minor sub-wave one.
However, the movement since the aforementioned bounce (green arrow) does not look like the beginning of an impulse.
Therefore, another eventual low would be likely before the price begins to move upwards.
For the longer-term count, click here.
Conclusion
Bitcoin is still expected to soon reach a new all-time high.
However, since it has not yet found support, another short-term low could be reached prior to resuming its upward movement.
For BeInCrypto’s previous bitcoin (BTC) analysis, click here.


