
On Mar. 1, Bitcoin (BTC) bounced at the minor $44,600 support area, nearly reaching a high of $50,000 after.
It’s possible that this is the beginning of an upward move that will carry Bitcoin above the current resistance range of $50,650-$52,450.
Bitcoin Bounces at Support
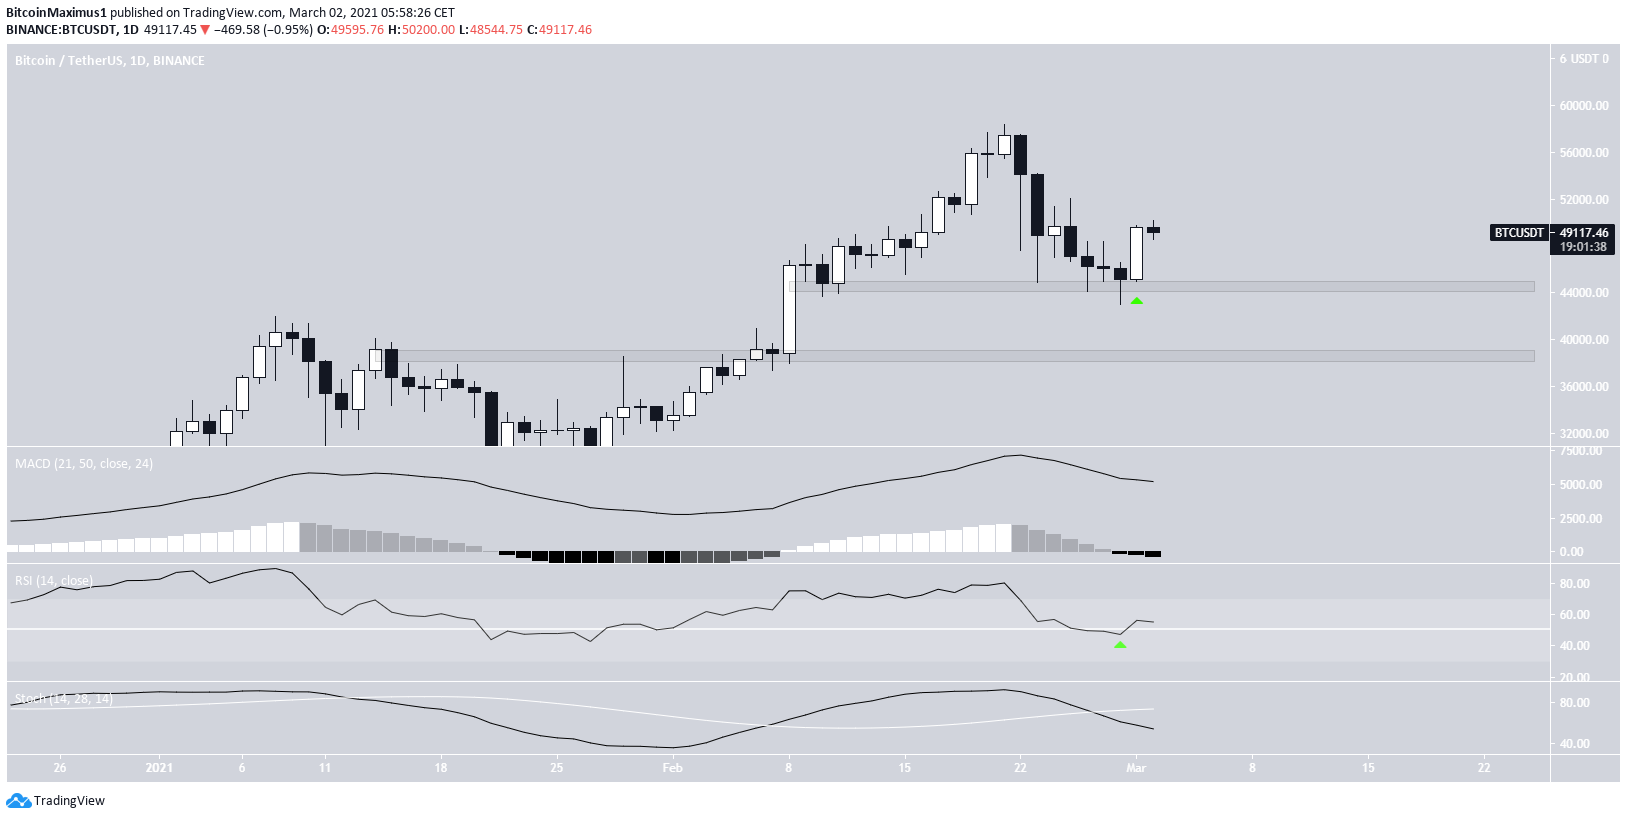
On Mar. 1, Bitcoin bounced at the minor $44,600 support area and created a bullish engulfing candlestick, reaching a high of $49,790. The bounce also coincided with a daily RSI bounce at the 50-line.
While this is a strong bullish sign, technical indicators have yet to confirm the bullish trend reversal.
The MACD is still decreasing and has failed to generate a higher momentum bar. The Stochastic oscillator has made a bearish cross.
The next support area is found at $38,600.
Wedge Breakout
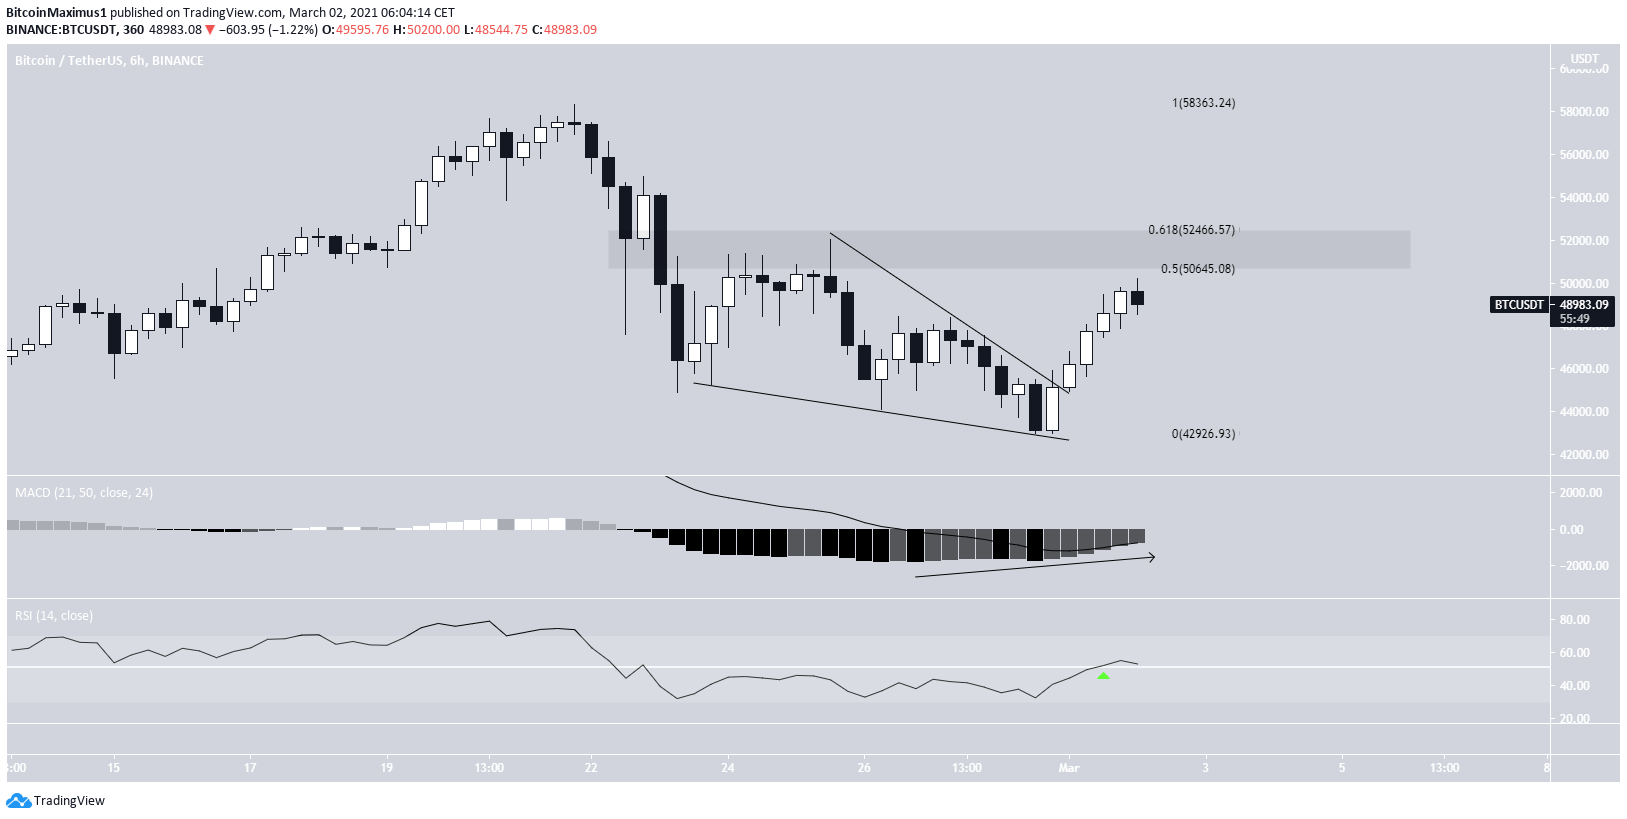
The six-hour chart shows that BTC has broken out from a descending wedge and is currently approaching the 0.5-0.618 Fib retracement resistance area at $50,650-$52,450.
Technical indicators have turned bullish. The MACD has given a bullish reversal signal and the RSI has crossed above 50.
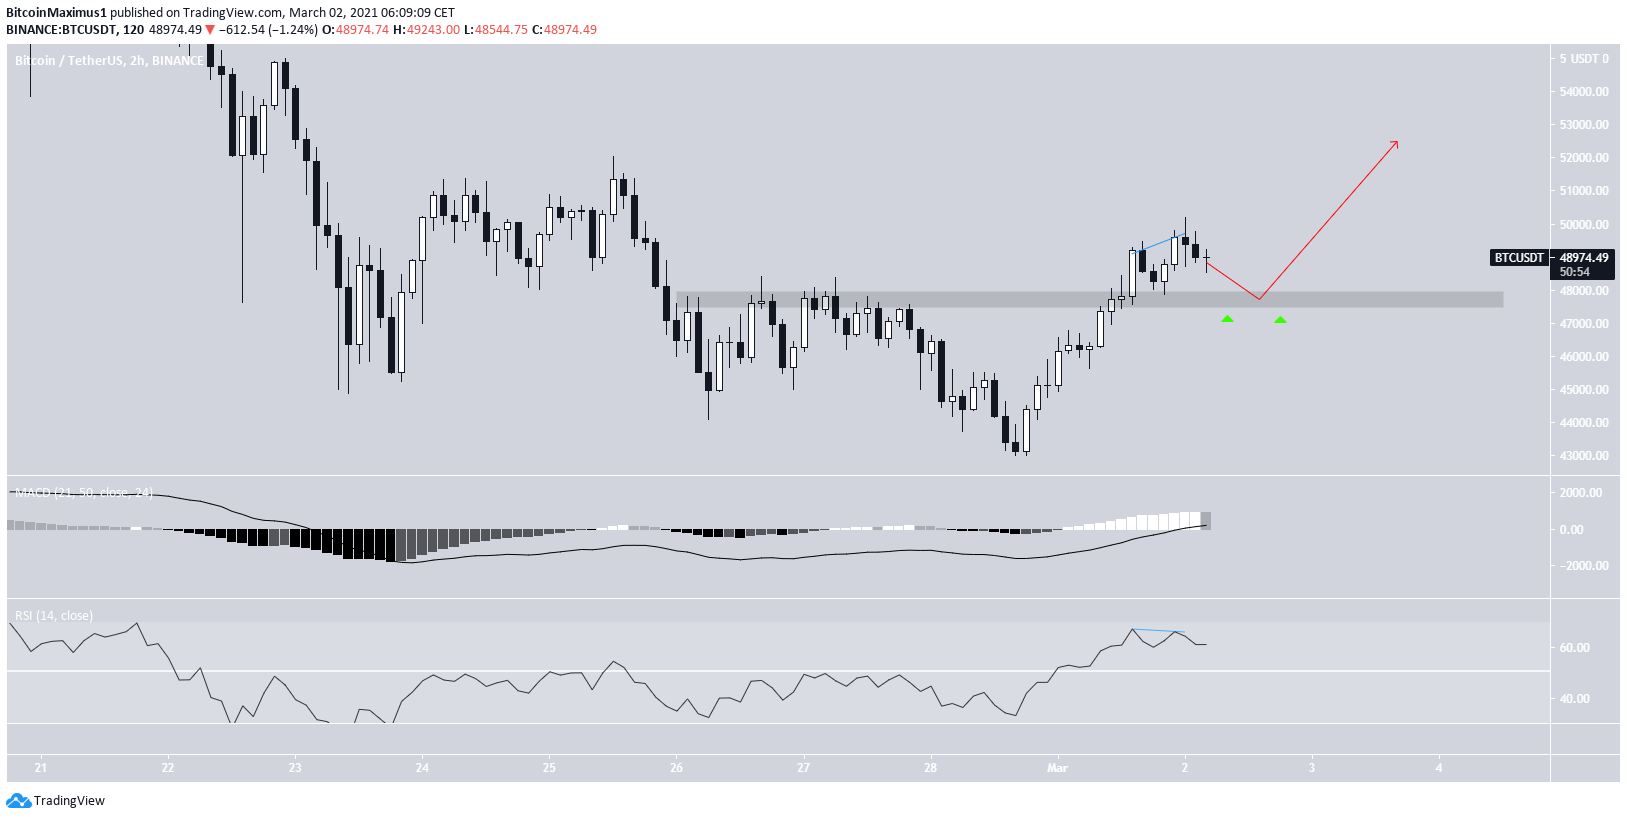
While the two-hour chart shows some weakness in the form of a bearish divergence, it is relatively small. The bearish divergence is insignificant relative to the bullishness from the price action and higher time-frames.
Therefore, while BTC could drop to the minor $47,700 area and validate it as support, it would be expected to move higher after.
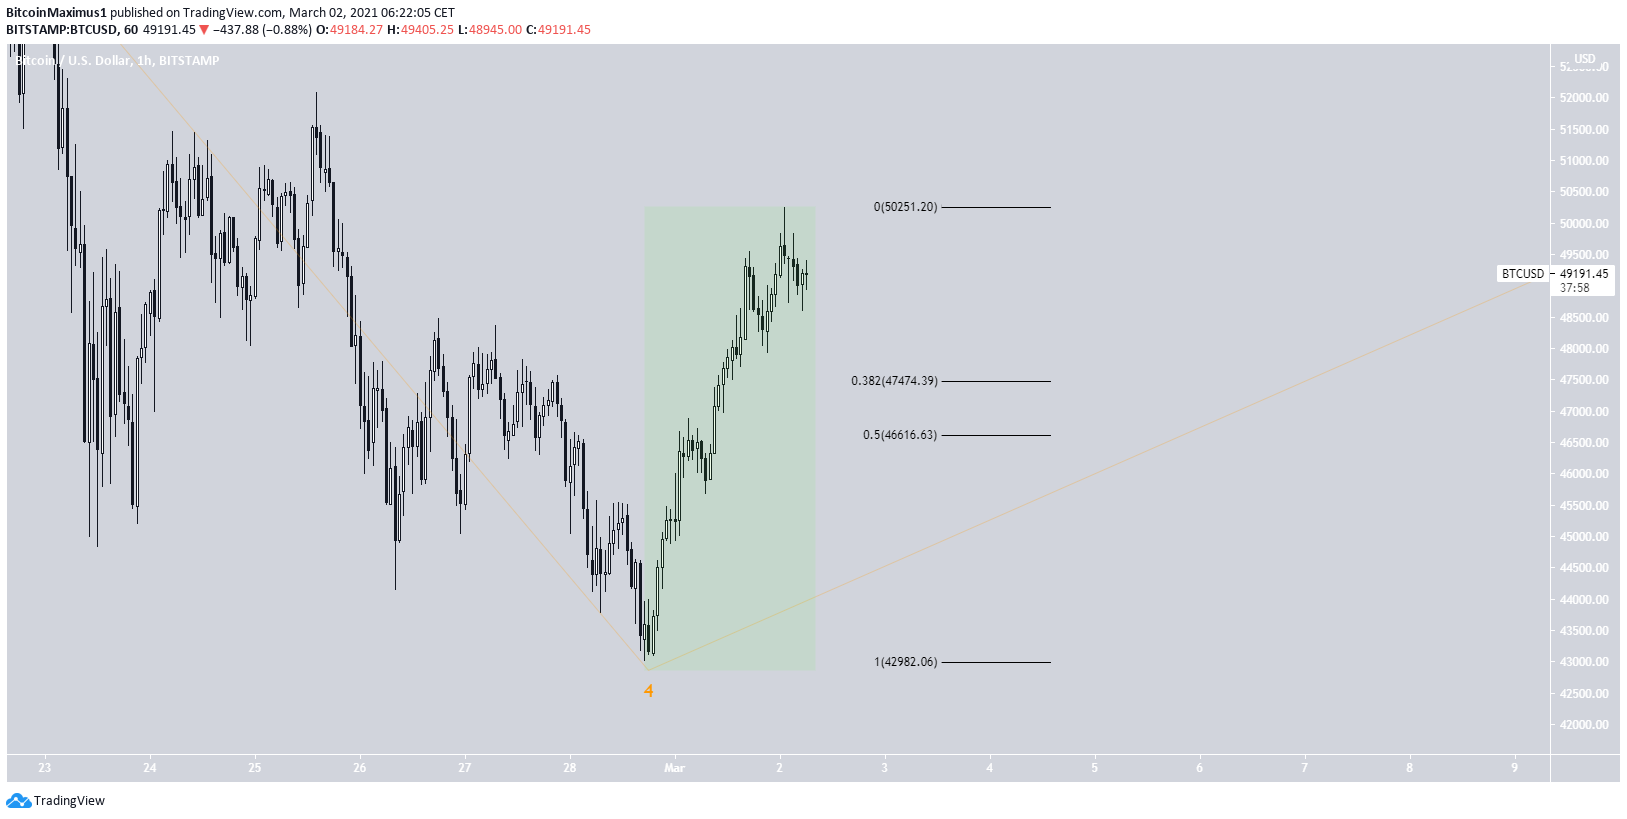
Wave Count
The wave count suggests that BTC is in sub-wave five of a bullish impulse (white) that began in March 2020.
The top of the movement has a target of $63,900-$66,550, found by a combination of Fib projections and external Fib retracements.
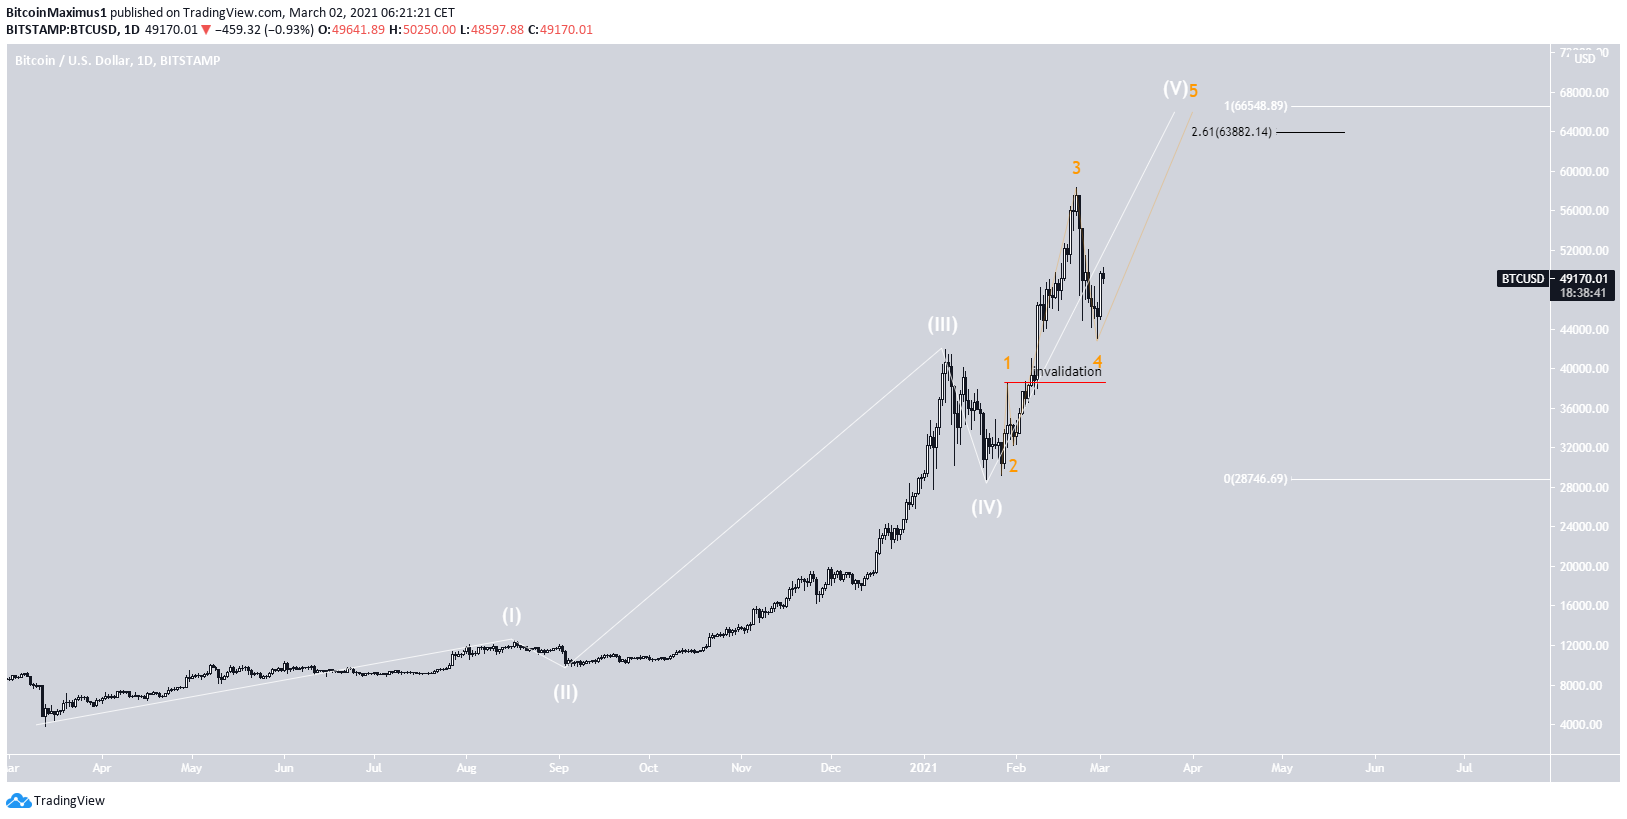
A closer look at the movement shows that the increase looks impulsive. This makes it likely that it’s the beginning of the aforementioned upward movement.
Therefore, while a short-term drop could occur, BTC would be expected to continue moving higher after.
Conclusion
While a short-term drop could potentially transpire, Bitcoin is expected to continue increasing towards the $50,650-$52,450 range before eventually breaking out.
For BeInCrypto’s previous Bitcoin (BTC) analysis, click here.
