


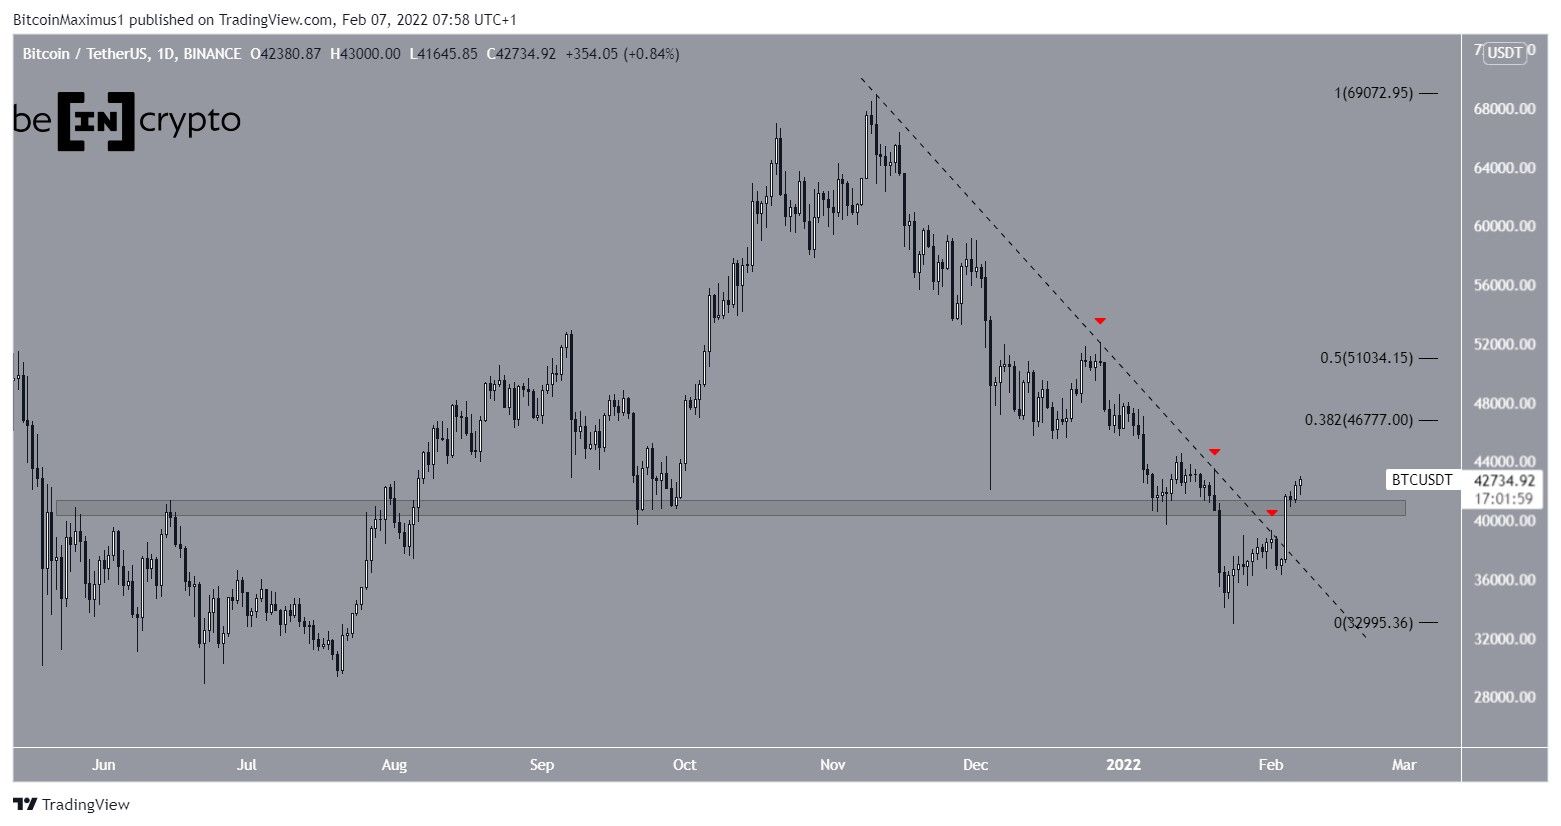
Bitcoin (BTC) has been increasing since Jan 24 and finally broke out from a crucial resistance area on Feb 4.
Bitcoin had been decreasing underneath a descending resistance line since reaching an all-time high price on Nov 10. The downward move led to a local low of $32,917 on Jan 24. BTC has rebounded since then and has been moving upwards.
After three unsuccessful attempts (red icons), BTC finally managed to break out over the descending resistance on Feb 4, creating a large bullish candlestick. This also caused it to move above the $40,800 horizontal resistance area in the process. The area is now expected to act as support.
The closest resistance areas are found at $46,780 and $51,000. These targets are the respective 0.382 and 0.5 Fib retracement resistance levels.
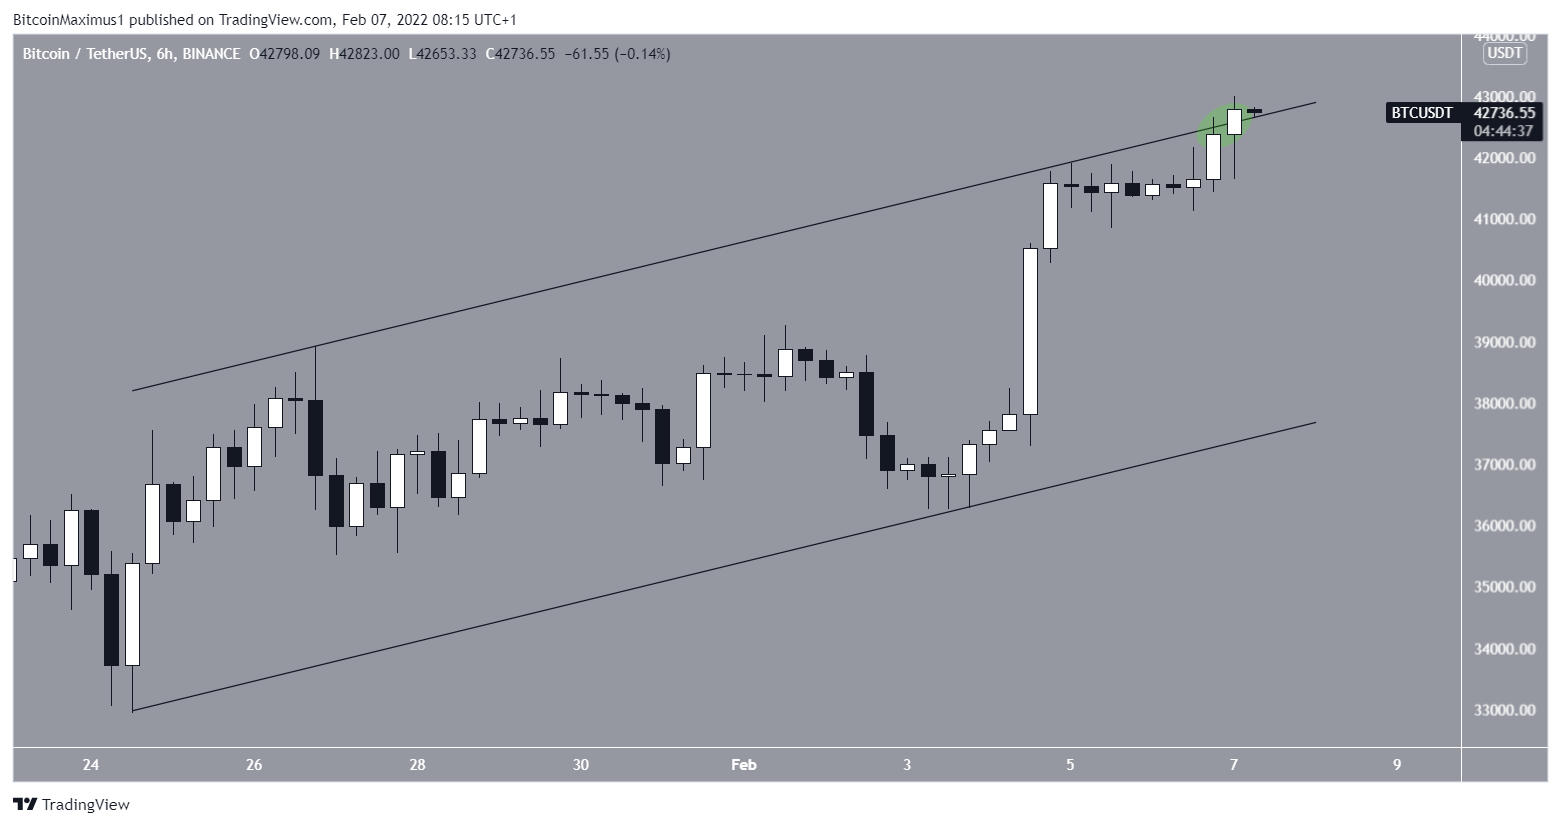
Current BTC pattern
The six-hour chart shows that BTC is trading inside an ascending parallel channel since the aforementioned Jan 24 low.
It’s currently in the process of breaking out from the ascending resistance line (green circle). Since channels are usually considered corrective patterns, whether BTC breaks out from it or gets rejected will help in determining the direction of the short-term trend.
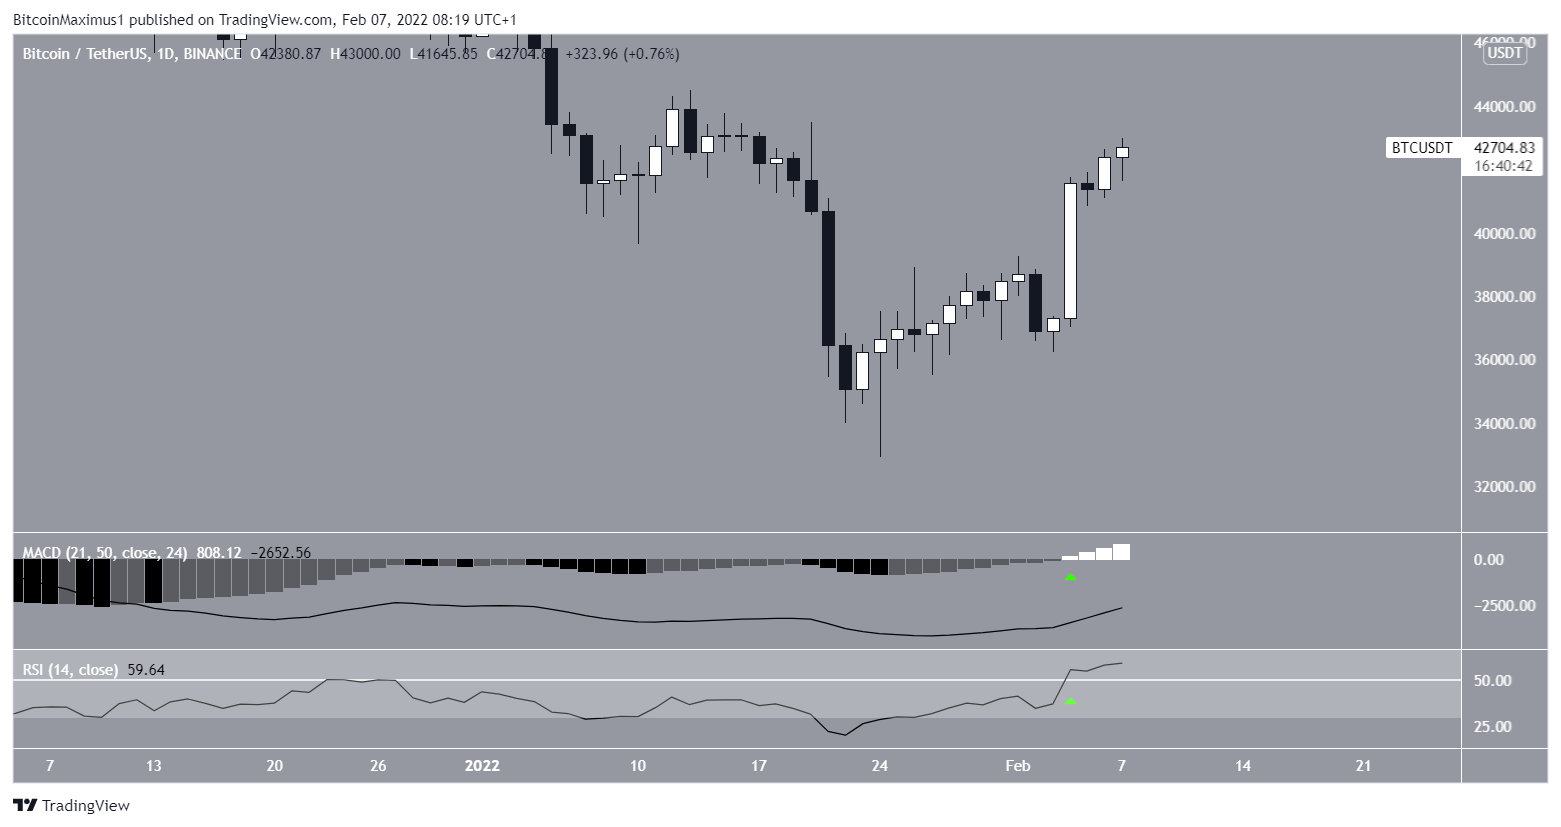
Technical indicators
BTC technical indicators in the daily time frame are bullish and support the continuation of the upward move. This is visible in both the RSI and MACD.
The RSI, which is a momentum indicator, has moved above 50. This is considered a sign of bullish trends.
The MACD, which is created by short and long-term moving averages, is in positive territory. The previous times this occurred, a significant upward price movement followed.
Readings in the daily time frame suggest that BTC will break out from the parallel channel. In this case, BTC would likely increase toward the previously outlined resistance levels at $46,780 and $51,000.
For BeInCrypto’s previous Bitcoin (BTC) analysis, click here


