
Bitcoin (BTC) increased considerably on July 26, managing to reach the range high at $40,550.
However, it failed to break out and is now attempting to find support in order to make another breakout attempt.
BTC attempts to break range highs
The daily chart shows that BTC reached a local high of $40,550, going into the range highs that have been in place since May.
However, the rally could not be sustained and BTC created a long upper wick (red icon). It proceeded to close the day at $37,237.
Technical indicators are bullish. The Stochastic oscillator has made a bullish cross and the RSI is above 50. In addition to this, the MACD is moving upwards and has nearly crossed into positive territory.

Future movement
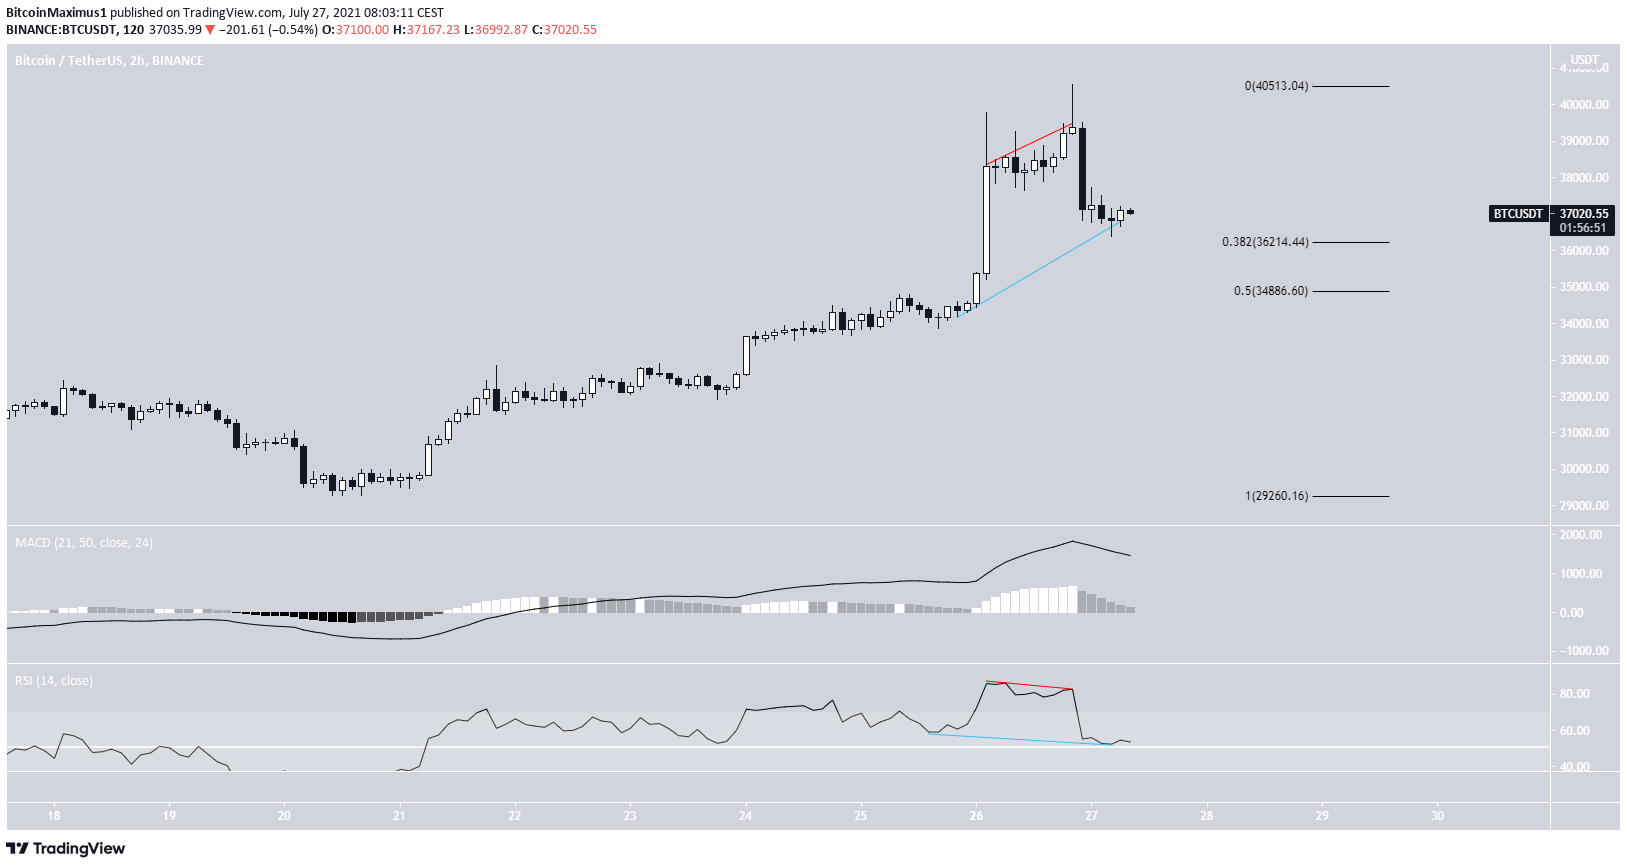
The two-hour chart shows that the rejection and drop were preceded by a bearish divergence in the RSI (red line).
Currently, it’s trying to find support at the 0.382 Fib retracement support level at $36,215. The next support is found at $34,885. This is the 0.5 Fib retracement support level.
Despite the drop, technical indicators are not bearish yet. The MACD is still positive and the RSI is above 50. In addition, the latter has generated a hidden bullish divergence.
Therefore, the most likely scenario would have BTC creating a higher low and continuing upwards.
Wave count
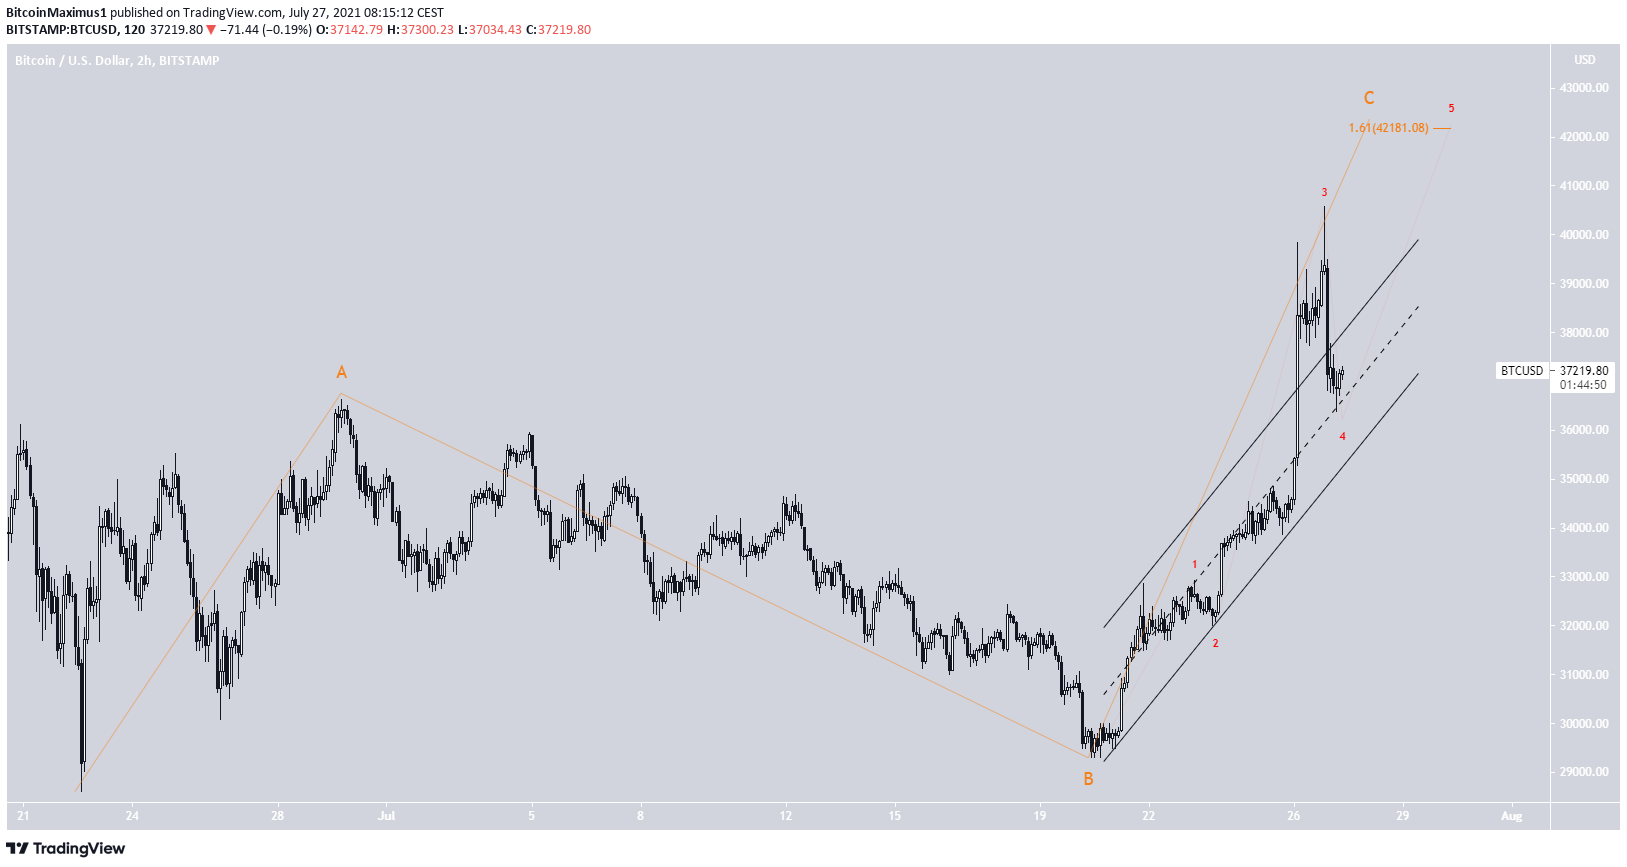
The wave count suggests that BTC is in the C wave (orange) of an A-B-C corrective structure. The sub-wave count is shown in red.
The most likely target for the top of the move is $42,181. This would give waves A:C a 1:1.61 ratio.
BTC appears to be in sub-wave four, completing a fourth wave pullback and has one more high left.
After the target is reached, one more drop would be likely.
For BeInCrypto’s previous bitcoin (BTC) analysis, click here.
