
Bitcoin (BTC) was rejected by a long-term resistance line last week and created a bearish engulfing candlestick. The price is at risk of breaking down from a long-term horizontal support area.
The Federal Open Market Committee (FOMC) will meet on Sept. 20 and 21 in order to discuss how to tackle the inflation issue. So far, the FOMC has raised federal fund rates by 25 basis points (bps) in March 2022, by 50 bps in May, and finally by 75 bps in June. Currently, there is an 82% probability of a 75-basis points bps rate hike and an 18% chance of a 100-bps rate hike. These would increase the target rate to 300-325 or 325-350, respectively.
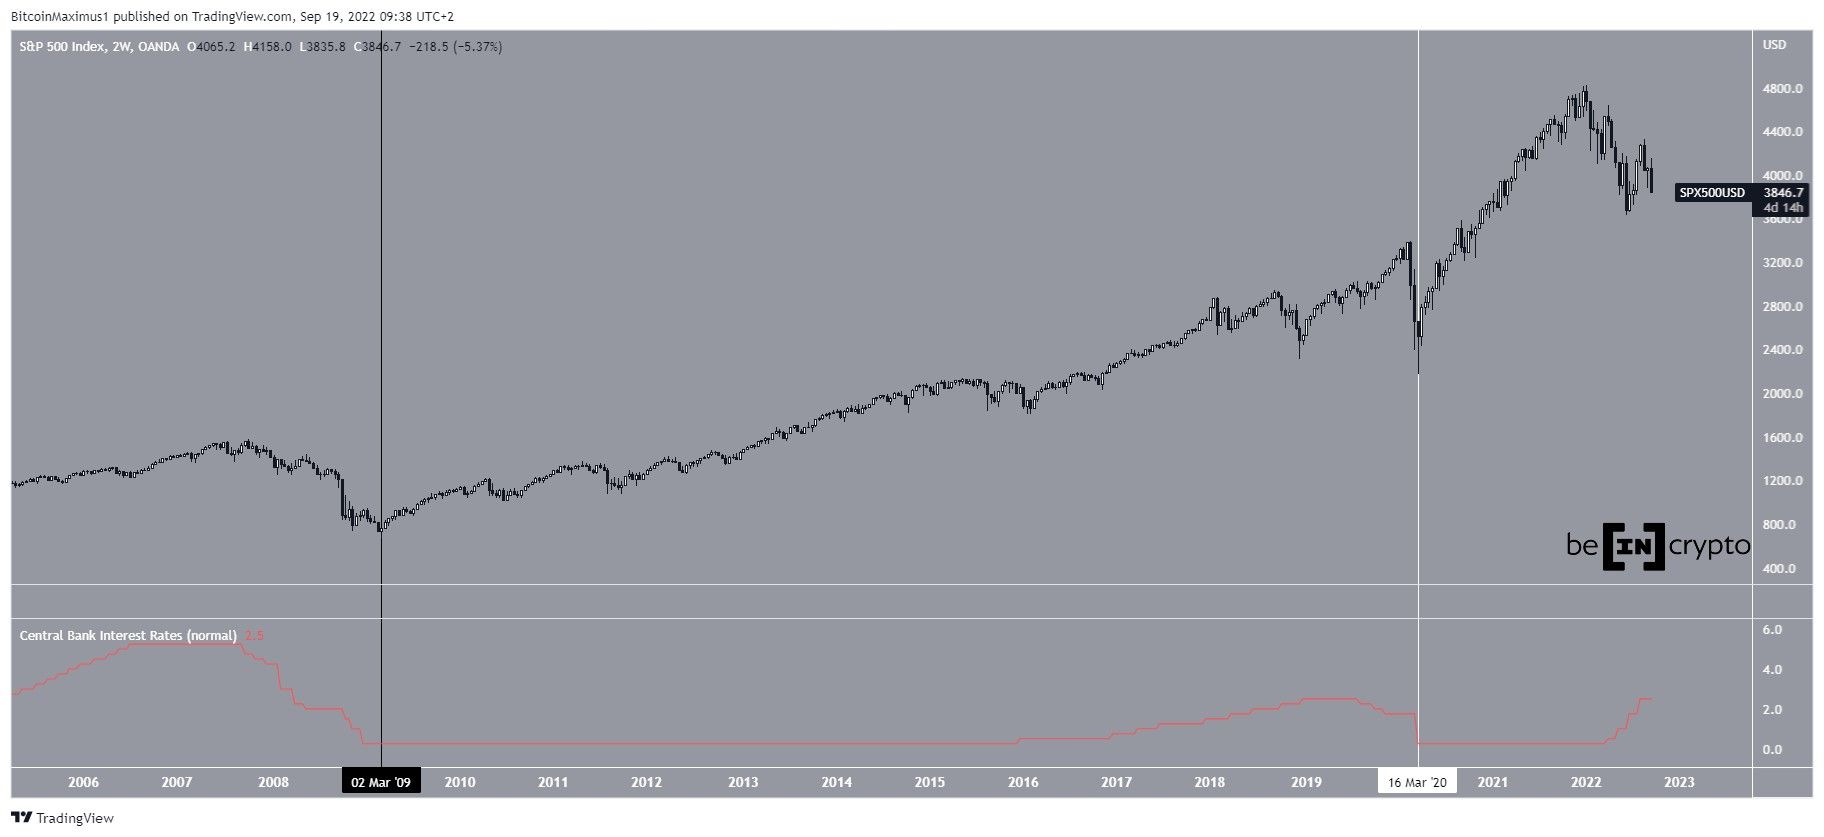
Benjamin J. Cohen, a well-known political economist, stated that: “If you look at prior periods of high inflation and FED rate hiking cycles, there is actually plenty of evidence that the bottom will not be in until the FED gets close to the end of their next round of rate cuts, rather than rate hikes. However, there are some instances in history, when the SPX bottomed near when rate hikes ended”
This can be clearly seen in both 2009 (black) and 2020 (white). Interest rates (red) had been falling for close to a year before the S&P500 finally reached a bottom. So, since the Fed is still raising its interest rates, this would suggest that the current S&P 500 bottom is still not in.
With that in mind, it’s intriguing to look at the price movement of BTC to estimate where a bottom will be reached in this current cycle.
BTC movement
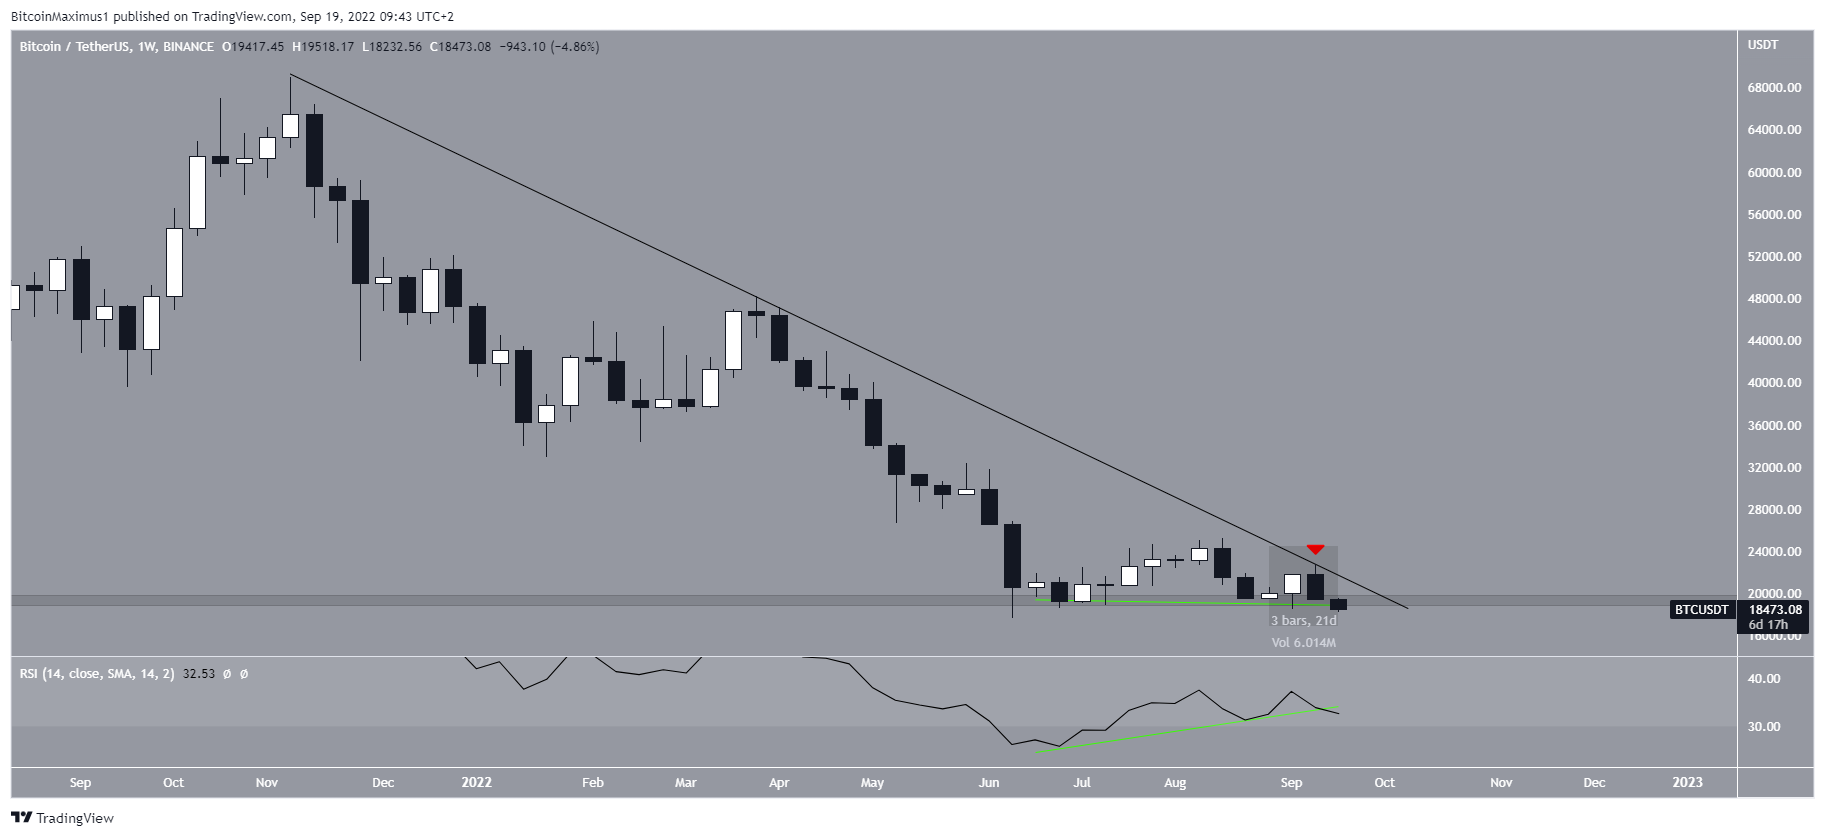
BTC has been falling since reaching an all-time high price of $69,000 in November 2021. The downward movement has so far led to a local low of $17,622 in June 2022.
While Bitcoin began an upward move shortly after, it was rejected by the descending resistance line last week (red icon) and promptly created a bearish engulfing candlestick (highlighted) in the weekly chart. This is a bearish candlestick pattern in which the entire previous week’s increase is negated the following week.
On the bullish side, the weekly RSI seems to have developed a bullish divergence (green line). However, the divergence is not yet confirmed and could be invalidated with a continued drop in price.
Additionally, BTC is at risk of breaking down below the $19,000 horizontal support area. Since the area coincides with the yearly lows, a breakdown below it could cause a swift drop to new lows.
A weekly close below this area would confirm a bearish outlook while a breakout above the resistance line would invalidate it.
For Be[in]Crypto’s previous Bitcoin (BTC) analysis, click here
